Practical eBPF in 30 Days
A hands-on, experiment-driven path through modern eBPF on Linux 7.1. Written in Head First style with rendered diagrams.
What you’ll know by Day 30
- How BPF programs are compiled, verified, JITed, and attached.
- The verifier’s type system and how to read its rejection messages fluently.
- CO-RE, BTF, and how libbpf relocates field offsets at load time.
- Tracing with fentry/fexit/tracepoints/uprobes; capturing stacks; building flame graphs.
- Networking BPF: XDP, tc/tcx, AF_XDP, cgroup_skb, sockops.
- Modern primitives: kfuncs, kptrs, struct_ops, BTF spelunking.
- The frontier: sched_ext (BPF-defined kernel schedulers).
Phases
| Phase | Days | Focus |
|---|---|---|
| 1: Foundation | 1–5 | libbpf workflow, CO-RE, verifier intuition |
| 2: Tracing | 6–13 | fentry/fexit, tracepoints, stacks, uprobes, sleepable |
| 3: Networking | 14–19 | XDP, tc, tcx, AF_XDP, cgroup/sockops |
| 4: Modern primitives | 20–24 | kfuncs, kptrs, struct_ops, BTF |
| 5: Frontier + capstone | 25–30 | sched_ext, capstone project |
How to use this
Each day is ~75–90 minutes. Format:
- Concepts introduced today — what the new primitives are, before any code uses them.
- The lab — runnable code with line-by-line walkthrough.
- What to break, in order — deliberate mistakes that teach the most.
- What to read in the kernel — specific files and functions in your kernel checkout.
- Bullet Points — terse summary you can review before bed.
- Check question — single recall prompt for tomorrow morning.
The most important step is the deliberate breakage. Don’t skip it. Five minutes of pain per lab; saves you weeks of confusion later.
Lab source and prerequisites
Start with the Lab environment page. It defines the Linux toolchain, pinned recursive dependencies, locked Linux v7.1 source, privilege boundary, and per-backend build commands.
Every published entry has a lab record under ebpf/labs/. Days 1–21, Day 24, and the reference capstone use checked-in source whose primary chapter listings are included from the same files compiled in CI. Day 22 and Days 25/27 wrap exact upstream v7.1 targets; Days 23/26 carry complete repo-owned derivatives built against that locked tree. make -C ebpf/labs check-coverage prevents a chapter from silently falling out of this contract.
Style notes
- Head First voice. Conversational, second-person, with the Verifier as a recurring character.
- Real diagrams. Every concept that benefits from visualization gets a rendered PNG.
- No bcc. Modern libbpf + CO-RE only.
Companion book
This book assumes you already know the kernel network stack. If you don’t, read the Linux Network Subsystem book first — it covers sk_buff, the RX/TX paths, netfilter, and other pieces that BPF programs hook into.
Lab environment
The book targets Linux 7.1. Reading and rendering the mdBook works on other platforms; compiling or running the eBPF labs requires Linux.
Use an isolated Linux host
Use a disposable VM or dedicated development machine where you have root. Tracing labs attach read-only programs, but later chapters exercise XDP, tc, tcx, AF_XDP, cgroups, TCP struct_ops, and sched_ext. Never learn those hooks on the interface carrying your only SSH session or on a production scheduler.
For runtime work the kernel needs BTF at /sys/kernel/btf/vmlinux, BPF syscall
and JIT support, and each chapter’s hook/map/kfunc configuration. Linux 7.1
provides the required APIs when its corresponding BPF, networking, cgroup,
TCP-congestion-control, and sched_ext options are enabled. The preflight checks
what it can without changing the host; attachment failures still report the
specific unavailable hook or kfunc.
Clone the pinned dependencies
git clone --recurse-submodules https://github.com/biefy/books.git
cd books
For an existing clone:
git submodule update --init --recursive
The repository pins:
- libbpf-bootstrap at
fac4e8ddf011aead8e14962bf8db74542331264b, recursively including libbpf, bpftool, and architecturevmlinux.h; - xdp-tools/libxdp v1.6.3 at
8fbad9f0af621a22aa87ff2520b3735915b1f0fd; - the official Linux 7.1 archive and commit in
ebpf/labs/linux-source.lock.json.
Do not replace these with moving branches when validating book code.
Install build prerequisites
You need Clang 17+ with the BPF target, a C compiler, GNU Make, Git, Python 3, libelf/zlib development headers, and m4 for the pinned libxdp build. The kernel-backed DCTCP and sched_ext builds add ordinary kernel build tools. On Ubuntu or Debian:
sudo apt update
sudo apt install -y \
  clang llvm git make gcc libc6-dev libelf-dev zlib1g-dev pkg-config python3 \
  curl xz-utils m4 flex bison pahole libssl-dev libcap-dev libunwind-dev \
  libdw-dev libpcap-dev bc rsync binutils iproute2 iperf3
Package names differ on other distributions. Repository scripts do not install
packages, invoke sudo, mount filesystems, or silently fetch dependencies.
Run the check-only standalone preflight:
ebpf/labs/scripts/preflight.sh
Add --kernel after selecting/fetching the locked source and --runtime when
you also want checks against the running host:
ebpf/labs/scripts/linux-source.sh fetch
ebpf/labs/scripts/preflight.sh --kernel --runtime
Build all lab sources
The quick path compiles every repository-owned standalone lab, including AF_XDP and the reference capstone:
make -C ebpf/labs check-standalone
The exhaustive check also builds the canonical Linux v7.1 DCTCP object and the sched_ext backends:
ebpf/labs/scripts/linux-source.sh fetch
make -C ebpf/labs check
Use an existing exact checkout with LINUX_SRC=/path/to/linux. The helper
rejects other commits/releases. Build one chapter with make -C ebpf/labs dayNN;
use day28-30 for the combined capstone. All generated artifacts stay
under ebpf/labs/.output/ and make clean removes them. Kernel-backed wrappers
build only the relevant v7.1 aggregate, convert its DWARF to BTF, and generate a
narrow vmlinux.h; compilation never depends on the build host’s kernel BTF.
Coverage by backend
| Days | Runnable source/build owner |
|---|---|
| 1–21, 24 | Repo-owned standalone libbpf/libxdp apps |
| 22 | Exact Linux v7.1 DCTCP BPF selftest wrapper |
| 23 | Repo-owned telemetry DCTCP derivative against v7.1 support |
| 25 | Exact v7.1 tools/sched_ext/scx_simple wrapper |
| 26 | Repo-owned priority-cgroup sched_ext derivative against v7.1 support |
| 27 | Exact v7.1 tools/sched_ext/scx_central wrapper |
| 28–30 | Repo-owned Option A reference capstone; the other project choices remain open-ended |
make check-coverage compares this curriculum mechanically with
SUMMARY.md, manifest.json, the source tree, and the chapter includes.
Run without leaking state
Run ordinary loaders in the foreground and stop them with Ctrl-C. Their signal paths destroy skeleton-owned links and maps; nothing is pinned unless a chapter explicitly teaches pinning.
The privileged smoke dispatcher is opt-in and accepts an explicit day list:
EBPF_LABS_ALLOW_PRIVILEGED=1 \
  sudo --preserve-env=EBPF_LABS_ALLOW_PRIVILEGED \
  ebpf/labs/scripts/smoke.sh day01 day14
It owns its triggers, child PIDs, temporary files, namespaces/veths, qdiscs,
and cgroups and cleans them in reverse order. TCP struct_ops registration additionally requires EBPF_LABS_ALLOW_STRUCT_OPS=1;
sched_ext replacement requires EBPF_LABS_ALLOW_SCHED_EXT=1. Run either only
on a disposable compatible VM. Hosted CI performs compile/link/BTF and
locked-source builds only; it never performs privileged attachment.
Day 1 — First fentry program with ringbuf
Today’s mission: spy on every file deletion on your system, in real time, with a program that runs inside the kernel and can’t crash it. Along the way, meet the whole machine that makes this possible — the BPF virtual CPU, the one syscall that loads everything, the just-in-time compiler, and the little code-patching trick that lets you tap a running kernel without a hiccup. Total time: ~120 minutes.
So you want to spy on a kernel function
You’d think this would be hard. The kernel is busy. It runs thousands of functions per second across dozens of CPUs. It does not know you exist. How do you get it to tap you on the shoulder every time something calls filename_unlinkat?
You install a doorbell. That’s fentry.
Here’s the secret on x86_64 builds with function tracing enabled. Traceable kernel functions reserve an entry patch site, often shown as a 5-byte NOP slot. It sits there doing nothing until ftrace/BPF turns it into an entry call path.
filename_unlinkat:
    nop   nop   nop   nop   nop      ← these 5 bytes are reserved for you
    push  %rbp                       ← the actual function body starts here
    mov   %rsp, %rbp
    ...
Whose 5 bytes are those, anyway?
That slot is not BPF’s, and BPF didn’t put it there. It exists because the kernel is built with function-entry instrumentation (-pg / -mfentry): the compiler emits a call __fentry__ at the top of every traceable function (the entry stub is SYM_FUNC_START(__fentry__) at arch/x86/kernel/ftrace_64.S:148). At boot, ftrace — the kernel’s built-in function tracer, around since 2008 — overwrites each of those call sites with a 5-byte NOP. The NOP it writes is literally x86_nops[5] (ftrace_nop_replace() returns it at arch/x86/kernel/ftrace.c:66; the table is at arch/x86/kernel/alternative.c:91).
So the patch site is ftrace’s. fentry/BPF doesn’t own it — it borrows it by registering an ftrace “direct call” that repoints the site at your trampoline. You don’t need to learn ftrace today; just hold the one-line model: the compiler reserves the slot, ftrace owns it, fentry hangs your program off it.
When you attach an fentry program, the kernel atomically patches that reserved site into the architecture’s ftrace/BPF entry path. That path reaches a generated trampoline. The trampoline saves arguments, calls your BPF program with them, restores everything, and then lets filename_unlinkat run as if nothing happened. The exact instruction is architecture- and config-dependent; the important model is patch site → trampoline → original function body.

What the trampoline is actually for: an ABI bridge
“Saves arguments, calls your program with them” sounds like magic until you ask: why does it need to save anything? The answer is that the function being traced and your BPF program are called two incompatible ways.
filename_unlinkat is an ordinary C function. On x86-64, the System V ABI says its first argument arrives in register rdi, its second in rsi, and so on:
int filename_unlinkat(int dfd, struct filename *name)   /* fs/namei.c:5536 */
/*                        ↑ rdi          ↑ rsi                              */
A BPF program, by contrast, is not called with arguments spread across native registers. By convention every BPF program receives exactly one pointer — a pointer to a u64[] context array — in its first BPF register, R1 — the BPF VM’s registers get their full introduction in “Meet the cast” below; for now just hold “R1 = the one pointer your program is handed.” R1 → ctx, and that’s it. The program reads ctx[0], ctx[1], … to get its inputs.
Those two calling conventions don’t line up. Native code puts dfd in rdi; BPF code expects it as ctx[0]. Bridging that gap is the trampoline’s entire job:
- On entry it spills the native argument registers into a
u64 ctx[]array on the stack:ctx[0] = rdi (dfd),ctx[1] = rsi (name). - It calls your BPF program with
R1pointing at that array. - On return it restores the registers and falls through into the real body of
filename_unlinkat.
That ctx[] array is the “argument array” the BPF_PROG macro unpacks. When you write
int BPF_PROG(on_unlink, int dfd, struct filename *name)
the macro (at tools/lib/bpf/bpf_tracing.h:672) expands to read ctx[0] as dfd and ctx[1] as name, casting each to the type you declared. This is the concrete payoff of BTF (below): BTF tells fentry the argument types, so the trampoline knows how many slots to spill and BPF_PROG knows how to cast them.
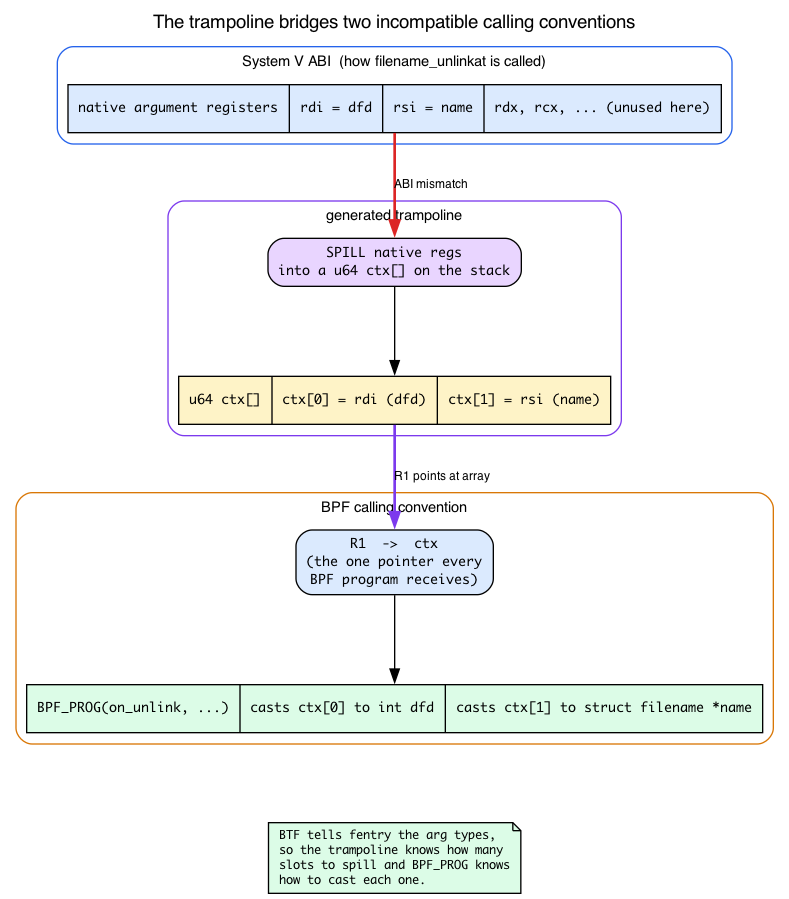
The trampoline isn’t per-program, either: there’s one trampoline per attach target, reference-counted and shared across every program attached there. That’s why the kernel keys them in a hash table — the “What to read” pointer about bpf_trampoline below. Frame it this way: the trampoline’s first job is the argument marshalling; the hash-table bookkeeping is just how the kernel avoids building a second one for the same target.
There are no Dumb Questions
Q: Patching kernel code while it’s running. Isn’t that lunacy?
A: It would be, except the kernel has been doing this since 2008 — it’s how
ftraceworks. The 5-NOP slot is reserved by the compiler at build time specifically so the kernel can patch it later. The patch goes through the kernel’s int3-based text-poke machinery, which is safe against concurrent instruction fetches on every CPU (the file:line specifics are in the “What to read” trampoline bullet at the end). You can install and remove fentry hooks while the kernel runs your browser, a database, and a video call without a hiccup.Q: Why not use kprobe? I keep seeing kprobe in old tutorials.
A: kprobe predates fentry and works differently. It overwrites the function’s first instruction with a software breakpoint (
int3on x86). The CPU traps, a handler runs your code, then it emulates the original instruction and continues. Works on any function. The trap is expensive; fentry’s direct entry path is typically several times cheaper than a kprobe trap, though exact numbers vary by CPU and kernel config. Use fentry whenever it’s available; kprobe only for the rare functions that lack BTF.Q: What does “BTF” mean, and why do you keep mentioning it?
A: Hold that thought — we’ll meet BTF properly in a moment. For Day 1: trust that BTF is what tells fentry the argument types of
filename_unlinkat, so your program can declareint dfd, struct filename *nameand have the kernel hand them over correctly typed.
Sharpen your pencil
On x86_64, the compiler often reserves a 5-byte NOP slot at the start of a traceable function. Why 5? What instruction size is that designed to fit?
.
.
.Answer: a near relative
callorjmpon x86_64 is 5 bytes — 1 opcode byte plus a 4-byte signed offset. The reservation is sized so ftrace can patch the site without moving the function body. Other architectures use their own patch-site shape.
Meet the cast
Before you write code, here’s the full cast of characters.
eBPF in 90 seconds
A BPF program is C code compiled to a stripped-down virtual instruction set (BPF) and loaded into the kernel through the bpf() syscall. Before the kernel runs it, a static analyzer called the Verifier proves the program is safe — it terminates, never reads uninitialized memory, never deref’s a pointer it hasn’t proven valid, and stays within a bounded instruction count. If the program passes, the kernel JITs it to native instructions and runs it whenever the chosen attach point fires. The program cannot crash the kernel and cannot read arbitrary memory — every load is verified at load time. Programs talk to userspace through maps (typed shared data structures).
That paragraph hides three machines worth meeting properly: the virtual CPU your program runs on, the syscall that gets it into the kernel, and the compiler that makes it fast. Let’s take them one at a time — you’ll be reading their fingerprints in error messages within the hour.
The BPF virtual machine: 11 registers and an 8-byte instruction
“A stripped-down virtual instruction set” deserves more than a hand-wave, because the very first error you’ll hit today (Break 1) prints register names at you. So: BPF is a 64-bit RISC-like virtual ISA. It has exactly 11 registers, R0 through R10, each 64 bits wide (BPF_REG_0 = 0 … BPF_REG_10, __MAX_BPF_REG at include/uapi/linux/bpf.h:74). Every instruction is a fixed 8-byte encoding — struct bpf_insn at include/uapi/linux/bpf.h:80 — packing an opcode, a destination register, a source register, an offset, and an immediate.
The registers aren’t interchangeable. They have a calling convention, and you must know it to read verifier output:
| Register | Role |
|---|---|
R0 | Return value — your program’s return, and the return value of any helper you call |
R1–R5 | Argument / scratch registers passed into helpers (and R1 = the ctx pointer on entry) |
R6–R9 | Callee-saved — preserved across helper calls |
R10 | Read-only frame pointer to a fixed 512-byte stack (MAX_BPF_STACK = 512, include/linux/filter.h:98) |
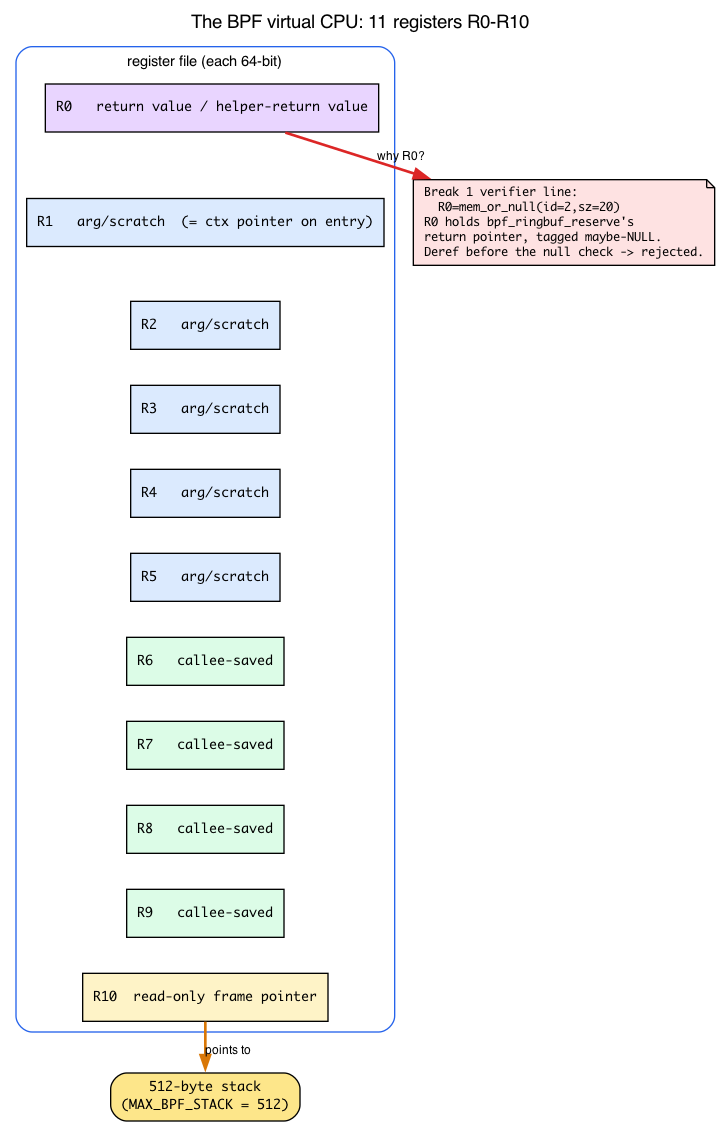
Two things fall straight out of this table. First, R0 = helper return value is exactly why, in Break 1, the result of bpf_ringbuf_reserve lands in R0. Second, when the verifier prints R0=mem_or_null, it’s telling you: R0 holds the pointer the helper returned, and the verifier has tagged it “might be NULL.” Dereferencing it (writing *(u32 *)(r0+0)) without first checking for NULL is the instruction it rejects.
How does the verifier know R0 might be NULL? Because it walks your program one instruction at a time and tracks a type and value-range for every register as it goes. That bookkeeping lives in struct bpf_reg_state and is updated by routines like check_reg_arg in kernel/bpf/verifier.c — the same engine that prints the R0=mem_or_null text you’ll see in Break 1. (You’ll meet the Verifier as a character on Day 4; today you just need to recognize the register names when it complains.)
One more distinction that saves confusion later: there are two different instruction streams in play. The BPF bytecode is what the verifier reads and what struct bpf_insn encodes. The native machine code is what actually runs on the CPU — and a separate stage, the JIT, produces it. Don’t conflate them.
The bpf() syscall: one door, many commands
Everything — creating a map, loading a program, attaching it — enters the kernel through a single syscall: bpf(). There is exactly one entry point, SYSCALL_DEFINE3(bpf, int, cmd, union bpf_attr __user *, uattr, unsigned int, size) at kernel/bpf/syscall.c:6385, and it’s multiplexed by a command enum (the first argument, cmd):
BPF_MAP_CREATE— create a map and return a file descriptor. Dispatches tomap_create()(kernel/bpf/syscall.c:1362).BPF_PROG_LOAD— submit a program’s instructions + BTF, run the Verifier, and return a file descriptor. Dispatches tobpf_prog_load()(kernel/bpf/syscall.c:2864).BPF_LINK_CREATE/ the various attach commands — wire a loaded program to an attach point.
libbpf issues these for you, in sequence: create the maps, then load the program, then attach. (The command names live in include/uapi/linux/bpf.h.)
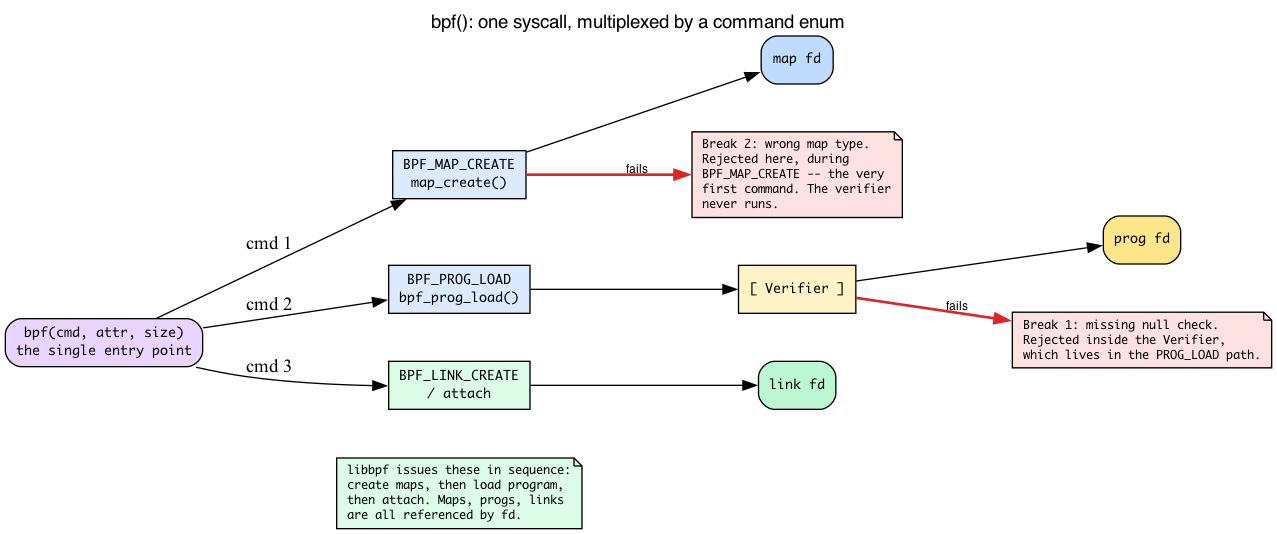
That map creation and program loading are separate commands is the whole reason Break 2 behaves the way it does. When you give the map the wrong type, the kernel rejects it during BPF_MAP_CREATE — before BPF_PROG_LOAD is ever issued, so the Verifier (which lives inside the load path) never even runs. “Fails at the loader, before the verifier” is not hand-waving; it’s literally a different cmd.
And notice the recurring noun: file descriptor. Maps, programs, and links are all referenced by fd returned from bpf(). That’s the substrate under everything you’ll touch in userspace — skel->maps.rb and bpf_map__fd(skel->maps.rb) in hello.c are just typed wrappers around a map fd. A map, in general, is a kernel-resident typed key/value object created by BPF_MAP_CREATE and shared between kernel and userspace by that fd. Ringbuf (below) is one map type; BPF_MAP_TYPE_ARRAY (the one Break 2 mis-uses) is another.
JIT: BPF bytecode becomes native machine code
Once the Verifier accepts your bytecode, the kernel doesn’t interpret it event by event — that would be slow. Instead the BPF JIT (“just-in-time” compiler) rewrites each BPF instruction into the equivalent native CPU instructions (x86-64 here). The translator is bpf_int_jit_compile() at arch/x86/net/bpf_jit_comp.c:3718; it walks the program in do_jit() (around :1652), emitting native code into a buffer described by struct jit_context (:310).
Three things to internalize:
- The JIT runs once, at load time, inside the
BPF_PROG_LOADpath — not on every event. When the attach point fires, it jumps straight into already-compiled native code. - On most production kernels the JIT is on by default, controlled by the
bpf_jit_enablesysctl; setting it to2additionally dumps the JIT image for debugging (if (bpf_jit_enable > 1)atarch/x86/net/bpf_jit_comp.c:3843). An interpreter fallback exists, but it’s the slow path. - This is why fentry + JIT is cheap enough to leave attached on a busy machine — the “no hiccup” claim from the first Dumb Question. At the attach point, there’s no trap and no interpreter loop: just native code calling native code.
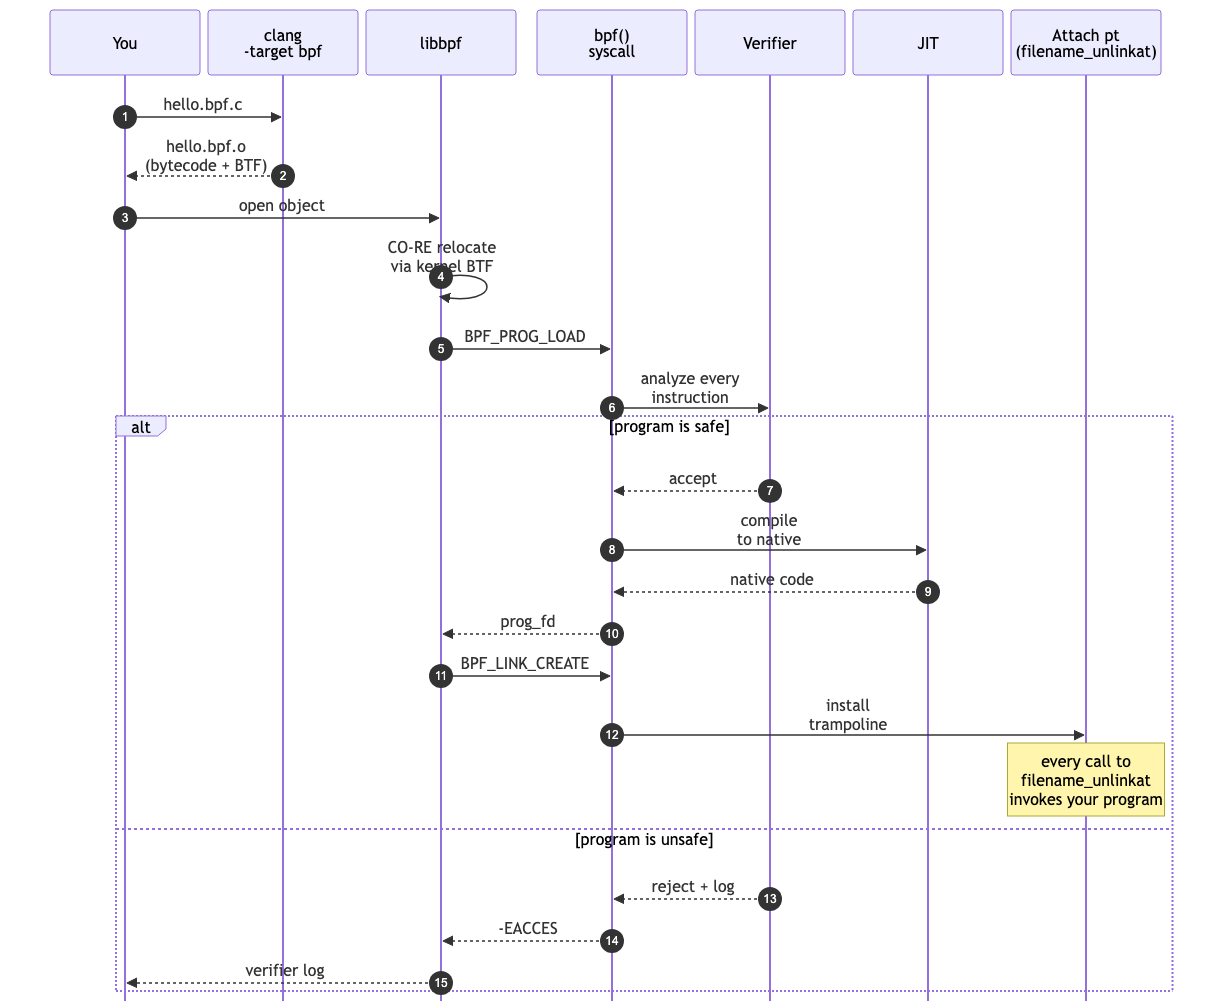
(In that lifecycle picture, the JIT stage sits between “Verifier accepts” and “runs at attach point”: it turns the verified BPF bytecode into native x86 instructions, which is what actually executes when filename_unlinkat is called.)
The Verifier (a recurring character)
The Verifier: Hi. I’m the gatekeeper. Nothing runs in the kernel until I prove it’s safe. I read your program one instruction at a time. I track every register’s type. I track every memory region’s bounds. I track every reference you take. If you do something I can’t prove safe — touch a pointer that might be NULL, run a loop I can’t bound, leak a refcount — I reject your program. My error messages aren’t always pretty, but every one tells you the exact instruction where I lost faith. Read carefully. We’ll be working together a lot.
You’ll meet the Verifier on Day 4. For now, write code that pleases it without trying. (And now you know what “track every register’s type” means literally — R0 through R10, one type each, updated instruction by instruction.)
SEC() — the section-name convention
Every BPF program belongs to a section in the compiled object. The section name tells libbpf how to load and attach the program. The prefix is the program type; the suffix is the attach target:
SEC("fentry/filename_unlinkat")    // type=fentry, attach to kernel symbol filename_unlinkat
SEC("xdp")                    // type=xdp, attach point provided by userspace
SEC("tp/sched/sched_switch")  // type=tracepoint, on the sched_switch tracepoint
The full table lives in tools/lib/bpf/libbpf.c — search static const struct bpf_sec_def section_defs[] (:9987). Bookmark it. Whenever a SEC() “doesn’t work”, that’s the file you check.
BTF (BPF Type Format)
BTF is a compact debug-info-like format the kernel exposes about itself. The running kernel ships its complete type information at /sys/kernel/btf/vmlinux. BPF objects ship BTF about their own types. BTF powers four things you’ll use constantly:
- Verifier type-checking of typed pointers (
PTR_TO_BTF_ID). - CO-RE field-offset relocation at load time.
- Typed argument unpacking for fentry/fexit/tp_btf programs — the ABI bridge from earlier, made concrete: it’s what lets
BPF_PROG(on_unlink, int dfd, struct filename *name)resolve to the right slots and casts. - Kfunc signature matching (Day 20).
Source: kernel/bpf/btf.c.
vmlinux.h
A C header generated from kernel BTF, containing the kernel types a BPF program can name. You can generate one from a running host with bpftool btf dump file /sys/kernel/btf/vmlinux format c.
The repo-owned labs compile against the architecture header pinned with libbpf-bootstrap, not a file regenerated on every reader’s machine. That gives CI and local builds one stable type universe; at load time CO-RE still resolves the accessed fields against the running kernel’s /sys/kernel/btf/vmlinux. If you are developing outside this scaffold, generating vmlinux.h from a known reference kernel is the equivalent workflow.
CO-RE — Compile Once, Run Everywhere
The whole reason BPF programs aren’t fragile across kernel versions. You compile once against vmlinux.h from one kernel; libbpf relocates field offsets at load time using the target kernel’s BTF. The same .bpf.o runs on kernel 6.6 and kernel 7.1 even if struct layouts changed.
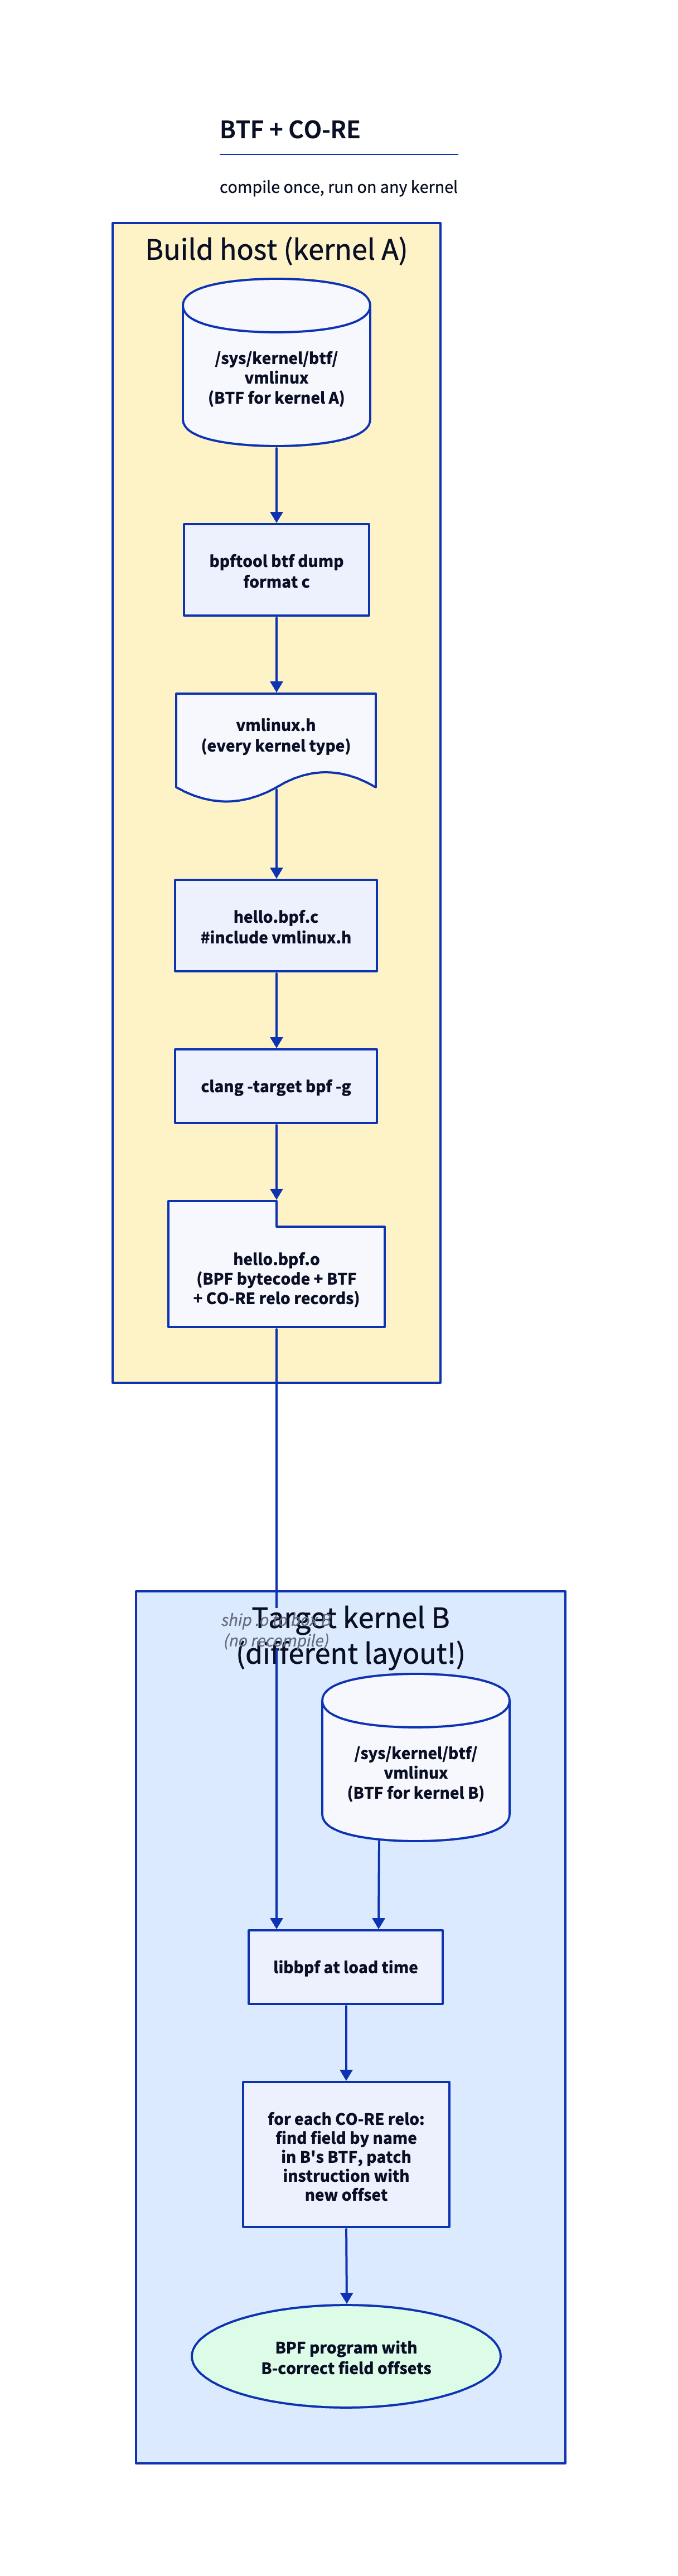
libbpf
The userspace library at tools/lib/bpf/. Opens your .bpf.o, applies CO-RE relocations using the running kernel’s BTF (bpf_object__relocate_core at tools/lib/bpf/libbpf.c:6082), calls the bpf() syscall to load programs and create maps — issuing BPF_MAP_CREATE then BPF_PROG_LOAD then the attach commands, in that order — attaches them, and returns handles. It is the canonical loader. Do not write your own.
Skeleton (*.skel.h)
An auto-generated header produced by bpftool gen skeleton hello.bpf.o > hello.skel.h. It gives userspace typed accessors for every map and program in your BPF object: skel->maps.rb, skel->progs.on_unlink. Under the hood each of those is a wrapper around the fd that bpf() returned. The generated file is ~200 lines of straightforward code — open it once, it stops feeling magic.
ringbuf — the event channel you’ll use today
A kernel→userspace event channel, and one map type among many. Multi-producer (any CPU), single-consumer (one userspace reader), preserves cross-CPU ordering. Producers don’t run fully lock-free: inside __bpf_ringbuf_reserve they serialize briefly via an internal per-ringbuf spinlock (raw_res_spin_lock_irqsave on rb->spinlock, kernel/bpf/ringbuf.c:478) while advancing the producer position, then each caller writes into its own disjoint slice.
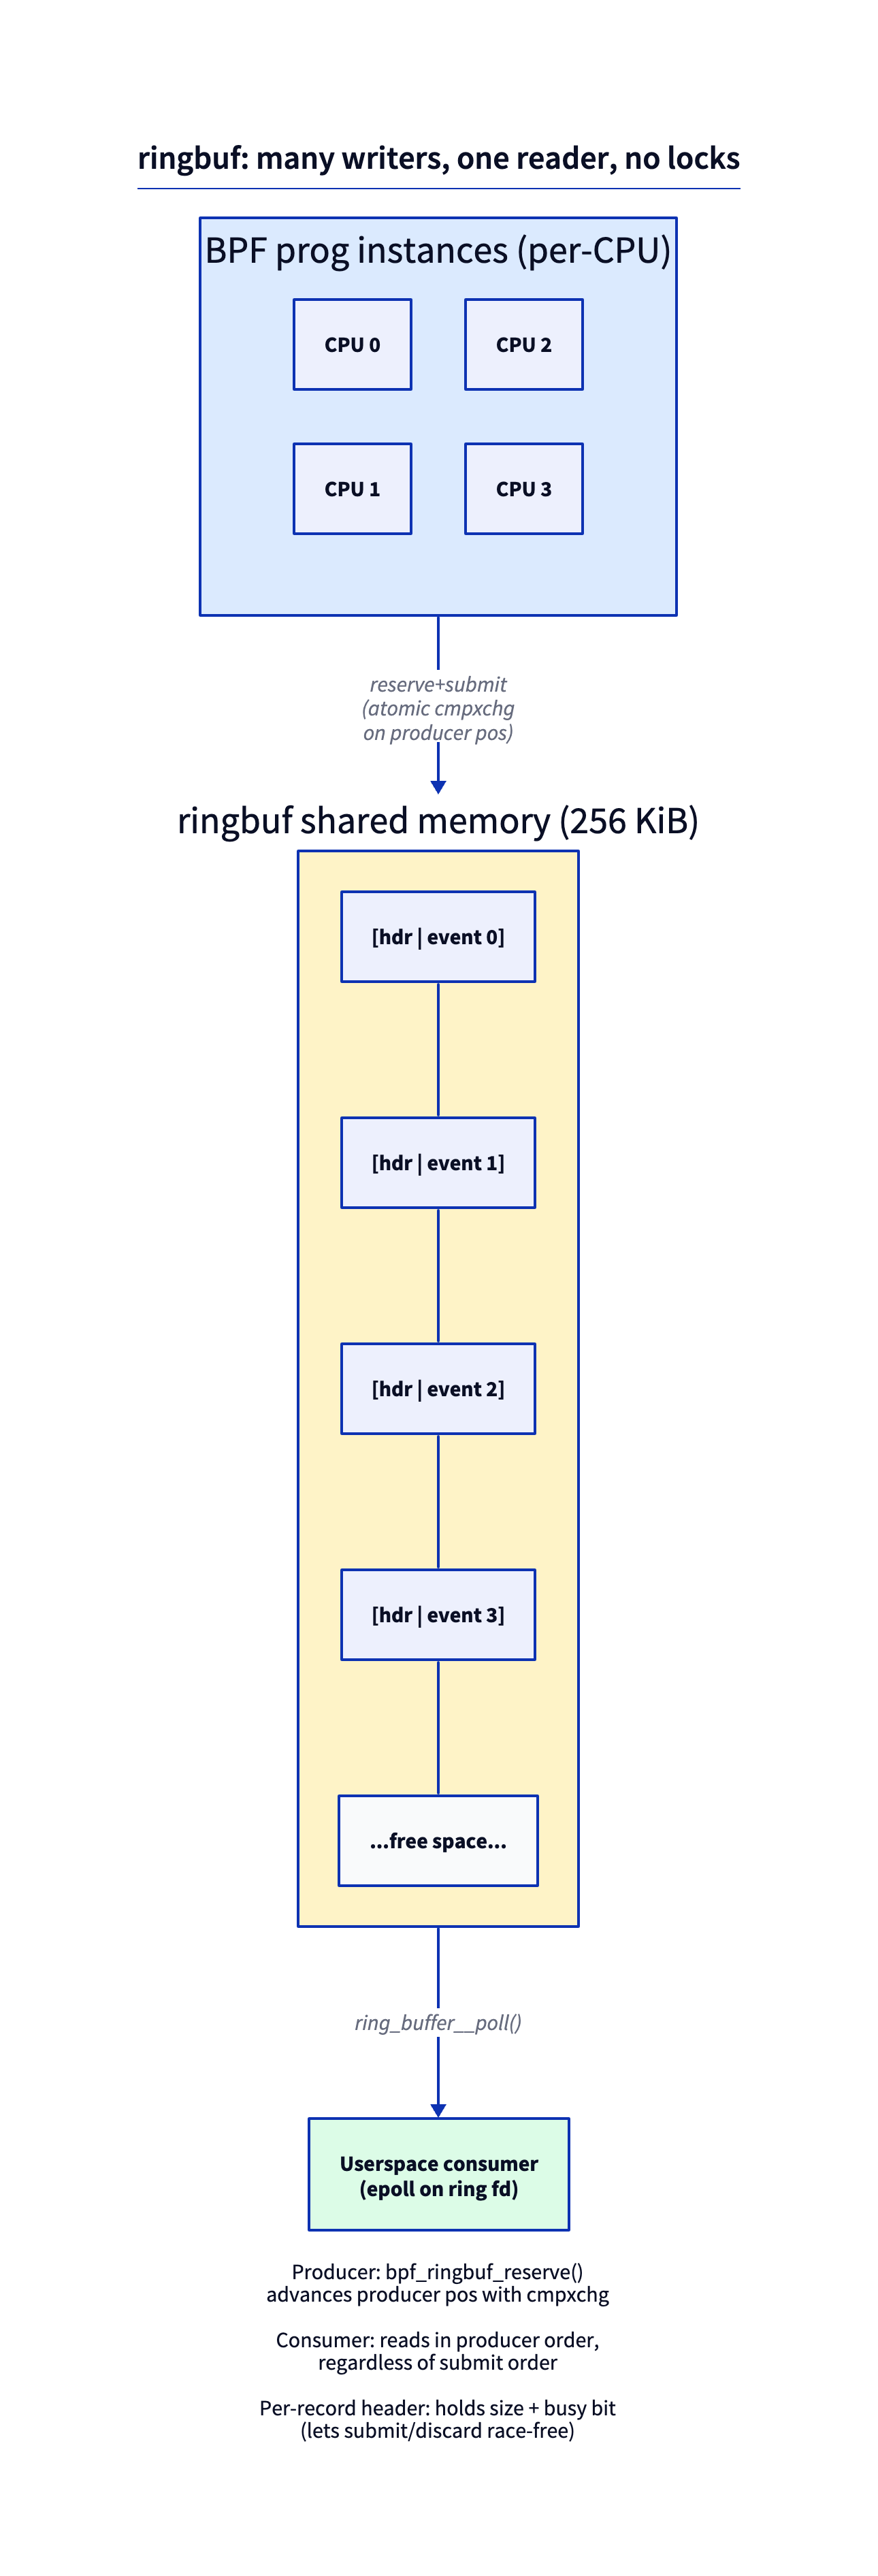
Two APIs:
bpf_ringbuf_output(&rb, data, sz, 0)— copy-style. Easy.bpf_ringbuf_reserve(&rb, sz, 0)→ write directly →bpf_ringbuf_submit(ev, 0)— zero-copy. Preferred.
Replaced perfbuf (BPF_MAP_TYPE_PERF_EVENT_ARRAY) for most uses. Perfbuf is per-CPU, requires N userspace consumers, loses ordering across CPUs. Use perfbuf only if peak per-CPU write rate matters more than ordering. Source: kernel/bpf/ringbuf.c.
The lab
Setup (one time)
Start with the Lab environment page, then run these commands from the books repository on your Linux lab host:
git submodule update --init --recursive
cd ebpf/labs
./scripts/preflight.sh
make hello
The repository pins libbpf-bootstrap and all of its nested dependencies. The shared Makefile builds that exact libbpf and bpftool, selects the pinned vmlinux.h for your architecture, compiles day01/hello.bpf.c, generates .output/day01/hello.skel.h, and links .output/day01/hello. Nothing is installed system-wide.
You still need Clang 17 or newer with -target bpf, a C compiler and Make, plus libelf and zlib development headers. preflight.sh checks those inputs but never installs packages or invokes sudo.
hello.h — the shared event record
The producer and consumer include one header, so a layout change cannot silently desynchronize the two sides:
#ifndef PRACTICAL_EBPF_HELLO_H
#define PRACTICAL_EBPF_HELLO_H

struct hello_event {
    unsigned int pid;
    char comm[16];
};

#endif
hello.bpf.c — the kernel side
This listing is included from the file the lab build and CI compile:
#include "vmlinux.h"
#include <bpf/bpf_helpers.h>
#include <bpf/bpf_tracing.h>

#include "hello.h"

char LICENSE[] SEC("license") = "GPL";

struct {
    __uint(type, BPF_MAP_TYPE_RINGBUF);
    __uint(max_entries, 256 * 1024);
} rb SEC(".maps");

SEC("fentry/filename_unlinkat")
int BPF_PROG(on_unlink, int dfd, struct filename *name)
{
    struct hello_event *event;

    (void)dfd;
    (void)name;

    event = bpf_ringbuf_reserve(&rb, sizeof(*event), 0);
    if (!event)
        return 0;

    event->pid = bpf_get_current_pid_tgid() >> 32;
    bpf_get_current_comm(&event->comm, sizeof(event->comm));
    bpf_ringbuf_submit(event, 0);
    return 0;
}
Walkthrough of every line that’s new:
#include "vmlinux.h"— pulls in every kernel type, includingstruct filenameused in the prototype.char LICENSE[] SEC("license") = "GPL";— a load-time gate, not legal advice. The kernel rejects a non-GPL program only if it calls a GPL-only helper. Many of the most useful helpers are GPL-only (bpf_probe_read_kernel,bpf_get_current_task,bpf_get_stackid, …), but the four simple helpers this lab uses are not — so this line has no teeth yet today (see Break 3).#include "hello.h"— the sharedstruct hello_eventsent through ringbuf. Ringbuf transports raw bytes, so both sides must agree on this layout.- The
SEC(".maps")block — modern map declaration syntax. The__uint(...)macros frombpf_helpers.hproduce BTF the loader uses to know it’s a 256-KiB ringbuf. (This is the BTF that drives theBPF_MAP_CREATEcommand libbpf issues forrb.) SEC("fentry/filename_unlinkat")— attach point.filename_unlinkatis infs/namei.c, called on everyunlink()andunlinkat()syscall.BPF_PROG(on_unlink, int dfd, struct filename *name)— macro frombpf_tracing.hthat unpacks the trampoline’s argument array into the typed parametersdfdandname(the ABI bridge from earlier, made concrete).bpf_ringbuf_reservereturns either a valid pointer or NULL (when the ringbuf is full). The return value lands inR0, the Verifier tags itmem_or_null, and it requires the null check before you write through it.bpf_get_current_pid_tgid()— reads the currently-running task (more on “the task” just below). The result is packed(tgid << 32) | pid; Linux’s userspace “PID” is the kernel’s TGID.>> 32extracts the user-visible PID.bpf_get_current_comm— copies up to 16 bytes of the task’scommfield. Always 16, always null-padded.bpf_ringbuf_submitmakes the reserved entry visible to the consumer.
A one-paragraph refresher: “the task” and where 16 comes from
Two of those helpers read “the current task,” and the magic number 16 shows up with no explanation — so, briefly: every schedulable thread in the kernel is represented by a struct task_struct. What BPF calls current is simply the task_struct of the thread running on this CPU right now, and bpf_get_current_pid_tgid / bpf_get_current_comm both read fields out of it. The comm field is a fixed-size, NUL-padded short thread name — the rm you’ll see in the lab output — declared as char comm[TASK_COMM_LEN] in struct task_struct (include/linux/sched.h:1173). And TASK_COMM_LEN is 16 (include/linux/sched.h:325). So the 16 in sizeof(event->comm) isn’t arbitrary; it’s the kernel’s compile-time size of that field. That’s the whole refresher — we’ll do a proper task_struct tour another day; today you just need “always 16” and “the task’s comm” to stop being unexplained constants. (The pid-vs-tgid split above already covered why we shift by 32.)
hello.c — the userspace side
The loader checks each libbpf step, validates the ringbuf record size, handles SIGINT/SIGTERM, and releases both the consumer and skeleton on every exit path:
#include <errno.h>
#include <signal.h>
#include <stdio.h>
#include <string.h>

#include <bpf/libbpf.h>

#include "hello.h"
#include "hello.skel.h"

static volatile sig_atomic_t exiting;

static void handle_signal(int signal_number)
{
    (void)signal_number;
    exiting = 1;
}

static int install_signal_handlers(void)
{
    const struct sigaction action = {
        .sa_handler = handle_signal,
    };

    if (sigaction(SIGINT, &action, NULL) != 0 ||
        sigaction(SIGTERM, &action, NULL) != 0) {
        fprintf(stderr, "failed to install signal handlers: %s\n",
                strerror(errno));
        return -errno;
    }

    return 0;
}

static int handle_event(void *ctx, void *data, size_t size)
{
    const struct hello_event *event = data;

    (void)ctx;
    if (size != sizeof(*event)) {
        fprintf(stderr, "unexpected ringbuf record size: %zu\n", size);
        return 0;
    }

    printf("PID %u %.*s deleted a file\n", event->pid,
           (int)sizeof(event->comm), event->comm);
    return 0;
}

int main(void)
{
    struct hello_bpf *skel = NULL;
    struct ring_buffer *ringbuf = NULL;
    int err;

    setvbuf(stdout, NULL, _IOLBF, 0);

    err = install_signal_handlers();
    if (err)
        return 1;

    skel = hello_bpf__open();
    if (!skel) {
        fprintf(stderr, "failed to open hello BPF skeleton\n");
        return 1;
    }

    err = hello_bpf__load(skel);
    if (err) {
        fprintf(stderr, "failed to load hello BPF programs: %s\n",
                strerror(-err));
        goto cleanup;
    }

    err = hello_bpf__attach(skel);
    if (err) {
        fprintf(stderr, "failed to attach hello BPF programs: %s\n",
                strerror(-err));
        goto cleanup;
    }

    ringbuf = ring_buffer__new(bpf_map__fd(skel->maps.rb), handle_event,
                               NULL, NULL);
    err = libbpf_get_error(ringbuf);
    if (err) {
        ringbuf = NULL;
        fprintf(stderr, "failed to create ringbuf consumer: %s\n",
                strerror(-err));
        goto cleanup;
    }

    puts("Tracing unlink calls; press Ctrl-C to stop.");
    while (!exiting) {
        err = ring_buffer__poll(ringbuf, 100);
        if (err == -EINTR) {
            err = 0;
            continue;
        }
        if (err < 0) {
            fprintf(stderr, "ringbuf poll failed: %s\n", strerror(-err));
            goto cleanup;
        }
    }

    err = 0;

cleanup:
    ring_buffer__free(ringbuf);
    hello_bpf__destroy(skel);
    return err != 0;
}
bpf_map__fd(skel->maps.rb) is exactly the map fd that BPF_MAP_CREATE returned during load — the userspace side polls it; the kernel side writes into it.
Run it
make hello
sudo ./.output/day01/hello
# in another terminal:
scratch=$(mktemp -d /tmp/ebpf-day01.XXXXXX)
touch "$scratch/one" "$scratch/two"
rm "$scratch/one" "$scratch/two"
rmdir "$scratch"
Expected output:
PID 13421 rm deleted a file
PID 13421 rm deleted a file
On a busy machine you’ll also see lines whose comm is something other than rm — package managers, editors saving over temp files, /tmp churn. That’s not a bug; it’s the whole point. Your doorbell fires on every unlink/unlinkat in the system, not just yours. Pick out the two lines whose comm is rm.
Congratulations. You just installed a doorbell on a kernel function.
What to break, in order
This is the part you don’t skip. Every break teaches one concept.
Break 1 — Drop the null check
Remove the if (!event) return 0;. Rebuild. The verifier rejects with something like:
0: (85) call bpf_ringbuf_reserve#131
1: R0=mem_or_null(id=2,sz=20)
2: (7b) *(u32 *)(r0 +0) = r1
R0 invalid mem access 'mem_or_null'
That’s the Verifier saying: your register R0 is a pointer that might be NULL; you can’t dereference it without proving it isn’t. You now know exactly why it’s R0 and not some other register — R0 is where a helper’s return value lives by calling convention, so bpf_ringbuf_reserve’s maybe-NULL pointer is sitting in R0 when instruction 2 tries to write through it.
To see this with full detail, set kernel_log_level = 1 in your loader options:
LIBBPF_OPTS(bpf_object_open_opts, opts, .kernel_log_level = 1);
skel = hello_bpf__open_opts(&opts);
Or use bpftool prog load file.o /sys/fs/bpf/x and read stderr.
Break 2 — Wrong map type
Change BPF_MAP_TYPE_RINGBUF to BPF_MAP_TYPE_ARRAY. Now the loader fails before the Verifier even runs:
libbpf: map 'rb': failed to create: Invalid argument
This is the BPF_MAP_CREATE-vs-BPF_PROG_LOAD split from the syscall section, made visible. An ARRAY map needs a key size and value size that a bare SEC(".maps") ringbuf-style declaration doesn’t supply, so the kernel rejects it during BPF_MAP_CREATE — the very first command libbpf issues. BPF_PROG_LOAD, where the Verifier lives, never runs. That’s the difference between loader-time errors (map config wrong) and verifier-time errors (program logic unsafe). Different layers, different commands, different failure modes. Get used to noticing which one bit you.
Break 3 — Remove the LICENSE
Try the obvious thing first: delete the char LICENSE[] SEC("license") = "GPL"; line and rebuild. The program loads and runs exactly as before. Surprised? The GPL gate fires only when your program calls a GPL-only helper, and none of the four helpers in hello.bpf.c (bpf_ringbuf_reserve, bpf_ringbuf_submit, bpf_get_current_pid_tgid, bpf_get_current_comm) are GPL-only.
To make the gate bite, first give it something to gate on. Add a GPL-only helper call inside on_unlink:
(void)bpf_get_current_task(); // bpf_get_current_task is a GPL-only helper
Now delete the LICENSE line again and rebuild. This time the load fails:
cannot call GPL-restricted function from non-GPL compatible program
The lesson: the license string is a load-time gate with teeth only for GPL-only helpers. Put the LICENSE line back (and you can drop the bpf_get_current_task call again) before moving on.
Break 4 — Reserve more than you write
Sharpen your pencil
Before you run anything: what is
sizeof(struct hello_event)? The struct is a 4-byte__u32 pidfollowed by a 16-bytechar comm[16]. Add them up — you’ll see this number printed assize=in a moment.. . .
Answer: 20. There’s no padding to worry about here — a
__u32needs 4-byte alignment andchar[16]needs only 1, so the 4 + 16 layout packs with no gaps. Hold “20” in mind; the20 → 21shift is the whole point of this break.
The lesson here is that ringbuf records are sized at reserve time, not at submit time. The checked-in handle_event() deliberately rejects any size other than sizeof(*event), so replace that equality check with a lower-bound check and print the delivered size:
if (size < sizeof(*event)) {
    fprintf(stderr, "short ringbuf record: %zu\n", size);
    return 0;
}
printf("PID %u %.*s deleted a file (size=%zu)\n", event->pid,
       (int)sizeof(event->comm), event->comm, size);
Rebuild and run the unmodified program. Each line now ends with the record size:
PID 13421 rm deleted a file (size=20)
sizeof(struct hello_event) is 20 — a 4-byte pid plus a 16-byte comm. Now over-allocate the reservation while still writing only sizeof(*event) bytes:
event = bpf_ringbuf_reserve(&rb, sizeof(*event) + 1, 0);
The Verifier accepts it (you reserved enough). Rebuild, run, delete a file again:
PID 13421 rm deleted a file (size=21)
The record is one byte larger even though you wrote the same bytes — the length is fixed when you reserve, not when you submit. (That trailing byte is uninitialized; we don’t print it, the 20 → 21 size delta is the observable signal.) Restore the original sizeof(*event) reservation and exact-size consumer check before moving on.
What to read in the kernel
Open these files in your ~/code/linux checkout. Skim, don’t memorize.
kernel/bpf/trampoline.c— top of the file. Findarch_prepare_bpf_trampolineandbpf_trampoline_get. The trampoline is per-(target, prog-list), reference-counted, and rebuilt when programs attach or detach (bpf_trampoline_update,kernel/bpf/trampoline.c:607). Noticebpf_trampolineis not just one stub — it’s a hash table keyed by attach target. (The arg-spill/restore code itself is emitted byarch_prepare_bpf_trampolineatarch/x86/net/bpf_jit_comp.c:3536, with the real work in__arch_prepare_bpf_trampolineat:3213— this is the ABI bridge from the trampoline section, in the flesh.) The patch that repoints the site is installed by the int3-based text-poke machinery,smp_text_poke_*(smp_text_poke_int3_handleratarch/x86/kernel/alternative.c:2838, driving the batchedstruct smp_text_poke_locarray at:2781) — safe against concurrent instruction fetch on every CPU.kernel/bpf/ringbuf.c—bpf_ringbuf_reserveis short. Note the per-record header (struct bpf_ringbuf_hdr,:88) and theBUSYbit (BPF_RINGBUF_BUSY_BIT, set at:529) that letssubmitanddiscardfinalize race-free.tools/lib/bpf/libbpf.c— searchfind_sec_def(:10212). Scroll thesection_defs[]table (:9987). You now know every prefix that exists. This file is also where CO-RE relocation gets kicked off (bpf_object__relocate_core,:6082).
Optional: read the generated skeleton
./.output/bpftool/bootstrap/bpftool gen skeleton .output/day01/hello.bpf.o
It prints the same skeleton stored at .output/day01/hello.skel.h. Read it once. You’ll see it’s just stamped-out boilerplate calling bpf_object__find_map_by_name and friends. Demystified.
Bullet Points
- BPF is a 64-bit virtual ISA: 11 registers
R0–R10, fixed 8-bytestruct bpf_insn.R0= return/helper-return value,R1–R5= args,R6–R9= callee-saved,R10= read-only frame pointer to a 512-byte stack. The Verifier tracks a type per register — that’s whereR0=mem_or_nullcomes from. bpf()is one syscall, multiplexed by a command enum:BPF_MAP_CREATE(→ map fd),BPF_PROG_LOAD(runs the Verifier → prog fd), attach commands. Maps, progs, and links are all fds. libbpf issues them in sequence — which is why a bad map fails before the Verifier (Break 2).- After the Verifier accepts bytecode, the JIT translates it to native machine code once at load time; the attach point then runs native code at native speed.
- BPF programs are C compiled to a verified-then-JITed instruction set; they cannot crash the kernel.
- fentry patches the 5-byte NOP slot — reserved by the compiler’s
-mfentryinstrumentation and owned by ftrace, borrowed by BPF via an ftrace “direct call” — with a jump to a generated trampoline. The trampoline bridges the ABI: it spills native arg registers (rdi,rsi, …) into au64 ctx[]array, calls your program withR1 → ctx, andBPF_PROGcasts the slots back to typed args. Typically several times cheaper than a kprobe trap. - The patch is installed by the kernel’s int3-based text-poke machinery,
smp_text_poke_*, safe against concurrent instruction fetch on every CPU. - Use fentry wherever possible. Use kprobe only for functions without BTF.
SEC()is the section-name convention libbpf uses to load and attach. The prefix names the program type and tells libbpf where to attach.- vmlinux.h is generated from kernel BTF and gives you every kernel type by name; BTF also tells fentry the argument types so the trampoline and
BPF_PROGagree on the slots. - CO-RE lets you compile once and run on any kernel; libbpf relocates field offsets at load time.
- ringbuf is one map type — multi-producer single-consumer with cross-CPU ordering — your default kernel→userspace channel.
currentis the running thread’sstruct task_struct;commis its 16-byte (TASK_COMM_LEN) NUL-padded name — that’s where “always 16” comes from.- Two failure layers exist: loader-time (map/object misconfigured) and verifier-time (program logic unsafe).
- Always check the return of
bpf_ringbuf_reserveandbpf_map_lookup_elem— both can return NULL (inR0) and the Verifier knows it.
Check question
If two CPUs concurrently call bpf_ringbuf_reserve(&rb, 64, 0), can the records overlap?
Click to reveal answer
Answer: No. Inside __bpf_ringbuf_reserve the producers serialize briefly via an internal per-ringbuf spinlock while advancing the producer position, so each caller gets a disjoint slice. Submit/discard order may differ from reserve order, which the consumer handles via the BUSY bit on each record header. The consumer does not see a record until BUSY is cleared by submit/discard.
Tomorrow
Day 2: add a hash map. Per-PID counters. The first lesson on map element lifecycle (and how a tracer that doesn’t clean up its maps becomes a slow ENOSPC poison-pill).
Day 2 — Hash maps and per-PID counters
Today’s mission: count
unlink()calls per PID, dump the running totals on demand. Learn what a hash map is — the bucket array, the lockless lookup, the per-CPU variant — what the Verifier knows about lookups, how userspace reaches into kernel map memory through a file descriptor, and why your tracer must clean up after itself or it dies. Total time: ~110 minutes.
The shared notebook
Yesterday you sent events to userspace one at a time. That works for streaming, but doesn’t help when you want a summary — “how many times did each PID call unlink?”
You want a shared notebook between kernel and userspace. The BPF program writes counts. Userspace reads them when it wants. The notebook lives in kernel memory, persists across program invocations, and survives until you tear it down.
That’s a map. Today’s flavor: BPF_MAP_TYPE_HASH.
But “shared notebook” hides three things that will bite you if you don’t understand them, and the rest of today is about making them obvious:
- How userspace even touches a kernel map. The BPF side and the userspace side talk to the same map through two completely different doors — and, confusingly, through two functions with the same name.
- Why the kernel can hand your BPF program a raw pointer into map memory and trust you to dereference it without ever taking a lock. (Spoiler: RCU.)
- Why a per-CPU map dodges races entirely — which means knowing what “per-CPU memory” actually is.
We’ll teach each as we hit the part of the lab that depends on it.
Meet the cast
BPF_MAP_TYPE_HASH — the bread-and-butter map
A kernel-resident hash table. Fixed-capacity (max_entries), key/value sizes declared at creation, accessible from both BPF and userspace. Internally it’s a power-of-two-sized array of buckets, each holding a chained list of {key, value} pairs. Lookup hashes the key, masks it down to a bucket index, and walks the chain.
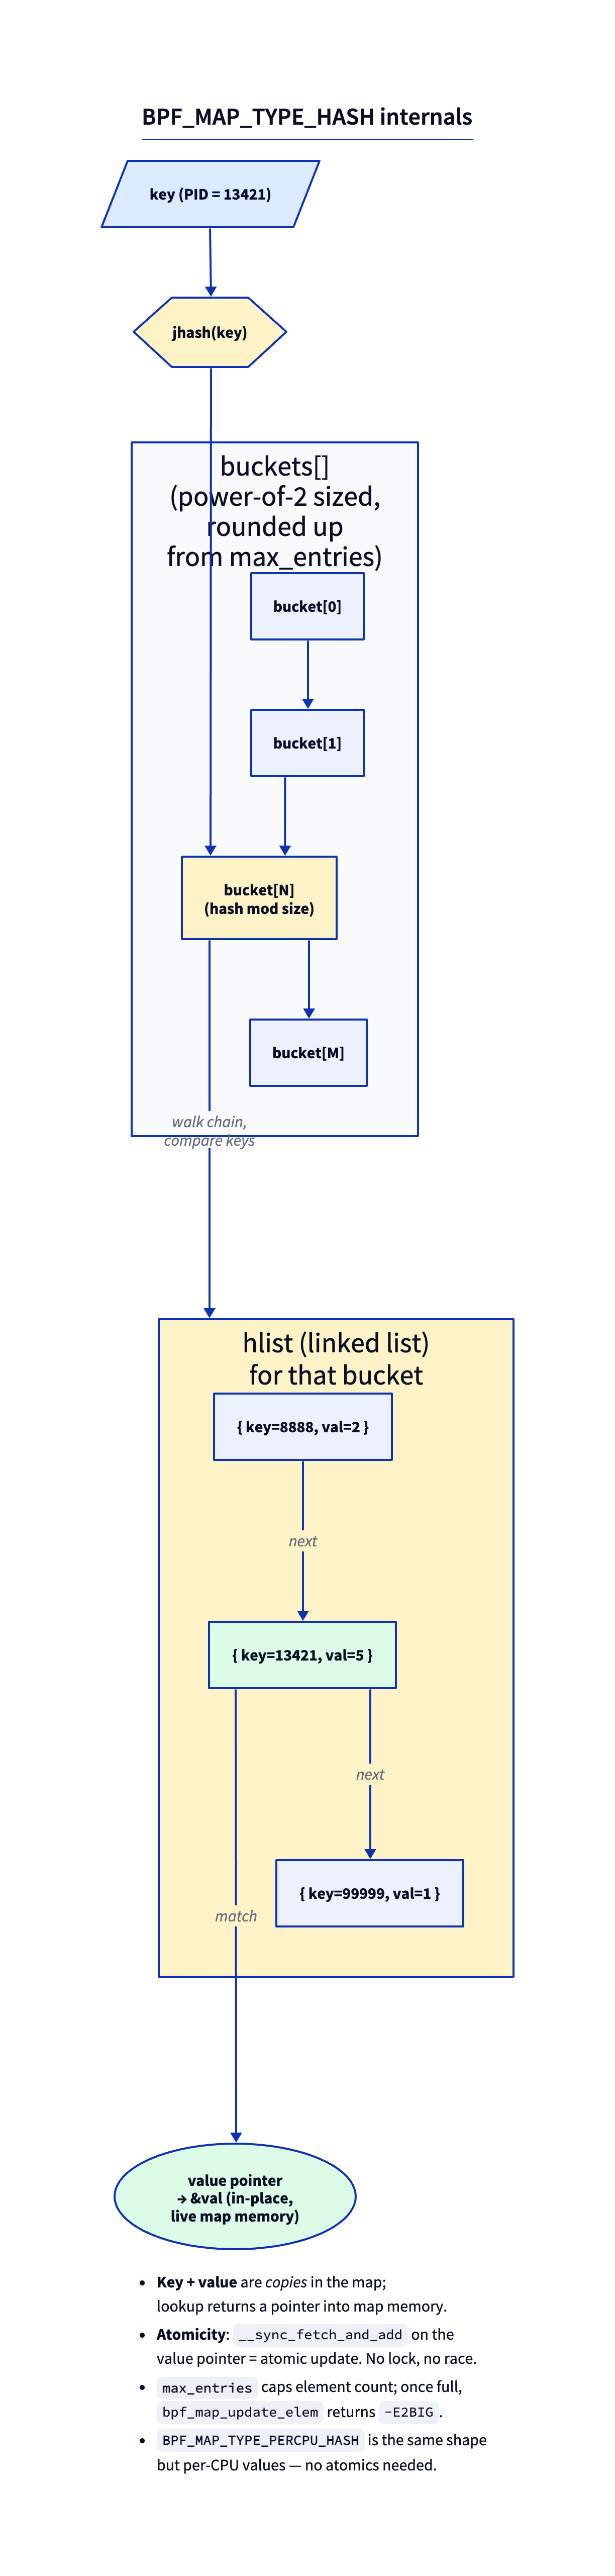
You can see every one of those words in the source. In kernel/bpf/hashtab.c:
/* kernel/bpf/hashtab.c:80 */
struct bucket {
    struct hlist_nulls_head head;   /* the chain of elements */
    rqspinlock_t            raw_lock;
};
The bucket index is just the hash masked to the array size — and because the array is a power of two, that mask is a single &:
/* kernel/bpf/hashtab.c:686 — select_bucket() */
return &__select_bucket(htab, hash)->head;   /* index = hash & (n_buckets - 1) */
The bits worth remembering today:
- Lookup returns a pointer into map memory — not a copy. You can read it. You can atomically update it. What you cannot do is assume it’s non-NULL. And while the element won’t be freed under you (RCU guarantees that — see below), its contents can change concurrently, so bumping a counter needs an atomic.
max_entriesis a hard cap. Once full, inserts fail with-E2BIG(is_map_full→ERR_PTR(-E2BIG)athashtab.c:1108). There is no automatic eviction. (LRU and LRU-percpu variants exist if you want eviction; see Day 11.)- No locks for you. The kernel handles bucket-level synchronization internally — we’ll see exactly how in a moment, because it’s the reason the returned pointer is safe to dereference. For atomic value updates, you use
__sync_fetch_and_addand friends on the value pointer. - Per-CPU variant (
BPF_MAP_TYPE_PERCPU_HASH): same shape, but each CPU has its own value slot. No atomics needed; userspace must sum across CPUs to get a total. Use it when contention matters (high-rate counters, e.g. XDP).
Source: kernel/bpf/hashtab.c. The lookup is htab_map_lookup_elem (:752); the update is htab_map_update_elem (:1171). Look at the file once. It’s not magic — and by the end of today you’ll have read the parts that matter.
Two doors into one map: the map fd, and the two functions both called bpf_map_lookup_elem
Here is a thing the tutorials never tell you, and it will confuse you the first time you put the BPF side and the userspace side on one screen: bpf_map_lookup_elem is the name of two completely different functions with opposite contracts. You will write both today, in two different files. Let’s separate them now so you never trip on it.
First: what is a map, from each side? A loaded map is a single in-kernel object — that bucket array we just looked at. Neither the BPF program nor your userspace dumper holds a pointer to it directly. They reach it two different ways:
- The BPF program refers to the map by address of its declaration (
&counts). At load time the kernel rewrites that into a direct reference to the kernel object. The program runs inside the kernel, so when it asks for an element it gets a bare pointer straight into live map memory. - Userspace cannot hold a kernel pointer. It refers to the map through an integer file descriptor — the same kind of small int as an open file.
bpf_map__fd(skel->maps.counts)pulls that fd out of the skeleton. (You used the exact samebpf_map__fdfor the ringbuf yesterday and I never told you what the int was — now you know: it’s a handle to a kernel object, nothing more.)
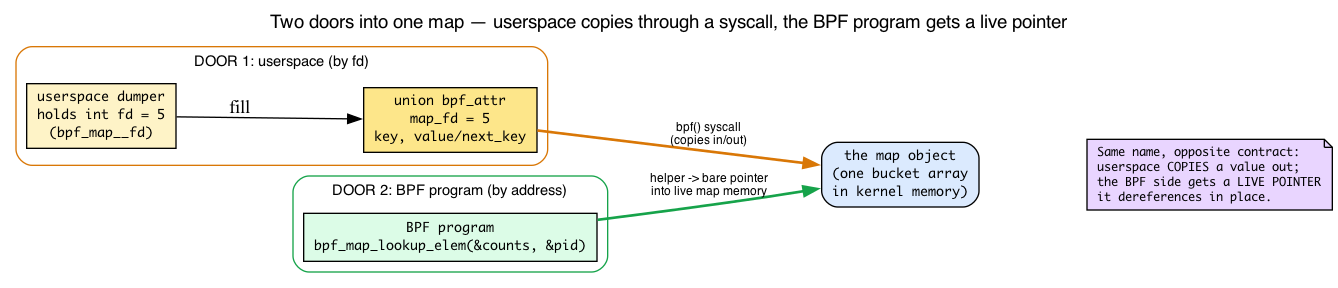
Now the two functions. They have the same name and do almost-opposite things:
BPF-side bpf_map_lookup_elem(&counts, &pid) | Userspace bpf_map_lookup_elem(fd, &key, &val) | |
|---|---|---|
| What it is | a BPF helper, runs inside the kernel | a libbpf wrapper around the bpf() syscall |
| Takes the map by | address (&counts) | file descriptor (an int) |
| What you get back | a live pointer into map memory (PTR_TO_MAP_VALUE) | nothing — it copies the value out into your buffer |
| You read the result via | dereferencing the returned pointer | reading the &val you passed in |
The userspace side is a thin wrapper. Open tools/lib/bpf/bpf.c and you’ll find it does nothing but fill a struct and issue a syscall:
/* tools/lib/bpf/bpf.c:407 */
int bpf_map_lookup_elem(int fd, const void *key, void *value)
{
    union bpf_attr attr;
    memset(&attr, 0, attr_sz);
    attr.map_fd = fd;
    attr.key    = ptr_to_u64(key);
    attr.value  = ptr_to_u64(value);          /* a buffer to copy INTO */
    ret = sys_bpf(BPF_MAP_LOOKUP_ELEM, &attr, attr_sz);
    return libbpf_err_errno(ret);
}
Every userspace map call follows this exact pattern — fill a union bpf_attr, call sys_bpf(...):
bpf_map_update_elem(fd, …)→sys_bpf(BPF_MAP_UPDATE_ELEM, …)(bpf.c:390)bpf_map_delete_elem(fd, …)→sys_bpf(BPF_MAP_DELETE_ELEM, …)(bpf.c:469)bpf_map_get_next_key(fd, …)→sys_bpf(BPF_MAP_GET_NEXT_KEY, …)(bpf.c:498, syscall issued at:509)
That last one, bpf_map_get_next_key, is how userspace iterates a map: call it with one key, it hands you the next. There’s no single syscall behind bpf_map_get_next_key that walks the whole map for you — it hands back one key per call, so the get_next_key loop lives in userspace. (A separate batch API, BPF_MAP_LOOKUP_BATCH, can pull many entries per syscall — that’s what bpftool map dump uses — but it’s not what get_next_key does.) This is why the dump loop in count.c below is an ordinary userspace while loop, not BPF code.
So when you see bpf_map_lookup_elem on the BPF side returning a pointer you dereference, and bpf_map_lookup_elem on the userspace side copying into a buffer you read — same name, opposite contract. Keep them straight and the rest of today is easy.
Why the kernel trusts you with a raw pointer: RCU lookups and a per-bucket lock
Back to a claim I made above and then walked past: lookup returns a pointer into live map memory, no lock required, and you may dereference it. Stop and feel how scary that should be. Another CPU could be inserting or deleting in that same bucket at the same instant. How is it safe for your program to walk the chain and dereference an element with no lock at all?
The answer is two different synchronization mechanisms for two different jobs — and knowing which is which explains every “do I need an atomic here?” question you’ll ever ask about hash maps.
Job 1 — reads (lookup): RCU, no lock. RCU (Read-Copy-Update) is a kernel synchronization scheme where readers never take a lock and never block, and freeing is deferred until every in-flight reader has finished — those two guarantees are all we need here. Each bucket’s chain isn’t a plain linked list; it’s an RCU-protected hlist_nulls (struct hlist_nulls_head head; in that struct bucket). Two properties make a lockless walk safe:
-
Readers run in an RCU read-side critical section and take no lock. That is literally why the helper can hand your program a raw pointer — there’s no lock to hold or drop. The source even labels the two walkers by whether they need the lock:
/* hashtab.c:691 — needs the bucket lock */ /* this lookup function can only be called with bucket lock taken */ static struct htab_elem *lookup_elem_raw(...) /* hashtab.c:705 — the RCU read-side walk, used by the lookup helper */ /* can be called without bucket lock. it will repeat the loop in * the unlikely event when elements moved from one bucket into another * while link list is being walked */ static struct htab_elem *lookup_nulls_elem_raw(...) -
Elements are RCU-freed. When a writer removes an element, the memory isn’t reclaimed until all in-flight readers have finished. So the element your program is looking at cannot be deallocated out from under you while your program runs. Your null-check-then-dereference is racing only against the contents of the value (which is why you still need an atomic to bump a counter), never against use-after-free. That
_nullsflavor of the list exists precisely so a lockless reader can detect “this element hopped to another bucket mid-walk” and restart the loop (thegoto againinlookup_nulls_elem_raw).
Job 2 — writes (insert / replace / delete): the per-bucket spinlock. That second field in the bucket, rqspinlock_t raw_lock, is taken only by writers. htab_map_update_elem grabs it before touching the chain:
/* hashtab.c:1217, inside htab_map_update_elem */
ret = htab_lock_bucket(b, &flags);
This is the “bucket-level synchronization” I mentioned, and the “bucket lock” the Check question at the bottom names. Three things to notice:
- It’s one lock per bucket, so two writes to different keys that land in different buckets never contend. Contention is only between keys that collide into the same bucket.
- It serializes writers against each other and against
sys_bpf()calls from userspace — the file’s big block comment abovestruct bucket(hashtab.c:35) spells out both scopes (“Serializing concurrent operations from BPF programs on different CPUs” and “between BPF programs and sys_bpf()”). - It’s a raw, resilient queued spinlock (
rqspinlock_t) on purpose: BPF programs run in atomic contexts (perf, kprobes, tracing), where you cannot take a sleeping lock. A raw spinlock is safe to grab from there. The comment block walks through exactly why that choice is forced.
The punchline you’ll use constantly: lookup gives you an unlocked live pointer; the bucket lock protects insert/delete, not your writes to the value. So two CPUs that both looked up the same slot and both want to += 1 are not protected by anything — which is exactly why the counter increment must be an atomic __sync_fetch_and_add. Different paths, different synchronization.

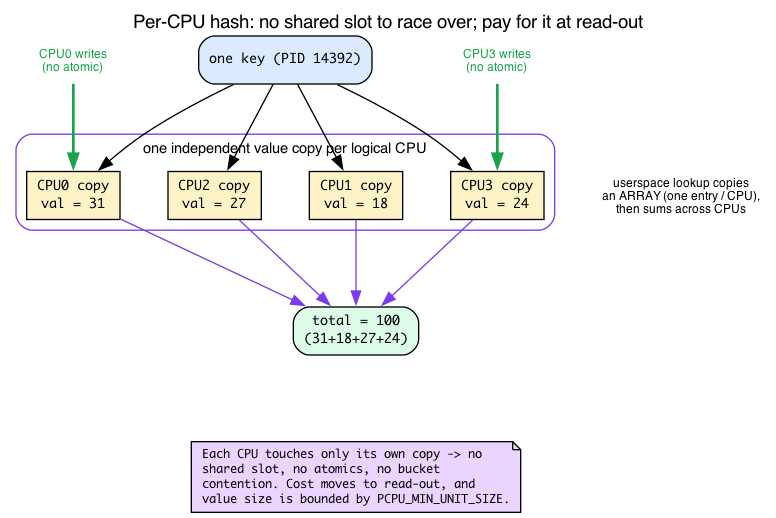
BPF_MAP_TYPE_PERCPU_HASH — and what “per-CPU” actually means
The check-question answer at the bottom recommends a per-CPU hash to dodge the increment race entirely. To understand why it dodges the race, you need to know what “per-CPU memory” means — nothing earlier in this book has taught it, so here it is.
The intuition. A per-CPU value is not one slot shared by everyone. The kernel allocates one independent copy of the value for every logical CPU. When a BPF program reads or writes that value, it transparently touches only the copy belonging to the CPU it is currently running on. Two CPUs working on “the same key” are physically touching different memory. There is no sharing to race over.
That single fact has three consequences:
-
No atomics, no bucket contention on the value. Each CPU bumps its private copy with an ordinary load/store. You’ve traded kernel-side contention for userspace work.
-
Read-out costs more. When userspace calls
bpf_map_lookup_elem(fd, &key, …)on a per-CPU map, the value it copies out is an array — one entry per CPU. To get the logical total you must sum across all CPUs. The single-__u64dumper incount.cbelow would have to change to read an array and add it up. -
Values are size-bounded. A per-CPU value is allocated from a special per-CPU allocator (the
pcpu_mainstruct bpf_htab), and the rounded-up value size must fitPCPU_MIN_UNIT_SIZE:/* hashtab.c:458, in htab_map_alloc_check */ /* percpu map value size is bound by PCPU_MIN_UNIT_SIZE */ if (percpu && round_up(attr->value_size, 8) > PCPU_MIN_UNIT_SIZE) return -E2BIG;A regular hash value isn’t bounded this way — so if your values get large, per-CPU has a real ceiling.
When to use which. Reach for BPF_MAP_TYPE_PERCPU_HASH (include/uapi/linux/bpf.h:1005) when the hot path is contended — high-rate counters, XDP per-packet stats. Reach for a plain BPF_MAP_TYPE_HASH (:1001) plus __sync_fetch_and_add when contention is low and you want one authoritative slot you can read without summing. (BPF_MAP_TYPE_LRU_HASH at :1009 is a third option when you also want eviction; Day 11.)
PTR_TO_MAP_VALUE_OR_NULL — your first taste of the Verifier’s type system
When you call bpf_map_lookup_elem, the Verifier marks the returned register with type PTR_TO_MAP_VALUE_OR_NULL. That type means: might be a valid pointer to a map value, might be NULL — I don’t know yet.
You cannot dereference a pointer of that type. Until you prove it’s non-NULL, the Verifier rejects every load through it.
How do you prove it? With a null check:
__u64 *cnt = bpf_map_lookup_elem(&counts, &pid);
if (!cnt)
    return 0;
*cnt += 1;   // ← now legal: cnt is PTR_TO_MAP_VALUE
Inside the if (!cnt) branch, the Verifier knows cnt == NULL and pushes that branch into “this code is unreachable past this return.” Outside the branch, it knows cnt != NULL — it transitions the register’s type from PTR_TO_MAP_VALUE_OR_NULL to PTR_TO_MAP_VALUE. The deref becomes legal.
You’ll deepen this on Day 4. For today: always check the lookup result against NULL. (And note the connection back to RCU: the reason a non-NULL PTR_TO_MAP_VALUE is safe to dereference at all is that the element is RCU-freed — the Verifier guarantees you checked for NULL; RCU guarantees the memory won’t vanish mid-program.)
There are no Dumb Questions
Q: Why does the kernel make me check for NULL? Why not just return a sentinel value or pre-allocate?
A: Pre-allocation would mean the map guarantees every key has a value, which is exactly what
BPF_MAP_TYPE_ARRAYdoes (with integer keys). For hash maps, the answer “this key isn’t in the map” is meaningful — you need to know whether to insert or update. Sentinels would require the kernel to runtime-check every dereference. The Verifier’s static check pushes that cost to compile time, where it costs nothing at runtime.Q: I’m tempted to use a global variable instead of a map. Why not?
A: Global variables in BPF programs do exist (.bss/.data sections backed by
BPF_MAP_TYPE_ARRAYof size 1 under the hood — see Day 7). They’re great for config and singletons. But for per-key state (counts per PID, latencies per syscall, denylist of IPs), you need a hash. Globals can’t be looked up by key.Q: How does the kernel pick a hash function?
A:
htab_map_hash(kernel/bpf/hashtab.c:674) computes the hash — it callsjhash2when the key size is a multiple of 4 bytes (key_len % 4 == 0) andjhashotherwise (both are Jenkins-hash variants). The bucket index is thenhash & (n_buckets - 1), done in__select_bucket. The hash is fixed; you don’t get to choose. For very large keys this matters; for the 4-byte PIDs we’re using today it doesn’t.
BPF_ANY / BPF_NOEXIST / BPF_EXIST — update flags
bpf_map_update_elem takes a flag:
BPF_ANY— insert if absent, update if present.BPF_NOEXIST— insert if absent, fail with -EEXIST if present.BPF_EXIST— update if present, fail with -ENOENT if absent.
Use BPF_NOEXIST defensively when you want to be sure you’re not stomping someone else’s entry. Use BPF_ANY when you don’t care. The semantics live in check_flags (hashtab.c:1156), which returns -EEXIST for the BPF_NOEXIST-but-present case and -ENOENT for the BPF_EXIST-but-absent case — and the flag values themselves are in include/uapi/linux/bpf.h:1392 (BPF_ANY=0, BPF_NOEXIST=1, BPF_EXIST=2).
__sync_fetch_and_add — atomics in BPF
BPF programs don’t have access to most C library facilities, but they do have GCC-style sync builtins. __sync_fetch_and_add(p, n) atomically adds n to *p and returns the old value. Compiles to BPF_XADD (atomic add) or BPF_ATOMIC (general atomic) instructions — both are opcode 0xc0, with BPF_XADD being the legacy name (include/uapi/linux/bpf.h:23-24). The JIT lowers these to native LL/SC or lock xadd depending on architecture.
Why use it? Because (as the RCU section just showed) the lookup pointer is unlocked and concurrent CPUs can write the same slot — without an atomic you lose counts.
The lab
Continue from Day 1 in the repository’s ebpf/labs directory. The listings below are included from the source compiled by make count and CI.
count.bpf.c — swap yesterday’s ringbuf for a hash map
#include "vmlinux.h"
#include <bpf/bpf_helpers.h>
#include <bpf/bpf_tracing.h>

char LICENSE[] SEC("license") = "GPL";

struct {
    __uint(type, BPF_MAP_TYPE_HASH);
    __uint(max_entries, 8192);
    __type(key, __u32);
    __type(value, __u64);
} counts SEC(".maps");

SEC("fentry/filename_unlinkat")
int BPF_PROG(on_unlink)
{
    __u32 pid = bpf_get_current_pid_tgid() >> 32;
    __u64 *count;
    __u64 one = 1;

    count = bpf_map_lookup_elem(&counts, &pid);
    if (count) {
        __sync_fetch_and_add(count, 1);
        return 0;
    }

    if (bpf_map_update_elem(&counts, &pid, &one, BPF_NOEXIST) != 0) {
        /* Another CPU may have inserted the same PID after our lookup. */
        count = bpf_map_lookup_elem(&counts, &pid);
        if (count)
            __sync_fetch_and_add(count, 1);
    }

    return 0;
}
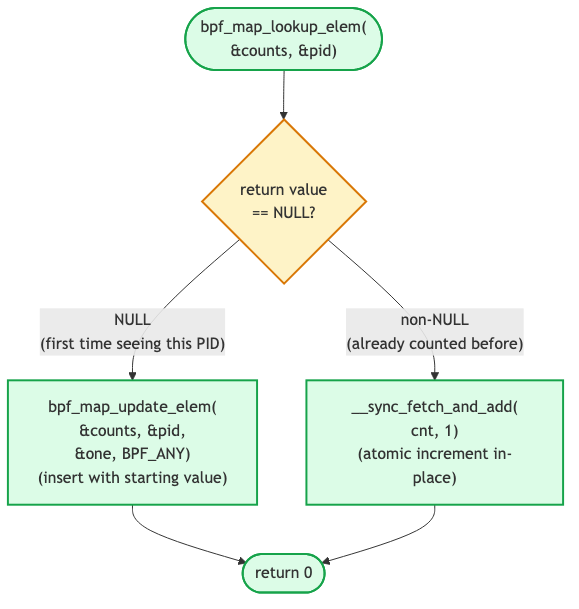
What’s new:
- The map is declared just like ringbuf: a struct in
SEC(".maps")whose macros set type/size/key/value through BTF. bpf_map_lookup_elem(&counts, &pid)— the BPF-side function from the table above. It takes the map by address and returns a live pointer. Note we pass the address ofpid, not the value. The kernel readskey_sizebytes starting from that address. If you accidentally passedpid(a value), you’d be telling the kernel to interpret an integer as a pointer. The Verifier catches this.- The insert uses
BPF_NOEXISTinstead ofBPF_ANY. If two CPUs both observe a miss, one inserts and the other gets-EEXIST; the losing path then looks up the new entry and atomically contributes its increment.BPF_ANYwould instead let the loser overwrite the winner’s count back to 1. A per-CPU hash is still the better high-contention design, but this retry closes the first-insert race without changing today’s map type.
count.c — userspace dumper
Same fentry hook as Day 1, but the output channel changes from a ringbuf to a map. The loader periodically iterates the map, starts with a NULL previous key, distinguishes normal ENOENT exhaustion from iteration errors, and destroys the skeleton on SIGINT/SIGTERM:
#include <errno.h>
#include <signal.h>
#include <stdio.h>
#include <string.h>
#include <unistd.h>

#include <bpf/bpf.h>
#include <bpf/libbpf.h>

#include "count.skel.h"

static volatile sig_atomic_t exiting;

static void handle_signal(int signal_number)
{
    (void)signal_number;
    exiting = 1;
}

static int install_signal_handlers(void)
{
    const struct sigaction action = {
        .sa_handler = handle_signal,
    };

    if (sigaction(SIGINT, &action, NULL) != 0 ||
        sigaction(SIGTERM, &action, NULL) != 0) {
        fprintf(stderr, "failed to install signal handlers: %s\n",
                strerror(errno));
        return -errno;
    }

    return 0;
}

static int dump_counts(int map_fd)
{
    const __u32 *previous = NULL;
    __u32 key;
    __u32 next;
    __u64 value;
    int ret;

    puts("--- snapshot ---");
    errno = 0;
    while ((ret = bpf_map_get_next_key(map_fd, previous, &next)) == 0) {
        if (bpf_map_lookup_elem(map_fd, &next, &value) == 0)
            printf("PID %u: %llu unlinks\n", next,
                   (unsigned long long)value);
        else if (errno != ENOENT)
            fprintf(stderr, "lookup failed for PID %u: %s\n", next,
                    strerror(errno));

        key = next;
        previous = &key;
        errno = 0;
    }

    if (ret != 0 && errno != ENOENT) {
        fprintf(stderr, "map iteration failed: %s\n", strerror(errno));
        return -errno;
    }

    return 0;
}

int main(void)
{
    struct count_bpf *skel = NULL;
    int map_fd;
    int err;

    setvbuf(stdout, NULL, _IOLBF, 0);

    err = install_signal_handlers();
    if (err)
        return 1;

    skel = count_bpf__open();
    if (!skel) {
        fprintf(stderr, "failed to open count BPF skeleton\n");
        return 1;
    }

    err = count_bpf__load(skel);
    if (err) {
        fprintf(stderr, "failed to load count BPF programs: %s\n",
                strerror(-err));
        goto cleanup;
    }

    err = count_bpf__attach(skel);
    if (err) {
        fprintf(stderr, "failed to attach count BPF programs: %s\n",
                strerror(-err));
        goto cleanup;
    }

    map_fd = bpf_map__fd(skel->maps.counts);
    puts("Counting unlink calls; press Ctrl-C to stop.");
    while (!exiting) {
        unsigned int remaining = sleep(2);

        if (exiting)
            break;
        if (remaining != 0)
            continue;

        err = dump_counts(map_fd);
        if (err)
            goto cleanup;
    }

    err = 0;

cleanup:
    count_bpf__destroy(skel);
    return err != 0;
}
Three things to connect back to the “two doors” section:
bpf_map__fd(skel->maps.counts)pulls the integer fd out of the skeleton — that’s userspace’s only handle on the kernel map.bpf_map_get_next_key(fd, previous, &next)walks the map. Calling it with a NULL previous-key pointer returns the first key; calling it with the previous key returns the next. It returns-1witherrno == ENOENTwhen iteration is exhausted; the checked-in loader treats other errors as failures instead of spinning forever. Each call is onesys_bpf(BPF_MAP_GET_NEXT_KEY, …). This is why the loop lives in userspace.bpf_map_lookup_elem(fd, &next, &val)here is the userspace function — it copies the value intoval, which we then read. (Contrast with the BPF side, which got a live pointer.)
Run it
In terminal 1:
make count
sudo ./.output/day02/count
In terminal 2, generate work inside a directory this lab owns. One rm process performs all 100 unlinks, so they aggregate under one PID:
scratch=$(mktemp -d /tmp/ebpf-day02.XXXXXX)
for i in $(seq 1 100); do touch "$scratch/x$i"; done
rm "$scratch"/x*
rmdir "$scratch"
# wait 2s for the next snapshot, then Ctrl-C the loader in terminal 1
If you rm inside the loop (touch ... && rm ...), the shell forks a brand-new rm process every iteration, so each unlink comes from a different PID and the map fills with ~100 entries of value 1 — the exact opposite of what we’re demonstrating. Batching the deletes makes one process issue all 100 unlinkat calls.
Expected — the snapshot also lists other PIDs from unrelated background unlink activity (systemd, systemd-logind, etc.), so look for the line showing 100:
--- snapshot ---
PID 14392: 100 unlinks
You can also dump from the pinned bpftool without writing the userspace iterator:
sudo ./.output/bpftool/bootstrap/bpftool map dump name counts
Ctrl-C sets the loader’s exit flag; after an interrupted sleep it destroys the skeleton, which detaches the fentry link and closes the map. The scratch directory is already gone.
What to break, in order
Break 1 — Drop the null check (rerun of Day 1, in a real context)
Change to:
__u64 *cnt = bpf_map_lookup_elem(&counts, &pid);
*cnt += 1;
Verifier rejects:
; *cnt += 1;
R1 invalid mem access 'map_value_or_null'
The *cnt += 1 is a direct store through a PTR_TO_MAP_VALUE_OR_NULL register, so the verifier’s check_mem_access falls through to its catch-all and prints invalid mem access 'map_value_or_null' (kernel/bpf/verifier.c). The type=... expected=... format is a different message — it comes from the helper-argument type checker when you hand a possibly-NULL pointer to a helper, not when you dereference it yourself. The exact register number depends on how clang allocates the lookup result, so yours may read R0 instead of R1.
Same lesson as Day 1, now with a hash map. The Verifier’s type system does not distinguish between “ringbuf reserve might fail” and “hash lookup might miss” — both produce PTR_TO_MAP_VALUE_OR_NULL (or PTR_TO_MEM_OR_NULL), both must be checked.
Break 2 — max_entries = 0
Change max_entries to 0 and rebuild. The loader fails:
libbpf: map 'counts': failed to create: Invalid argument
Map config errors fail before the Verifier runs. Read kernel/bpf/hashtab.c:htab_map_alloc_check (:407) to see the validation rules — including the explicit attr->max_entries == 0 || attr->key_size == 0 || attr->value_size == 0 → -EINVAL check at hashtab.c:446, which is the Invalid argument you just hit.
Break 3 — Wrong key size
Change __type(key, __u32) to __type(key, __u64) but keep passing __u32 pid (4 bytes) as the lookup key. The lookup will use 8 bytes starting at &pid, reading 4 bytes of stack garbage. You’ll see weird behavior: many keys, each one off by random bytes from the actual PID.
The Verifier might catch this (depending on how pid is laid out on the stack); it might not. Lesson: map key/value types must exactly match how you call into them. Mismatches don’t reliably fail at load time.
Break 4 — The “tracer that won’t clean up” pattern (preview of Day 9)
This break uses the Day 1 fentry+ringbuf program but with a twist:
SEC("fentry/vfs_read")
int BPF_PROG(on_read)
{
    __u64 tid = bpf_get_current_pid_tgid();
    __u64 ts = bpf_ktime_get_ns();
    bpf_map_update_elem(&counts, &tid, &ts, BPF_ANY);
    return 0;
}
Run for a minute. Watch the map fill:
sudo ./.output/bpftool/bootstrap/bpftool map dump name counts | wc -l
Without bpf_map_delete_elem somewhere, every TID that ever called vfs_read gets a permanent entry. Once you hit max_entries, new TIDs silently fail to insert. This is the bug Day 9 is about — but the lesson is here too: map entries don’t expire on their own. If you insert, plan to delete.
What to read in the kernel
kernel/bpf/hashtab.c— open it, readhtab_map_lookup_elem(small) andhtab_map_update_elem(longer). Note the per-bucket lock (htab_lock_bucket,:149; taken in update at:1217) and the two chain walkers —lookup_elem_raw(“can only be called with bucket lock taken”,:691) vs the lockless RCUlookup_nulls_elem_raw(:705). The file is ~2700 lines but you only need the lookup/update path today.kernel/bpf/verifier.c— searchmark_ptr_or_null_regs(:16060; the per-register workermark_ptr_or_null_regis at:16015). This is the function that flips a register’s type fromPTR_TO_MAP_VALUE_OR_NULLtoPTR_TO_MAP_VALUEafter a null check. Don’t try to read the whole verifier — just this function and its callers. Maybe 50 lines.include/uapi/linux/bpf.h— searchBPF_MAP_TYPE_. Skim every entry. You don’t need to know each one yet; just know they exist. We’ll use about half of them across these 30 days.
Bullet Points
- A map is the kernel-resident shared notebook between BPF and userspace.
BPF_MAP_TYPE_HASHis the workhorse — a power-of-two array of buckets, index =hash & (n_buckets-1). - Two doors into one map. The BPF program names the map by address and gets a live pointer; userspace names it by integer fd (
bpf_map__fd) and the libbpfbpf_map_*calls are thin wrappers aroundsys_bpf()that copy values in/out.bpf_map_lookup_elemis the name of both functions, with opposite contracts. - Lookup returns a pointer into live map memory, not a copy. The Verifier marks it
PTR_TO_MAP_VALUE_OR_NULLuntil you check. - Lockless reads, locked writes. Lookups walk an RCU
hlist_nullswith no lock (elements are RCU-freed, so the returned pointer can’t be freed under you); inserts/deletes take a per-bucket raw spinlock. That split is why you still need an atomic for the value. - Always check
bpf_map_lookup_elemfor NULL before dereferencing. max_entriesis a hard cap with no automatic eviction. Inserting into a full hash map returns-E2BIG.- Atomic updates use
__sync_fetch_and_add— the lookup gave you an unlocked pointer, so concurrent increments race and lose counts without it. BPF_MAP_TYPE_PERCPU_HASHgives every CPU its own value copy: no atomics, no contention, but userspace must sum across CPUs to read a total, and per-CPU value size is bounded byPCPU_MIN_UNIT_SIZE. Use it when the hot path is contended.- Don’t insert without a plan to delete. Maps don’t expire entries; tracers that don’t clean up degrade silently into oblivion.
Check question
Two CPUs simultaneously execute the program for the same PID, both observe cnt == NULL, and both try bpf_map_update_elem(..., BPF_NOEXIST). What happens?
Click to reveal answer
Answer: The first to acquire the bucket lock (in htab_map_update_elem) succeeds and inserts. The second observes the entry now exists and returns -EEXIST. In the checked-in lab, that losing CPU re-runs the lookup and applies __sync_fetch_and_add to the winner’s entry, so both increments are represented. Without that retry the value would remain 1 instead of 2. A BPF_MAP_TYPE_PERCPU_HASH removes this cross-CPU hot-slot contention entirely, at the cost of summing per-CPU values in userspace.
Tomorrow
Day 3: CO-RE in anger. Read task->real_parent->tgid from BPF in a way that survives kernel upgrades. The first time vmlinux.h and CO-RE relocations earn their keep.
Day 3 — CO-RE: read task->real_parent->tgid and survive a kernel upgrade
Today’s mission: read the parent PID of every process that calls
unlink. Do it in a way that runs unchanged on the kernel you compiled against and on next year’s kernel after the layout drifts. Total time: ~95 minutes.
The fragile pre-CO-RE world
Before CO-RE existed, BPF tracing programs had two ugly choices:
-
bcc-style runtime compilation. Ship the BPF source as a string. The userspace tool detects the running kernel, calls Clang at runtime against the current kernel’s headers, compiles the program then and there, loads it. Slow startup (Clang takes ~seconds), needs Clang+headers on every target machine, and breaks subtly when headers don’t match a running kernel built from a slightly different config.
-
Hardcoded offsets. Read kernel struct fields with
bpf_probe_read_kernel(&out, sizeof(out), (char *)task + 1872). Works on exactly the kernel you derived1872from. Breaks the moment that struct grows a field.
Both options are why pre-2020 BPF tooling felt brittle. CO-RE killed both.
And the structure that breaks hardcoded-offset tools worst is the one we’re going to read today: struct task_struct. So before we touch CO-RE, let’s meet it — because half of why CO-RE exists is to read this one struct safely.
The structure that motivates everything: task_struct
Every runnable thread in the kernel — every process, every thread inside a process, every kernel worker — is described by exactly one struct task_struct. It is the kernel’s process/thread descriptor: the big bag of state the scheduler, the signal code, the VFS, and the credential machinery all hang off of. It is genuinely large — hundreds of fields, well over a kilobyte — holding scheduling state, the open-file table, credentials, parent/child links, and a short human-readable name.
A few fields are all we need today. In v7.1 (include/linux/sched.h):
pid_t pid;                              /* sched.h:1063 — per-thread ID      */
pid_t tgid;                             /* sched.h:1064 — thread-group ID    */
struct task_struct __rcu *real_parent;  /* sched.h:1077 — the (original) parent */
struct task_struct __rcu *parent;       /* sched.h:1080 — recipient of SIGCHLD  */
char comm[TASK_COMM_LEN];               /* sched.h:1173 — 16-byte thread name   */
current: the task that’s running right now
You never get a task_struct out of thin air — you ask “who is running on this CPU at this instant?” The kernel’s answer is the macro current. It’s a per-CPU/arch construct that yields the task_struct * of whatever thread is executing right now (on x86_64 it’s read from a per-CPU variable; other arches stash it in a register). Whenever kernel code says current->pid, it means “the PID of the thread that triggered this code path.”
BPF gets at it through a helper. bpf_get_current_task_btf() literally returns current — its kernel implementation is one line:
/* kernel/trace/bpf_trace.c:766 */
BPF_CALL_0(bpf_get_current_task_btf)
{
	return (unsigned long) current;   /* :768 */
}
So when your program calls bpf_get_current_task_btf() inside the unlink hook, you get the task_struct of the process that called unlink. That’s the anchor for everything else today.

pid vs tgid: the kernel’s PID is not userspace’s PID
Here’s the trap that bites everyone once. In the kernel, pid is the per-thread ID and tgid (thread-group ID) is the leader thread’s pid. A single-threaded process has pid == tgid. A process with four threads has four distinct pids but one shared tgid.
Userspace getpid() returns the tgid. So:
- The user-visible PID of a task is its
tgid. - The user-visible PPID is the parent’s
tgid— i.e.real_parent->tgid.
(Day 1 already noted “userspace PID = kernel TGID” in passing when we used bpf_get_current_pid_tgid; this is why. That helper packs tgid in the high 32 bits and pid in the low 32 — >> 32 gives you the user-visible PID.)
That single fact is why the lab reads real_parent->tgid and not real_parent->pid: we want the PPID a human would recognize from ps, which is the parent’s thread-group ID.
real_parent vs parent
There are two parent pointers, and the kernel comment block at sched.h:1071 explains why:
real_parent(sched.h:1077) — the original/biological parent. Used for reparenting and ptrace bookkeeping. This is the “who actually forked me” link.parent(sched.h:1080) — the task that receivesSIGCHLDandwait4()reports. Usually identical toreal_parent, but underptrace(a debugger,strace) theparentbecomes the tracer whilereal_parentstays the true parent.
The lab deliberately uses real_parent so the true parent shows up even if something is tracing the process.
comm[16]: the thread name
comm is a fixed 16-byte (TASK_COMM_LEN, sched.h:325) NUL-padded thread name — "bash", "rm", "sshd". It’s the same buffer Day 1’s bpf_get_current_comm helper copied out for you. Today we read it directly via CO-RE instead, which is the whole point: we’re going to walk into task_struct by hand.
And this is why CO-RE matters. task_struct grows and reshuffles constantly between kernel versions — a new scheduler field here, a reordered block there. Every one of those changes shifts the byte offset of comm, tgid, real_parent. A tool that hardcoded (char *)task + 1872 is broken by the next -rc. CO-RE is the fix.
What CO-RE actually does
You write field accesses by name:
__u32 ppid = BPF_CORE_READ(task, real_parent, tgid);
The compiler emits an instruction that loads a value at offset 0xC0RE0001 (a placeholder — Clang fills the actual relocation index there). Alongside the instruction, it emits a CO-RE relocation record that says: “the offset I just used is bogus; at load time, look up the byte offset of task_struct.real_parent in the target kernel’s BTF and patch this instruction with the real value.”
When libbpf loads the program, it walks every CO-RE relocation, looks up the field by name in /sys/kernel/btf/vmlinux, computes the offset, and patches the instruction. Same .o file, different patched offsets per kernel.
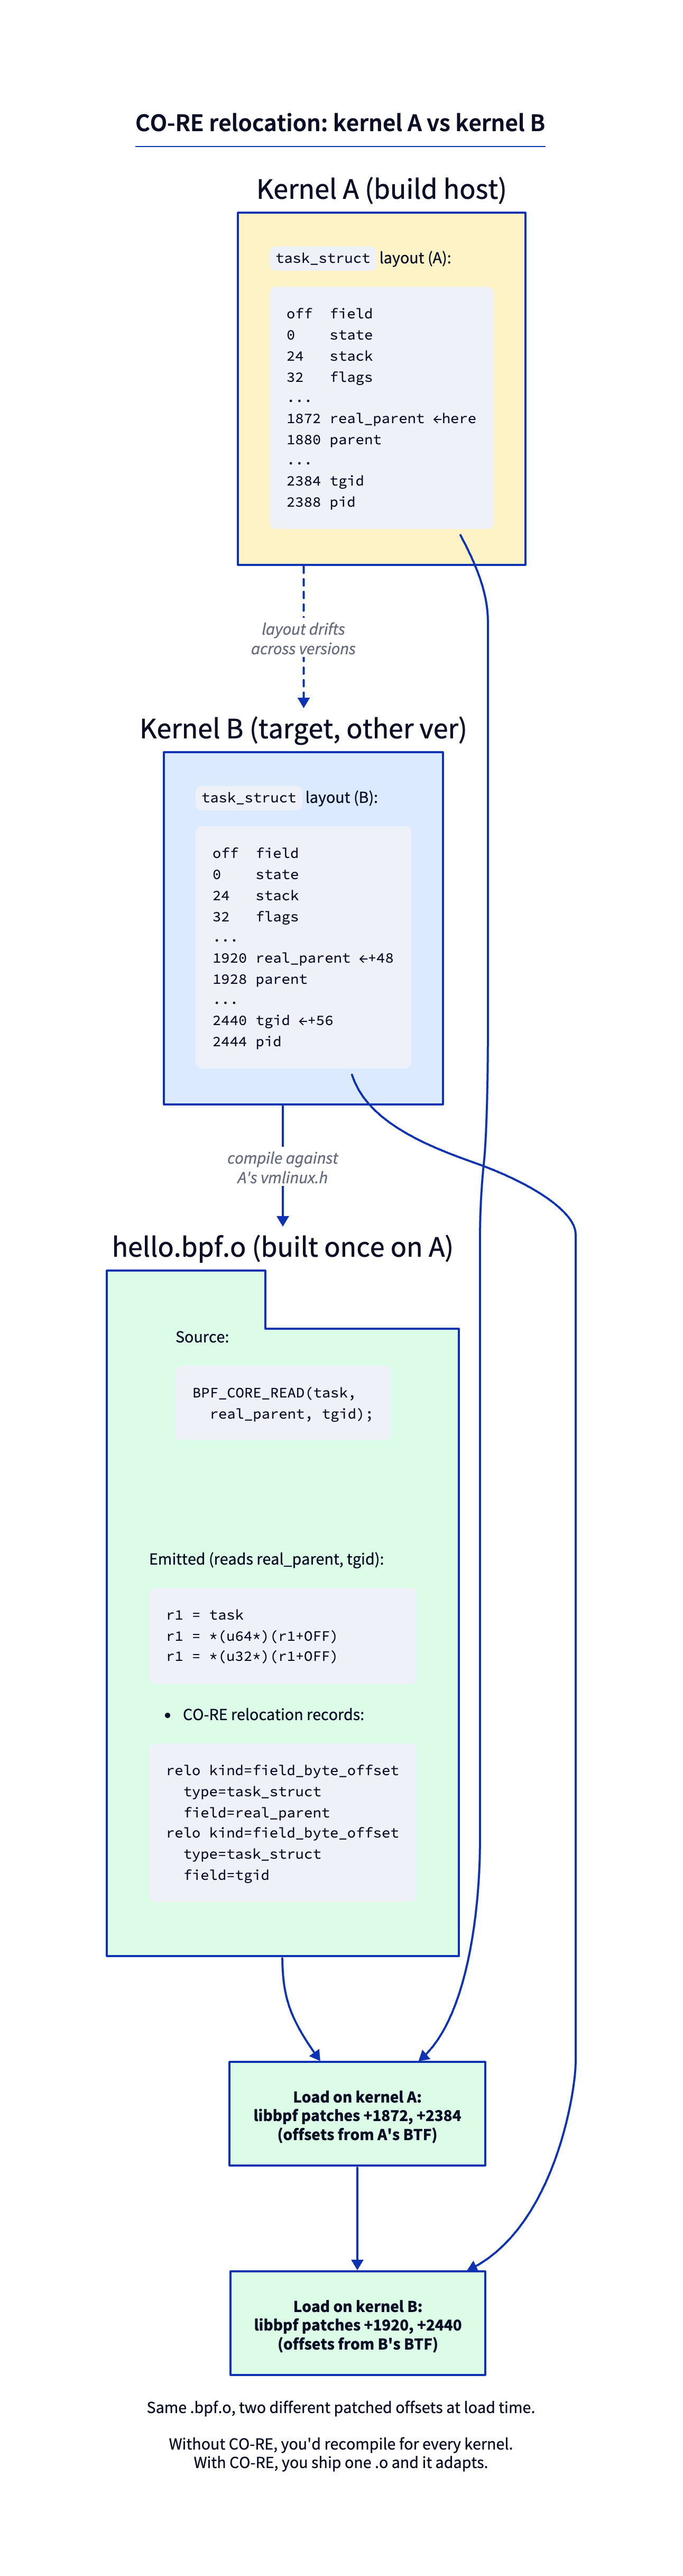
This is why your Day 1 program’s BPF_PROG(on_unlink, int dfd, struct filename *name) worked without you knowing the byte offset of anything — every kernel-type access went through this name-based relocation.
There are no Dumb Questions
Q: Why doesn’t C just do this normally? My userspace programs include kernel headers and read fields by name.
A: Userspace
#include <linux/sched.h>reads the headers from when you compiled. If the running kernel has a different layout, you crash or read wrong bytes — that’s why people warn against using kernel headers from outside/proc. CO-RE inverts the model: you build BPF programs as if struct layouts are unknown until load time, then libbpf resolves them against ground truth.Q: What if a field doesn’t exist on the target kernel?
A: There are CO-RE primitives for that:
bpf_core_field_exists(task->real_parent)— returns 1 if the field exists, 0 otherwise.bpf_core_type_exists(struct foo)— same for whole types.bpf_core_enum_value_exists(...)— same for enum members.If you check existence and skip access, libbpf will also patch the access instruction to a no-op when the field is missing. You can ship one program that gracefully degrades across kernel versions.
Q: Are direct typed-pointer derefs the same as
BPF_CORE_READ?A: Almost. With BTF and the right program type, the Verifier accepts
task->real_parent->tgidand the compiler emits CO-RE-relocated instructions. Both are memory-safe:BPF_CORE_READexpands tobpf_probe_read_kernel(a helper call that zero-fills on a bad pointer), while a direct deref of a walkedPTR_TO_BTF_IDis rewritten by the verifier to a fault-protectedBPF_PROBE_MEMload that also zero-fills. The real difference is speed and applicability: direct deref is an inline load (no call) but needs a verifier-typed pointer, whileBPF_CORE_READis slower but works even when the verifier can’t type the pointer (kprobept_regscasts, non-BTF program types). For arguments handed to you by the kernel (fentry params,bpf_get_current_task_btf()), direct deref is ideal. (We unpack exactly why one is faster two sections down.)
Sharpen your pencil
Your Day 1 and Day 2 programs read
bpf_get_current_pid_tgid() >> 32to get the PID. That doesn’t go through CO-RE — there’s no struct field involved. But the BPF program still has to know it’s running on Linux x86_64 vs ARM64. What handles that abstraction?.
.
.Answer: the helper itself.
bpf_get_current_pid_tgidis implemented inkernel/bpf/helpers.cand is called the same way regardless of arch. Architecture-specific work happens inside the kernel implementation. CO-RE is for accessing kernel data structures whose layout differs across kernel versions, not for arch-portable helper calls.
Why BPF can’t just dereference a pointer: bpf_probe_read_kernel
We keep saying “BPF_CORE_READ fault-handles each hop” and “direct deref is faster but assumes the pointer is valid.” To make that concrete you need to know what’s underneath — and the answer is a helper called bpf_probe_read_kernel.
Here’s the problem. A BPF program runs in kernel context. If it blindly dereferenced an arbitrary kernel pointer and that pointer were NULL, stale, or just wrong, it would fault in kernel context — and a fault in the kernel is not a friendly segfault, it’s an oops. BPF is supposed to be safe to load on a production box. So the kernel does not let a BPF program follow just any pointer. It offers exactly two sanctioned ways to touch kernel memory.
Way 1 — the bpf_probe_read_kernel(dst, size, src) helper. It copies size bytes from src into dst, but it does the copy through copy_from_kernel_nofault, the kernel’s “try this load, but catch the fault instead of crashing” primitive. If the read faults, the helper doesn’t crash — it zero-fills dst and returns -EFAULT:
/* include/linux/bpf.h:3387 — bpf_probe_read_kernel_common, the plain kernel read path */
ret = copy_from_kernel_nofault(dst, unsafe_ptr, size);  /* :3392 */
if (unlikely(ret < 0))
	memset(dst, 0, size);     /* :3394 — the zero-fill-on-fault path */
return ret;
(The string and user variants live in kernel/trace/bpf_trace.c and use a different primitive: bpf_probe_read_user_common memsets at :179, bpf_probe_read_user_str_common at :216, bpf_probe_read_kernel_str_common at :266. Only the non-string kernel read shown above is in bpf.h.)
/* kernel/trace/bpf_trace.c:235 */
BPF_CALL_3(bpf_probe_read_kernel, void *, dst, u32, size,
	   const void *, unsafe_ptr)
{
	return bpf_probe_read_kernel_common(dst, size, unsafe_ptr);   /* :238 */
}
That memset(dst, 0, size) is the source of the chapter’s “BPF_CORE_READ returns a default 0 on bad pointers” behavior. The zero doesn’t come from CO-RE — it comes from this helper’s error path. A bad hop gives you a clean 0, not a crash.
Way 2 — verifier-trusted typed pointers. When the Verifier can prove a pointer’s type and trustworthiness, it lets the JIT emit a plain hardware load with no helper call at all. No copy_from_kernel_nofault, no fault net — just a ldx. This is the fast path, and it’s why direct deref (task->real_parent->tgid) beats the macro. We meet the register type that unlocks it in the next section.
So now the two forms decompose cleanly:
BPF_CORE_READ= (CO-RE relocation to patch the offset) + (bpf_probe_read_kernelto fault-protect the load), chained once per pointer hop.- Direct deref = (CO-RE relocation to patch the offset) + (plain trusted load, no fault net).
Both keep the relocation. Only BPF_CORE_READ keeps the safety net. You can see the marriage of relocation-and-probe-read right in the header:
/* tools/lib/bpf/bpf_core_read.h:312 */
bpf_probe_read_kernel(dst, sz, (const void *)__builtin_preserve_access_index(src))
The __builtin_preserve_access_index(src) is the CO-RE relocation (it records “this offset must be patched against target BTF”); the bpf_probe_read_kernel(...) wrapped around it is the fault protection. One macro, both jobs.
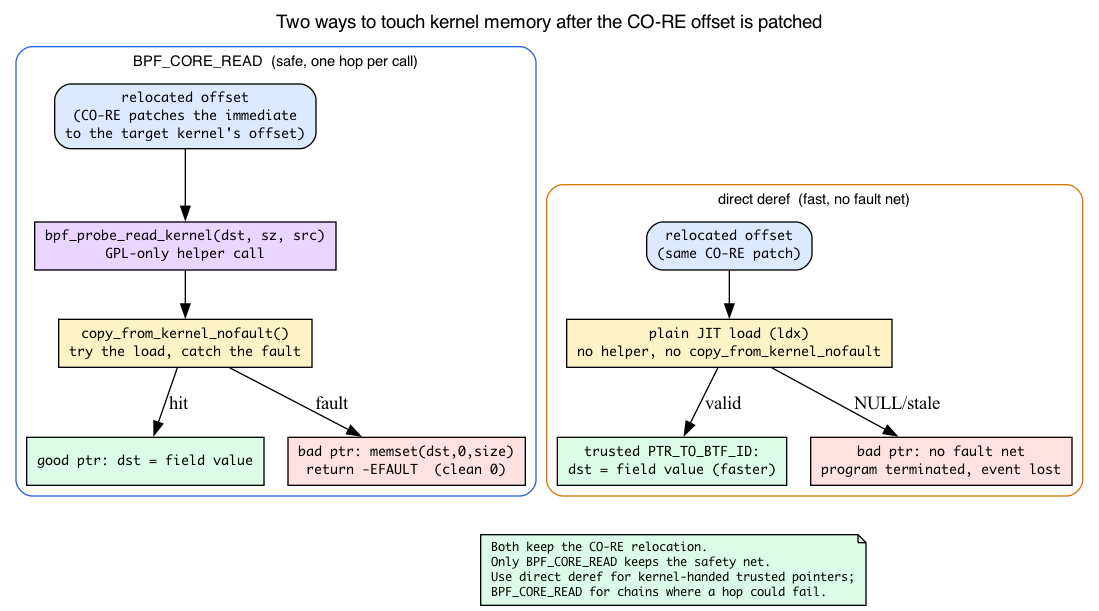
One licensing consequence.
bpf_probe_read_kernel’s proto is GPL-only:/* kernel/trace/bpf_trace.c:241 */ const struct bpf_func_proto bpf_probe_read_kernel_proto = { .func = bpf_probe_read_kernel, .gpl_only = true, /* :243 */ ... };This ties straight back to Day 1’s LICENSE gate (Day 1, Break 3): the instant your program uses
BPF_CORE_READ, it routes through this GPL-only helper, so it genuinely needschar LICENSE[] SEC("license") = "GPL";. Drop the GPL string and the loader rejects the program with “helper call is not allowed in non-GPL program.” That’s not bureaucracy — it’s this proto’s.gpl_onlyflag.
PTR_TO_BTF_ID: the trusted, typed pointer that lets you skip the safety net
The fast path above hinges on one Verifier concept, so let’s name it.
Refresher (Day 2): the Verifier tags every register with a type and tracks what you may legally do with it. Recall PTR_TO_MAP_VALUE_OR_NULL from yesterday — the type a bpf_map_lookup_elem result carries until you NULL-check it. You couldn’t dereference it until you proved it non-NULL.
New today: PTR_TO_BTF_ID is a register type that says “this pointer points at a specific kernel type, identified by a BTF type id.” Because the register carries the type, the Verifier can type-check field accesses against the real struct layout and permit a direct load of a field at the relocated offset. No helper call needed — that’s the plain ldx from the previous section.
The _TRUSTED variant adds one more guarantee: the pointer is non-NULL and not stale. So no NULL check is required before deref — unlike a map-value pointer, which always might be NULL.
This is exactly why bpf_get_current_task_btf() is special. Look at its proto:
/* kernel/trace/bpf_trace.c:771 */
const struct bpf_func_proto bpf_get_current_task_btf_proto = {
	.func		= bpf_get_current_task_btf,
	.gpl_only	= true,
	.ret_type	= RET_PTR_TO_BTF_ID_TRUSTED,                  /* :774 */
	.ret_btf_id	= &btf_tracing_ids[BTF_TRACING_TYPE_TASK],    /* :775 */
};
RET_PTR_TO_BTF_ID_TRUSTED + a ret_btf_id pointing at the task_struct BTF id means: the Verifier marks the returned register a trusted, non-NULL PTR_TO_BTF_ID of type task_struct. That’s why the lab can write task->real_parent->tgid with zero NULL checks on task — the Verifier already knows it’s a valid task pointer.
Contrast the older helper, bpf_get_current_task (bpf_trace.c:755), whose proto has .ret_type = RET_INTEGER — it hands back an opaque u64 you have to cast yourself, with no type information for the Verifier. That’s the “older variant that returned an opaque u64 you had to cast” the cast notes mention. The _btf version exists precisely to give the Verifier the type.
This is the first of Day 1’s “four things BTF powers” (Day 1: “Verifier type-checking of typed pointers (PTR_TO_BTF_ID)”) finally made concrete. Forward pointer: Day 4 formalizes the Verifier’s full type lattice. For today, hold one sentence: PTR_TO_BTF_ID = a typed, trusted kernel pointer the Verifier lets you dereference directly.
Meet the cast
bpf_get_current_task_btf — typed access to current
Returns a struct task_struct * with the BTF type tag attached (RET_PTR_TO_BTF_ID_TRUSTED, as we just saw). The Verifier knows it’s a valid, non-NULL kernel pointer. You can deref fields directly. Cheaper than bpf_get_current_task (the older variant that returned an opaque u64 you had to cast).
BPF_CORE_READ(task, a, b, c) — chained CO-RE-aware reads
Expands to a series of bpf_probe_read_kernel calls walking each pointer hop, with CO-RE relocations on each field access. Equivalent to:
struct task_struct *p1 = task;
struct task_struct *p2;
__u32 result;
bpf_probe_read_kernel(&p2, sizeof(p2), &p1->real_parent);  // CO-RE: real_parent offset
bpf_probe_read_kernel(&result, sizeof(result), &p2->tgid); // CO-RE: tgid offset
The macro saves you that boilerplate and fault-handles each hop, as the bpf_probe_read_kernel section showed — a bad pointer anywhere in the chain yields a clean 0 instead of a crash.
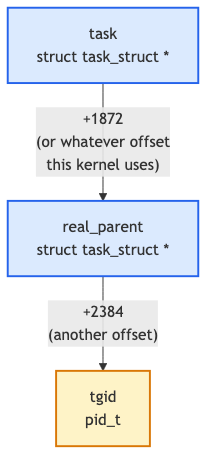
BPF_CORE_READ_INTO(dst, src, a, b, c)
Same thing but writes the final value into *dst instead of returning it. Use when the field is larger than 8 bytes (e.g., reading task->comm[16] into a buffer).
BPF_CORE_READ_STR_INTO(dst, src, a, b, c)
Reads a NUL-terminated string. Bounds the read at sizeof(dst). Returns the actual length copied.
The lab
Continue in the repository’s ebpf/labs directory. make parent compiles the exact anchored listings shown below.
parent.h — the shared event record
#ifndef PRACTICAL_EBPF_PARENT_H
#define PRACTICAL_EBPF_PARENT_H

struct parent_event {
    unsigned int pid;
    unsigned int ppid;
    char comm[16];
    char parent_comm[16];
};

#endif
parent.bpf.c
#include "vmlinux.h"
#include <bpf/bpf_core_read.h>
#include <bpf/bpf_helpers.h>
#include <bpf/bpf_tracing.h>

#include "parent.h"

char LICENSE[] SEC("license") = "GPL";

struct {
    __uint(type, BPF_MAP_TYPE_RINGBUF);
    __uint(max_entries, 256 * 1024);
} rb SEC(".maps");

SEC("fentry/filename_unlinkat")
int BPF_PROG(on_unlink)
{
    struct task_struct *task;
    struct parent_event *event;

    task = (struct task_struct *)bpf_get_current_task_btf();
    event = bpf_ringbuf_reserve(&rb, sizeof(*event), 0);
    if (!event)
        return 0;

    __builtin_memset(event, 0, sizeof(*event));
    event->pid = bpf_get_current_pid_tgid() >> 32;
    event->ppid = BPF_CORE_READ(task, real_parent, tgid);
    BPF_CORE_READ_STR_INTO(&event->comm, task, comm);
    BPF_CORE_READ_STR_INTO(&event->parent_comm, task, real_parent, comm);

    bpf_ringbuf_submit(event, 0);
    return 0;
}
What’s new:
bpf_get_current_task_btf()returns a typedstruct task_struct *. Its proto’s return type isRET_PTR_TO_BTF_ID_TRUSTED, so the Verifier marks the register a trusted, non-NULLPTR_TO_BTF_ID— you can deref its fields directly with no NULL check.__builtin_memset(event, 0, sizeof(*event))initializes the whole reserved record before helper reads. If a fault-tolerant string read fails, userspace receives an empty string instead of stale ringbuf bytes.BPF_CORE_READ(task, real_parent, tgid)walkstask → real_parent → tgid(recall:tgidis the user-visible PID, so the parent’stgidis the PPID). Each hop is a CO-RE-relocatedbpf_probe_read_kernel.BPF_CORE_READ_STR_INTO(&event->comm, task, comm)readstask->comm(a 16-byte char array, not a pointer). Notecommis the last arg; for non-pointer fields you don’t need a final*deref hop.- Unlike Day 1,
BPF_PROG(on_unlink)takes no extra params — we don’t need the unlink arguments (dfd/name) today, becausebpf_get_current_task_btf()hands us the task directly.
Userspace parent.c
The loader mirrors Day 1’s checked error and signal paths, validates the shared struct parent_event, and releases both ringbuf and skeleton on exit:
#include <errno.h>
#include <signal.h>
#include <stdio.h>
#include <string.h>

#include <bpf/libbpf.h>

#include "parent.h"
#include "parent.skel.h"

static volatile sig_atomic_t exiting;

static void handle_signal(int signal_number)
{
    (void)signal_number;
    exiting = 1;
}

static int install_signal_handlers(void)
{
    const struct sigaction action = {
        .sa_handler = handle_signal,
    };

    if (sigaction(SIGINT, &action, NULL) != 0 ||
        sigaction(SIGTERM, &action, NULL) != 0) {
        fprintf(stderr, "failed to install signal handlers: %s\n",
                strerror(errno));
        return -errno;
    }

    return 0;
}

static int handle_event(void *ctx, void *data, size_t size)
{
    const struct parent_event *event = data;

    (void)ctx;
    if (size != sizeof(*event)) {
        fprintf(stderr, "unexpected ringbuf record size: %zu\n", size);
        return 0;
    }

    printf("PID %u (%.*s) ppid %u (%.*s) deleted a file\n",
           event->pid, (int)sizeof(event->comm), event->comm,
           event->ppid, (int)sizeof(event->parent_comm), event->parent_comm);
    return 0;
}

int main(void)
{
    struct parent_bpf *skel = NULL;
    struct ring_buffer *ringbuf = NULL;
    int err;

    setvbuf(stdout, NULL, _IOLBF, 0);

    err = install_signal_handlers();
    if (err)
        return 1;

    skel = parent_bpf__open();
    if (!skel) {
        fprintf(stderr, "failed to open parent BPF skeleton\n");
        return 1;
    }

    err = parent_bpf__load(skel);
    if (err) {
        fprintf(stderr, "failed to load parent BPF programs: %s\n",
                strerror(-err));
        goto cleanup;
    }

    err = parent_bpf__attach(skel);
    if (err) {
        fprintf(stderr, "failed to attach parent BPF programs: %s\n",
                strerror(-err));
        goto cleanup;
    }

    ringbuf = ring_buffer__new(bpf_map__fd(skel->maps.rb), handle_event,
                               NULL, NULL);
    err = libbpf_get_error(ringbuf);
    if (err) {
        ringbuf = NULL;
        fprintf(stderr, "failed to create ringbuf consumer: %s\n",
                strerror(-err));
        goto cleanup;
    }

    puts("Tracing unlink callers and parents; press Ctrl-C to stop.");
    while (!exiting) {
        err = ring_buffer__poll(ringbuf, 100);
        if (err == -EINTR) {
            err = 0;
            continue;
        }
        if (err < 0) {
            fprintf(stderr, "ringbuf poll failed: %s\n", strerror(-err));
            goto cleanup;
        }
    }

    err = 0;

cleanup:
    ring_buffer__free(ringbuf);
    parent_bpf__destroy(skel);
    return err != 0;
}
Run it
In terminal 1:
make parent
sudo ./.output/day03/parent
In terminal 2:
scratch=$(mktemp -d /tmp/ebpf-day03.XXXXXX)
touch "$scratch/x"
rm "$scratch/x"
rmdir "$scratch"
Expected:
PID 24501 (rm) ppid 24450 (bash) deleted a file
That parent is real_parent->tgid and real_parent->comm working exactly as the task_struct section promised: rm’s real parent is the shell that forked it, and its tgid is the PPID ps would show.
Press Ctrl-C in terminal 1 when the event appears. The loader frees the ringbuf and destroys the skeleton, detaching its fentry link without a broad pkill.
Inspect what CO-RE actually emitted
This is the most important step today. You need to see the relocations to believe they exist.
Disassemble the object with relocations interleaved (the -r flag is what makes the CO-RE records appear — -d alone never prints them):
llvm-objdump -dr .output/day03/parent.bpf.o | grep CO-RE
(If llvm-objdump isn’t found, your distro may only ship versioned binaries — try llvm-objdump-21 or llvm-objdump-18. Either works; the -dr flags and output are identical.)
Recent LLVM annotates the BPF disassembly with the CO-RE relocation records read from the object’s .BTF.ext section. You’ll see one line per kernel-field access:
0000000000000060:  CO-RE <byte_off> [13] struct task_struct::real_parent
00000000000000a0:  CO-RE <byte_off> [13] struct task_struct::tgid
00000000000000e8:  CO-RE <byte_off> [13] struct task_struct::comm
(addresses and the type index [13] vary by build). Drop the | grep CO-RE to see the full disassembly: the load instruction just above each relocation carries the compile-time byte offset Clang baked in — e.g. r1 = 0xae0 for real_parent — not a placeholder like 0x0. libbpf rewrites that immediate at load time if the running kernel’s layout differs. CO-RE relocation records live in the ELF section .BTF.ext (the object also has .BTF, .rel.BTF, and .rel.BTF.ext); there is no .relo.btf section.
To inspect the embedded types instead:
./.output/bpftool/bootstrap/bpftool btf dump file .output/day03/parent.bpf.o
You’ll see your maps (VAR 'rb' and the .maps DATASEC), your on_unlink program function, and references to kernel types like task_struct.real_parent. (struct parent_event is used only inside function code and is not reachable from a map, global, or function prototype, so the compiler does not emit it into the object’s BTF.)
Aside — shipping minimal BTF.
./.output/bpftool/bootstrap/bpftool gen min_core_btf /sys/kernel/btf/vmlinux min.btf .output/day03/parent.bpf.owrites a minimal BTF file containing only the types your program references (it prints nothing to stdout). That’s for portability — shipping a tiny BTF alongside your.ofor kernels without/sys/kernel/btf/vmlinux— not for inspecting relocations.
To watch the relocations get applied at load time, you need libbpf’s own debug log, not the kernel verifier log. The two are different: .kernel_log_level feeds bpf_attr.log_level, which controls the in-kernel verifier log (a disassembled, post-relocation instruction dump plus verifier state). CO-RE patching happens in libbpf userspace before the BPF_PROG_LOAD syscall, so the verifier log contains no CO-RE string and no relocation provenance — grepping it for CO-RE finds nothing.
The patching messages come out of libbpf’s print callback at the LIBBPF_DEBUG level. Easiest from the shell — load with bpftool’s -d flag (which sets libbpf to LIBBPF_DEBUG) and grep for the relocation lines:
sudo ./.output/bpftool/bootstrap/bpftool -d prog load .output/day03/parent.bpf.o /sys/fs/bpf/parent 2>&1 | grep relo
sudo rm -f /sys/fs/bpf/parent   # clean up the pin
You’ll see lines like prog 'on_unlink': relo #N: ... patched insn .... From C, register a print callback and raise the level before open/load:
static int dbg(enum libbpf_print_level lvl, const char *fmt, va_list ap)
{
    return vfprintf(stderr, fmt, ap);
}
// in main(), before parent_bpf__open():
libbpf_set_print(dbg);
Note libbpf’s default print callback only emits WARN to stderr; the INFO/DEBUG relocation lines are suppressed unless you install your own callback or use a debug-enabled loader.
What to break, in order
Break 1 — Use a non-existent field
Add this line:
__u32 fake = BPF_CORE_READ(task, this_field_does_not_exist);
You might expect this to compile and only blow up at load time. It doesn’t — the build fails immediately:
error: no member named 'this_field_does_not_exist' in 'struct task_struct'
Here’s why: BPF_CORE_READ doesn’t reference fields by an opaque name string. It expands to the real C member-access expression (task->this_field_does_not_exist) wrapped in __builtin_preserve_access_index, and Clang type-checks that member against the struct task_struct in your vmlinux.h. A name that exists in no BTF at all is a plain C error. (bpf_core_field_exists(task->this_field_does_not_exist) fails the same way — it also emits the member-access expression.)
So to exercise the genuine load-time relocation-failure path — the one that prints
libbpf: prog 'on_unlink': relo #N: failed to relocate ...
you need a field that exists in your build’s BTF/vmlinux.h but is absent on the target kernel. The realistic way to trigger it is to compile against a newer vmlinux.h and load on an older kernel that lacks the field.
For the graceful-degradation demo, use a field that actually exists so the program compiles, and gate it on bpf_core_field_exists:
__u32 fake = 0;
if (bpf_core_field_exists(task->pid))
    fake = BPF_CORE_READ(task, pid);
The point of bpf_core_field_exists is fields that appear or disappear across kernel versions: libbpf evaluates the check at load time against the target kernel’s BTF and patches the branch to a no-op when the field is absent, so a single .o runs on kernels that have or lack the field. It is not a way to reference a name that exists in no BTF at all.
Break 2 — Direct deref vs BPF_CORE_READ
Replace the macro form with direct deref:
event->ppid = task->real_parent->tgid;
Compiles. Verifier accepts. Runs. Faster than BPF_CORE_READ because no bpf_probe_read_kernel call — this is the trusted-PTR_TO_BTF_ID plain-load fast path we dissected earlier. The Verifier already knows task is a non-NULL task_struct, so it lets the JIT emit a bare load with no fault net.
But this is not a safety downgrade, and that’s the subtle part. When the verifier accepts task->real_parent->tgid, it doesn’t emit a bare load for the walked hop. real_parent is reached by following a pointer, so the resulting register is an untrusted PTR_TO_BTF_ID, and the verifier rewrites that tgid load into a BPF_LDX | BPF_PROBE_MEM with an exception-table entry (kernel/bpf/fixups.c). On a fault the load is skipped and the destination register is zero-filled — the same 0 you’d get from BPF_CORE_READ. So if real_parent were ever NULL, ppid comes back 0 and the event still fires; it does not crash, terminate, or lose the event. Only loads through genuinely trusted pointers (like task itself) stay bare — and those are exactly the pointers the verifier has proven non-NULL, so the NULL-deref scenario can’t arise for them.
So both forms are memory-safe and both zero-fill on a bad pointer. The real reasons to choose between them:
BPF_CORE_READemits abpf_probe_read_kernelhelper call (slower), but works even when the verifier can’t hand you a typed pointer — e.g. a kprobe’spt_regscast, or a non-BTF program type. It also keeps the whole chaineda, b, cexpression portable.- Direct deref of a verifier-typed
PTR_TO_BTF_IDemits an inline load (faster, no call). The verifier auto-rewrites the walked/untrusted hops toBPF_PROBE_MEMso they fault-protect and zero-fill too; only the proven-non-NULL trusted hop stays bare.
Break 3 — Forget #include <bpf/bpf_core_read.h>
BPF_CORE_READ is undefined; compile fails. Trivial, but worth noting: BPF helper headers are split across bpf_helpers.h (general), bpf_tracing.h (BPF_PROG, ctx unpacking, PT_REGS_*), bpf_core_read.h (CO-RE macros). Forget any of them and the failure mode is “macro X not defined.”
What to read in the kernel
tools/lib/bpf/relo_core.c— the CO-RE engine in userspace.bpf_core_calc_relo_insn(relo_core.c:1297) computes the relocation value from target-kernel BTF, andbpf_core_patch_insn(relo_core.c:1041) writes it into the instruction’s offset/immediate. ~300 lines, accessible if you know what to look for.tools/lib/bpf/btf.c— readbtf__find_by_name_kind(btf.c:1166). This is how libbpf finds types in BTF by name. CO-RE is built on top of it.tools/lib/bpf/bpf_core_read.h— searchBPF_CORE_READ. The macros expand to a chain ofbpf_core_read(kernel-side) calls;bpf_core_field_existsis at bpf_core_read.h:187-188. Reading them once eliminates magic.include/uapi/linux/btf.h— theBTF_KIND_*enums. BTF has ~19 kinds (int, ptr, array, struct, union, enum, fwd, typedef, volatile, const, restrict, func, func_proto, var, datasec, float, decl_tag, type_tag, enum64).BTF_KIND_ENUM64 = 19at uapi/btf.h:92, withNR_BTF_KINDSat :94 andBTF_KIND_MAXat :95.struct btf_typeis also defined here (at :43);include/linux/btf.honly forward-declares it (at :113). Skim.include/linux/sched.h— thestruct task_structwe read today:pid(1063),tgid(1064),real_parent(1077),parent(1080),comm(1173). Skim the field comments to feel how much state hangs off one task.
Bullet Points
- CO-RE = Compile Once, Run Everywhere. Field offsets are resolved at load time using target-kernel BTF.
task_structis the per-thread descriptor;currentis the running one;bpf_get_current_task_btf()returns it. User-visible PID =tgid, user-visible PPID =real_parent->tgid;comm[16]is the thread name.- BPF can’t blindly deref kernel pointers.
bpf_probe_read_kernelcopies viacopy_from_kernel_nofaultand zero-fills on fault (the source of “default 0”); it’s GPL-only, which is why CO-RE programs needSEC("license")="GPL". PTR_TO_BTF_ID(_TRUSTED) = a typed, non-NULL kernel pointer the Verifier lets you deref directly with no NULL check and no helper — the fast path behind direct deref.- Use
BPF_CORE_READ(a, b, c, d)to chain field accesses through pointer hops with fault-handling on each hop. - Use direct deref (
task->real_parent->tgid) when the pointer chain is trusted and you want speed. - Handle missing fields with
bpf_core_field_exists— libbpf will patch the access to a no-op when the field is absent. - BTF kinds you’ll meet:
STRUCT,UNION,ENUM,INT,PTR,ARRAY,FUNC,TYPEDEF. About 19 total.
Check question
You compile your program against kernel A. Field task_struct.real_parent is at offset 1872. You ship the .o to a machine running kernel B where the same field is at offset 1920. Your program does BPF_CORE_READ(task, real_parent, tgid). Walk through what happens at load time.
Click to reveal answer
Answer: libbpf opens /sys/kernel/btf/vmlinux on kernel B, parses it, finds the type task_struct and its field real_parent, computes byte offset 1920. It walks every CO-RE relocation in your .o. For the real_parent access, it overwrites the placeholder offset (the 0xC0RE... immediate the compiler emitted) with 1920. Same for tgid. Then BPF_PROG_LOAD is called with the patched instructions. The Verifier accepts. The program runs, reading the correct fields on kernel B. At runtime each hop goes through bpf_probe_read_kernel, so even if a pointer were bad the program gets a 0 rather than crashing.
Tomorrow
Day 4: meet the Verifier properly. We’ll spend a whole day deliberately tripping over PTR_TO_MAP_VALUE_OR_NULL rejections in five different shapes — because every BPF programmer, no matter how senior, hits this error monthly. The goal: stop being surprised by the rejection and start reading the log fluently. (Today’s PTR_TO_BTF_ID was a preview of the type lattice we formalize there.)
Day 4 — Meet the Verifier (PTR_TO_MAP_VALUE_OR_NULL boot camp)
Today’s mission: stop being surprised by the most common BPF rejection. Trip over
PTR_TO_MAP_VALUE_OR_NULLin five different shapes; read the log on each; learn what “register state” means — down to the individual registers and opcode bytes the log is built from. Total time: ~120 minutes. No new functionality today — this is pure verifier intuition.
Why a whole day on one error
Because you’ll see this rejection more than any other. Days 1–3 dodged it by always writing if (!cnt) return 0; immediately after lookups. That’s the trained-monkey response. Today is when that response becomes understanding.
The Verifier is not arbitrary. It runs an abstract interpreter over your program — for every instruction it tracks each register’s type, bounds, reference state, and which branch you’re on. When it can’t prove a memory access safe, it rejects. The error log tells you exactly which register and which instruction; if you can read register state, you can fix any rejection in under a minute.
But there’s a catch. Every line of that log is dense with notation the BPF tutorials never explain: R0, R10, (79), *(u64 *)(r0 +0), id=2, fp0. Today is titled a “register state boot camp,” so before we break anything we’re going to actually learn the alphabet: the eleven registers, the opcode bytes, and the two kinds of id. Then the five rejections read themselves.
The eleven registers: BPF’s whole register file
Every line in a verifier log mentions registers named R0 through R10. That is not a sampling — that is the entire register file. BPF has exactly eleven 64-bit registers, no more: ten general-purpose registers (R0–R9) plus one read-only frame pointer (R10):
/* include/uapi/linux/bpf.h:62-74 */
enum {
    BPF_REG_0 = 0,
    BPF_REG_1,
    ...
    BPF_REG_10,
    __MAX_BPF_REG,
};
/* include/uapi/linux/bpf.h:77-78 */
/* BPF has 10 general purpose 64-bit registers and stack frame. */
#define MAX_BPF_REG  __MAX_BPF_REG   /* == 11 slots: R0-R9 + R10 */
The Verifier keeps a struct bpf_reg_state for each of these eleven slots, at every instruction, on every path. When the log prints R0=map_value_or_null(...) R10=fp0, it’s dumping that per-register state table.
What makes the eleven registers legible is that they aren’t interchangeable — they follow a fixed calling convention, and the Verifier enforces it. This convention is the single most useful thing to memorize today, because it explains nearly every register name you’ll read:
| Register | Role | What the Verifier enforces |
|---|---|---|
| R0 | return value | A helper’s result always lands here. This is why bpf_map_lookup_elem’s OR_NULL pointer is always in R0. |
| R1–R5 | arguments / scratch | Caller passes args here. Clobbered across every helper call — reset to unreadable. |
| R6–R9 | callee-saved | State preserved across calls. Stash anything you need to survive a helper call here. |
| R10 | frame pointer | Read-only. Points at the top of the 512-byte BPF stack. You can’t reassign it. |
The kernel documentation states the call rule directly:
After kernel function call, R1-R5 are reset to unreadable and R0 has a return type of the function. Since R6-R9 are callee saved, their state is preserved across the call. —
Documentation/bpf/verifier.rst:32-35
And R10:
Though R10 is correct read-only register and has type PTR_TO_STACK… —
Documentation/bpf/verifier.rst:81-85
R10’s type is PTR_TO_STACK — “reg == frame_pointer + offset” (include/linux/bpf.h:996). You can read and write stack slots through it (*(u32 *)(r10-4)), but you can never reassign R10 itself — the Verifier rejects writes to it. The stack it points at is capped:
/* include/linux/filter.h:98 */
#define MAX_BPF_STACK 512
512 bytes. That’s your entire automatic-storage budget per program frame.
Why does R0 have to be the return register? Because the ABI says so, full stop:
BPF allows only register R0 to be used as return value. —
Documentation/bpf/bpf_design_QA.rst:41
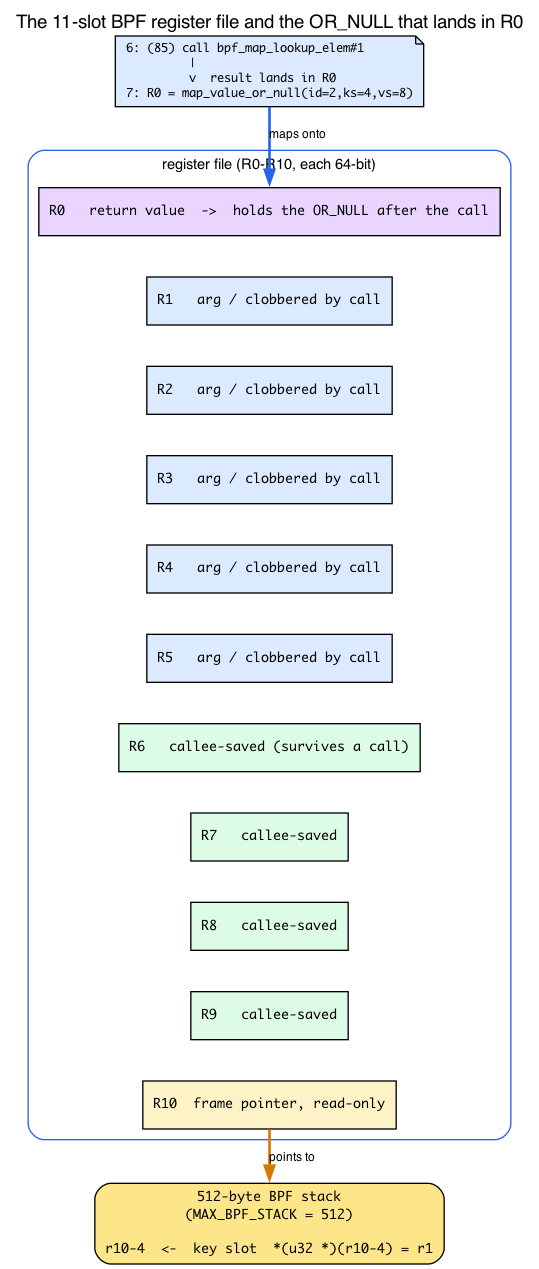
Hold onto one consequence, because it bites later today: a lookup result you copy with r0 → r6 survives a later helper call (R6 is callee-saved), but r0 → r1 does not (R1 is clobbered by the next call). That’s also why the Verifier’s id tracking — covered in “Two different ids” below — has to follow a value as it hops between registers.
Reading the pseudo-assembly: the (hex) opcode and the instruction format
Every trace line looks like 7: (79) r1 = *(u64 *)(r0 +0). Three parts: the instruction index (7:), the raw opcode byte in parentheses ((79)), and a human-readable spelling of what it does. The opcode byte is the part nobody explains — let’s decode it, because the whole rejection hinges on recognizing one opcode.
A BPF opcode is one byte, built by OR-ing three fields: instruction class | mode/op | source/size. You don’t need the full table; you need the handful that appear in these labs:
| Byte | Means | Spelled in the log as |
|---|---|---|
(b7) | ALU64 MOV immediate | r1 = 0 |
(bf) | ALU64 MOV register | r2 = r10 |
(07) | ALU64 ADD immediate | r2 += -4 |
(63) | STX MEM word store | *(u32 *)(r10-4) = r1 |
(18) | LD IMM double-word (16-byte insn) | r1 = 0xffff... (loads a map address) |
(85) | JMP CALL | call bpf_map_lookup_elem#1 |
(15) | JMP JEQ immediate (if r0 == 0 goto) | if r0 == 0 goto +N — the NULL check |
(55) | JMP JNE immediate (if r0 != 0 goto) | if r0 != 0 goto +N — the NULL check, other form |
(79) | LDX MEM double-word load | r1 = *(u64 *)(r0 +0) — the deref |
The (15)/(55) jumps are the comparison-against-zero that mark_ptr_or_null_regs keys off: spotting one of them between the (85) call and a (79) load is how you tell, by eye, whether the OR_NULL → MAP_VALUE transition had a chance to fire.
These bytes are just the header constants OR’d together. From include/uapi/linux/bpf_common.h (classes BPF_LD 0x00, BPF_LDX 0x01, BPF_ST 0x02, BPF_STX 0x03, BPF_ALU 0x04, BPF_JMP 0x05; modes BPF_IMM 0x00, BPF_MEM 0x60; sizes BPF_W 0x00, BPF_DW 0x18) and include/uapi/linux/bpf.h (BPF_ALU64 0x07, BPF_MOV 0xb0, BPF_DW 0x18, BPF_CALL 0x80):
(79)=BPF_LDX(0x01) | BPF_MEM(0x60) | BPF_DW(0x18)— a load.(85)=BPF_JMP(0x05) | BPF_CALL(0x80)— a call.(b7)=BPF_ALU64(0x07) | BPF_MOV(0xb0)with the K (immediate) source.
You do not have to memorize the table. You need exactly one reflex: any LDX opcode (0x61/0x69/0x71/0x79) is a load — a dereference. And a dereference is precisely what the OR_NULL rule forbids until you’ve checked for NULL.
The size suffix in *(u64 *) vs *(u32 *) is the size field: BPF_W = word/4 bytes, BPF_DW = double-word/8 bytes. That’s not noise — it echoes your C types directly. The key store is *(u32 *) because the map key is __u32 (4 bytes); the value deref is *(u64 *) because the value is __u64 (8 bytes). The widths in the log are your struct, reflected back.
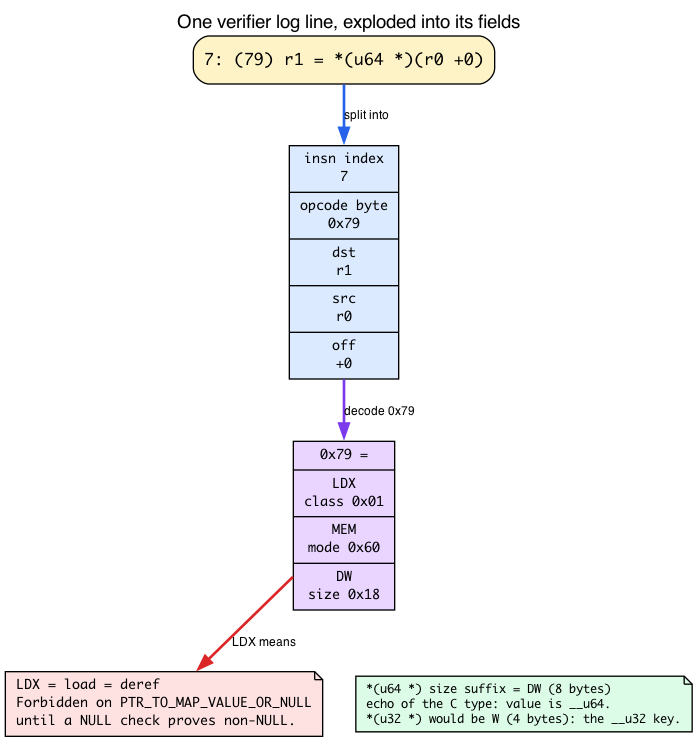
Practical reading rule: when a rejection names a register, scan the opcode column for the LDX/STX (0x6x/0x7x) instruction that touches it. In all five rejections today that instruction is the same: (79) r1 = *(u64 *)(r0 +0) — the single load through R0 that the missing check failed to protect.
How the Verifier walks your program
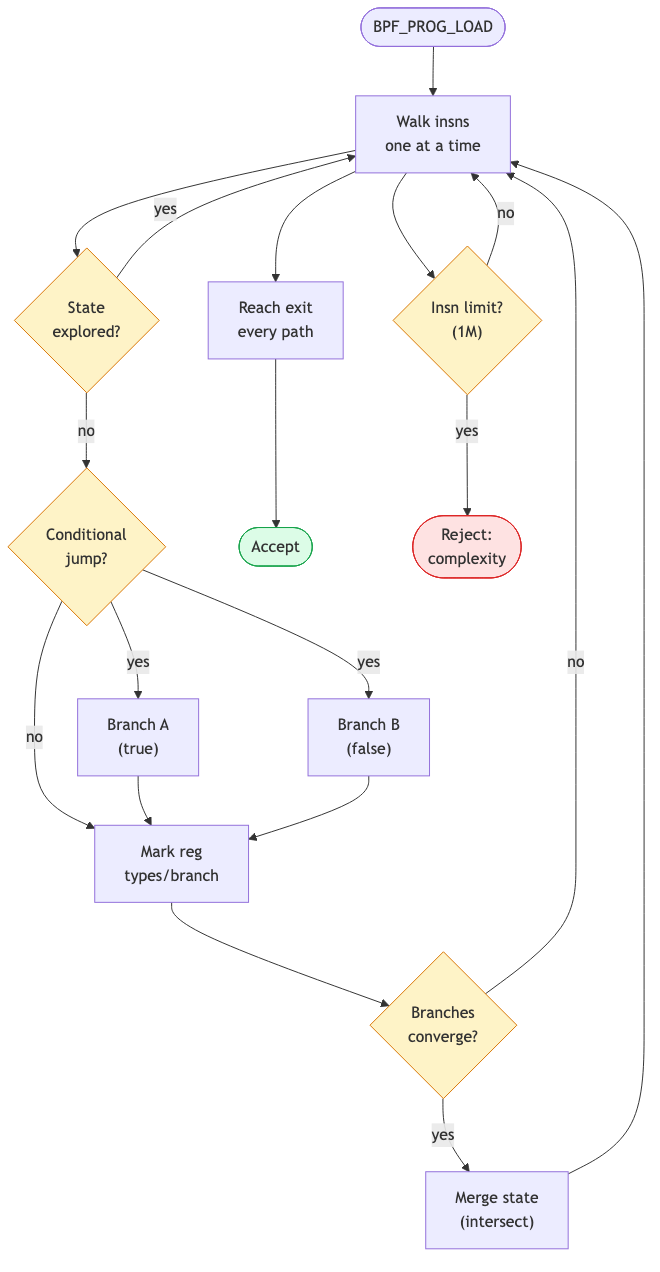
The Verifier starts at instruction 0 with default register state. For each instruction:
- It updates register types based on the operation (add, load, call, etc.).
- On conditional jumps, it forks: explores both branches with appropriate state (e.g., on
if (!r0), the false branch knowsr0 != 0; the true branch knowsr0 == 0). - When two branches reconverge, it merges register states (intersection).
- State pruning. If the current state is “compatible with” a previously-explored state at the same instruction, it stops — it already knows this leads to acceptance. (This is the verifier’s key efficiency trick — without it, branchy programs explode exponentially.)
- If it hits the complexity budget (1M instructions explored across all paths), it gives up:
BPF program is too large. - Every path must reach a
return/exit instruction safely.
Source: kernel/bpf/verifier.c. The function do_check is the main loop; bpf_is_state_visited (in kernel/bpf/states.c:1202, split out of verifier.c in the 2025 refactor) is the pruning check; mark_ptr_or_null_regs is what we’ll focus on today. The 1M budget is BPF_COMPLEXITY_LIMIT_INSNS (include/linux/bpf.h:2261 — #define BPF_COMPLEXITY_LIMIT_INSNS 1000000 /* yes. 1M insns */), checked against env->insn_processed in do_check (verifier.c:17705).
The state machine for bpf_map_lookup_elem’s return value
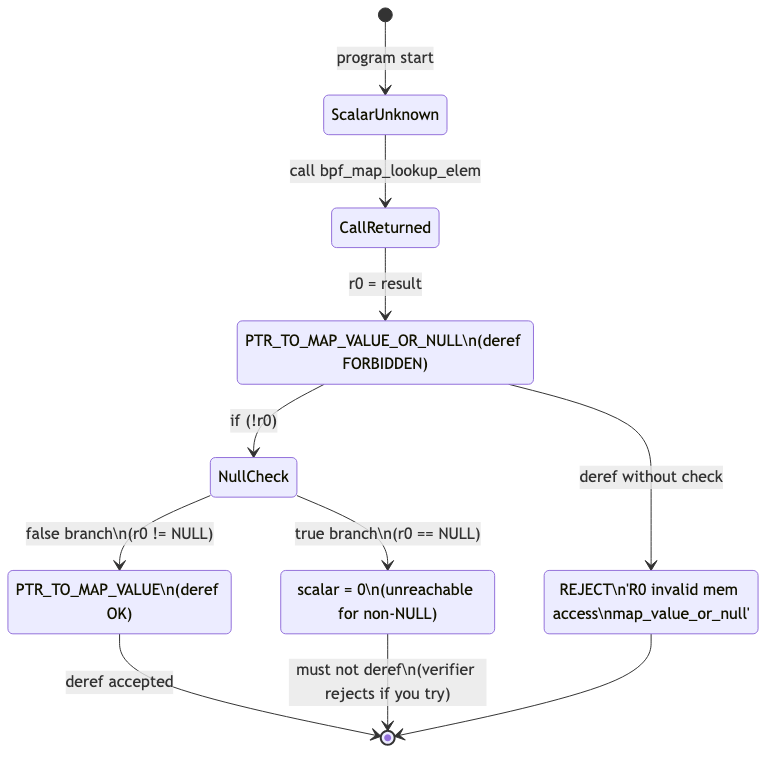
When you call bpf_map_lookup_elem, R0 is marked PTR_TO_MAP_VALUE_OR_NULL with an id attached. That id links the not-yet-resolved-NULL nature of this pointer across all flow paths (more on what kind of id, next). The Verifier treats:
PTR_TO_MAP_VALUE_OR_NULL— deref forbidden.PTR_TO_MAP_VALUE— deref OK, with bounds equal to the map’s value size.SCALAR_VALUE = 0— what the register becomes inside ther == 0branch.
The transition PTR_TO_MAP_VALUE_OR_NULL → PTR_TO_MAP_VALUE happens via mark_ptr_or_null_regs after a comparison against zero — but only on the branch where the comparison would prove non-NULL.
In v7.1 these types are just a base type OR’d with a “maybe NULL” flag (include/linux/bpf.h:1026-1034):
PTR_TO_MAP_VALUE_OR_NULL = PTR_MAYBE_NULL | PTR_TO_MAP_VALUE,
PTR_TO_SOCKET_OR_NULL    = PTR_MAYBE_NULL | PTR_TO_SOCKET,
PTR_TO_BTF_ID_OR_NULL    = PTR_MAYBE_NULL | PTR_TO_BTF_ID,
The helper that produces our OR_NULL says so in its prototype (kernel/bpf/helpers.c:54): bpf_map_lookup_elem_proto has .ret_type = RET_PTR_TO_MAP_VALUE_OR_NULL. That’s where R0’s type comes from — check_helper_call reads it off the proto.
Two different ids: nullness-linkage vs acquired reference
Here’s a subtlety that the logs blur together. A struct bpf_reg_state carries two distinct u32 fields (include/linux/bpf_verifier.h:155 and :195):
id— general linkage. Links registers that share a not-yet-resolved property, e.g. the same maybe-NULL-ness.ref_obj_id— a handle on an acquired reference that must be explicitly released before the program exits.
For bpf_map_lookup_elem, the OR_NULL pointer carries an id only. It is free — no release required — so a bare if (!v) return 0; fully discharges it. That’s why all of today’s labs need nothing but a NULL check. The number you read as id=2 in the log is this general linkage id.
That is the whole intuition you need for today. The rest of this section — how the release machinery works for the reference-bearing OR_NULL types — is an optional going-deeper aside. Today’s map-value labs never trigger it; you can skip to “The Lab” and come back when a later chapter rejects a socket or ringbuf program with an “Unreleased reference” error.
Going deeper (optional): how releases actually fire
Now look at what
mark_ptr_or_null_regsactually does (kernel/bpf/verifier.c:16060-16078):static void mark_ptr_or_null_regs(struct bpf_verifier_state *vstate, u32 regno, bool is_null) { struct bpf_func_state *state = vstate->frame[vstate->curframe]; struct bpf_reg_state *regs = state->regs, *reg; u32 ref_obj_id = regs[regno].ref_obj_id; u32 id = regs[regno].id; if (ref_obj_id && ref_obj_id == id && is_null) /* regs[regno] is in the " == NULL" branch. */ WARN_ON_ONCE(release_reference_nomark(vstate, id)); bpf_for_each_reg_in_vstate(vstate, state, reg, ({ mark_ptr_or_null_reg(state, reg, id, is_null); })); }It consults both fields. The
bpf_for_each_reg_in_vstateloop walks every register sharing the comparison’sidand flips its type on each branch — that’s the universal part. But theifabove it checksref_obj_id: if the OR_NULL register held a real acquired reference and we just proved it NULL, it releases that reference. Map-value-or-null never minted aref_obj_id(its proto doesn’t acquire), so that branch is skipped.This sharpens the chapter’s later “all OR_NULL types follow the same pattern” claim. The NULL-check transition is universal. But only the reference-bearing OR_NULL types carry a
ref_obj_idyou must additionally resolve:
Type idref_obj_idObligation PTR_TO_MAP_VALUE_OR_NULLset 0 check discharges it; return-on-NULL is free PTR_TO_SOCKET_OR_NULLset set must release, or “Unreleased reference” PTR_TO_MEM | PTR_MAYBE_NULL(ringbuf reserve)set set must submit/discard, or “Unreleased reference” So if a future chapter shows you a
bpf_ringbuf_reserveor socket lookup that loads clean but still gets rejected with an unreleased-reference error, that’s theref_obj_idtalking — same number space in the log, completely different obligation. Today’s map-value labs never hit it.
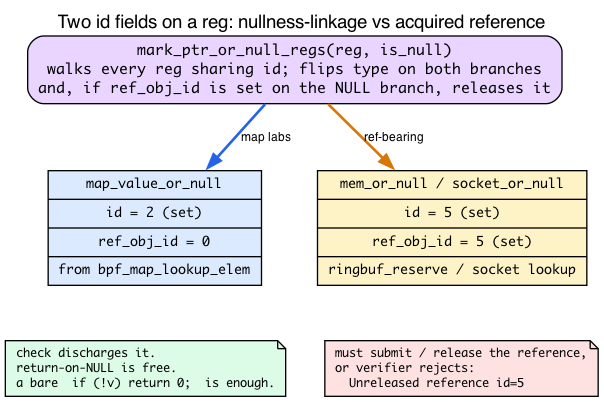
There are no Dumb Questions
Q: Why does the verifier need an “id” on the pointer? Isn’t the type enough?
A: The id links multiple registers that share the same not-yet-resolved-NULL state. If you copy
r0tor6before checking, then checkr0, the Verifier needs to knowr6’s NULL-ness was resolved too. The id is howbpf_for_each_reg_in_vstatefinds every register to flip. (For map values this is the linkageid; reference-bearing types additionally carry aref_obj_id— see above.)Q: What if I check
r0 != NULLinstead of!r0?A: Same effect. The Verifier tracks the comparison and applies the
OR_NULL → not-OR-NULLtransition on the branch that proves non-NULL, regardless of which boolean form you used.Q: Is
PTR_TO_MAP_VALUE_OR_NULLthe only “OR_NULL” type?A: No — there are several.
PTR_TO_SOCKET_OR_NULL,PTR_TO_SOCK_COMMON_OR_NULL,PTR_TO_TCP_SOCK_OR_NULL, andPTR_TO_BTF_ID_OR_NULL(some kfuncs) are all explicit register types inenum bpf_reg_type(include/linux/bpf.h:1026-1034). Ringbuf-reserve memory is OR_NULL too, but at the helper-prototype level (RET_PTR_TO_RINGBUF_MEM_OR_NULL,include/linux/bpf.h:908) — there is noPTR_TO_MEM_OR_NULLregister type, justPTR_TO_MEM | PTR_MAYBE_NULL. They all follow the same NULL-check pattern: deref forbidden until proven non-NULL via a check. The reference-bearing ones (socket, ringbuf mem) also require you to release the reference — the deref rule is shared, the release obligation is not. (Packet pointers are not in this family:skb->datais neverOR_NULL; its bounds are proven by comparing againstPTR_TO_PACKET_ENDviafind_good_pkt_pointers, a different mechanism — there is noPTR_TO_PACKET_OR_NULLtype.)
The Lab: five rejections in five shapes
You don’t need a working program today. You need a single source file you mutate and reload.
Setup
Use any of yesterday’s programs as the base. We’ll mutate it in place.
reject.bpf.c — the base that loads clean, straight from the lab tree:
#include "vmlinux.h"
#include <bpf/bpf_helpers.h>
#include <bpf/bpf_tracing.h>

char LICENSE[] SEC("license") = "GPL";

struct {
    __uint(type, BPF_MAP_TYPE_HASH);
    __uint(max_entries, 1024);
    __type(key, __u32);
    __type(value, __u64);
} m SEC(".maps");

SEC("fentry/filename_unlinkat")
int BPF_PROG(rej)
{
    __u32 key = 0;
    /* WE WILL EDIT THE BODY BELOW FIVE TIMES */
    __u64 *v = bpf_map_lookup_elem(&m, &key);
    if (!v) return 0;
    *v += 1;
    return 0;
}
Build it once. It loads. Now break it five ways and read the log each time.
Set verbose loading in your reject.c:
LIBBPF_OPTS(bpf_object_open_opts, opts, .kernel_log_level = 1);
struct reject_bpf *skel = reject_bpf__open_opts(&opts);
if (reject_bpf__load(skel)) {
    fprintf(stderr, "load failed (this is expected)\n");
    return 1;
}
Or load with bpftool prog load reject.bpf.o /sys/fs/bpf/x and the log goes to stderr.
A successful load pins the program at
/sys/fs/bpf/x. Rejected loads don’t pin, but the ones that load clean (the base program, Rejection 5’s first snippet, Rejection 3 with a compile-time-constant key) do — so the next successful load to the same path fails withError: failed to pin program: File exists, which is not a verifier problem. Remove the pin before re-loading:sudo rm -f /sys/fs/bpf/x.
Rejection 1 — The bare deref
__u64 *v = bpf_map_lookup_elem(&m, &key);
*v += 1;       // no null check
return 0;
Expected log (essence):
0: (b7) r1 = 0           ; key = 0
1: (63) *(u32 *)(r10-4) = r1
2: (bf) r2 = r10
3: (07) r2 += -4
4: (18) r1 = 0xffff...   ; map fd
6: (85) call bpf_map_lookup_elem#1
7: R0=map_value_or_null(id=2,off=0,ks=4,vs=8) R10=fp0
7: (79) r1 = *(u64 *)(r0 +0)
R0 invalid mem access 'map_value_or_null'

processed 8 insns ...
How to read this — and now you can read every token:
- Lines 0–6 are the instruction trace, and you can decode each opcode:
(b7)MOV-imm setskey = 0;(63)STX-word stores it to the stack slotr10-4(that’s the&keyyou’ll pass);(bf)MOV-reg copies the frame pointerr2 = r10;(07)ADD-imm doesr2 += -4so R2 now holds&key;(18)LD-imm-dw loads the map address into R1;(85)CALL invokesbpf_map_lookup_elem. The calling convention is right there: key in R2, map in R1, result in R0. - Line 7 shows register state right after the call:
R0ismap_value_or_nullwithid=2(the linkage id —ref_obj_idis 0, unprinted), offset 0, key size 4 (ks=4, fromverbose_a("ks=%d,vs=%d", ...)atkernel/bpf/log.c:675), value size 8 (vs=8).R10=fp0just means R10 is the frame pointer at offset 0 — read-only, as always. - The next line is
(79)— LDX-dw, a load through R0. That’s the dereference. R0 is stillmap_value_or_null. Forbidden. - The violation line:
R0 invalid mem access 'map_value_or_null', emitted byverbose(env, "R%d invalid mem access '%s'\n", ...)atkernel/bpf/verifier.c:6408(and a twin at:6565). It names the register (R0) and the type that failed (map_value_or_null).
The Verifier did exactly what the diagram showed. You skipped the mark_ptr_or_null_regs transition. Fix: add if (!v) return 0;.
Rejection 2 — Deref before check
__u64 *v = bpf_map_lookup_elem(&m, &key);
*v += 1;       // deref before check
if (!v) return 0;
Same log as Rejection 1. The Verifier walks instructions in order; the late check doesn’t help the early deref. The (79) load still executes while R0 is map_value_or_null. Lesson: the null check must be before the deref. Compiler-style “this branch makes the early line unreachable” doesn’t apply — the Verifier evaluates instructions in program order.
Rejection 3 — Conditional null check (verifier path tracking)
__u64 *v = bpf_map_lookup_elem(&m, &key);
if (key == 0) {
    if (!v) return 0;
}
*v += 1;       // is v guaranteed non-NULL here?
(For this to demonstrate anything, key must be runtime-unknown — change the base to __u32 key = bpf_get_current_pid_tgid();. If key were the compile-time 0 from the setup, Clang would constant-fold if (key == 0) to always-true and the program could actually load.)
Verifier rejects. Why? Inside if (key == 0), you proved v non-NULL. But the Verifier explores both branches:
key == 0branch:vis checked, then*v += 1runs withvproven non-NULL. OK.key != 0branch: skips the innerif, falls through to*v += 1.vis stillmap_value_or_null. Reject.
The error message points at the deref instruction, with state showing R0 is still or-null:
N: R0=map_value_or_null(id=2,off=0,ks=4,vs=8) ...
N: (79) r1 = *(u64 *)(r0 +0)
R0 invalid mem access 'map_value_or_null'
The failing instruction number N is higher than Rejection 1 (the extra if (key == 0) branch adds instructions), but the violation line is identical: on the key != 0 fall-through path R0 never made the OR_NULL → MAP_VALUE transition. (Exact instruction numbers and the id= value vary by kernel version and path.) The Verifier is right — your code is buggy. Fix:
if (!v) return 0;
*v += 1;
Or check unconditionally before deref. Always make the check dominate the use.
Rejection 4 — Reset id by reassignment
__u64 *v = bpf_map_lookup_elem(&m, &key);
if (!v) return 0;
v = bpf_map_lookup_elem(&m, &key);  // re-lookup
*v += 1;                             // does the second result need a new check?
Yes. Each call to bpf_map_lookup_elem returns a fresh PTR_TO_MAP_VALUE_OR_NULL with a new id. The first check resolved the first lookup. The second lookup is unrelated. Verifier rejects the deref of the second result:
N: R0=map_value_or_null(id=3,off=0,ks=4,vs=8) ...   ; note id=3 — a NEW id
N: (79) r1 = *(u64 *)(r0 +0)
R0 invalid mem access 'map_value_or_null'
Compare the id= to Rejection 1’s id=2: the second bpf_map_lookup_elem minted a brand-new linkage id the first if (!v) never resolved, and it fails at a higher instruction number than Rejection 1’s deref. That fresh id is the concrete signal of “new check needed per call.” Remember from the register-file section: the first check flipped every register sharing id=2; nothing was sharing the new id=3. (Exact id values and instruction numbers vary by kernel version.)
Lesson: null state is per-call, not per-variable name. Re-check after every lookup, even if you wrote the same code.
Rejection 5 — Loop and lose track
__u64 *v;
for (int i = 0; i < 3; i++) {
    v = bpf_map_lookup_elem(&m, &key);
    if (!v) continue;
    *v += 1;
}
return 0;
This loads on a modern verifier: v is assigned once per iteration, and every iteration continues past the deref when v is NULL, so the single check dominates the loop body. Now move the guard so each iteration mints a fresh OR_NULL that a once-only check can’t cover:
__u64 *v;
for (int i = 0; i < 3; i++) {
    v = bpf_map_lookup_elem(&m, &key);  // fresh OR_NULL each iteration
    if (i == 0 && !v) return 0;         // only checked on iteration 0
    *v += 1;                            // iterations 1, 2: v unchecked
}
return 0;
This is rejected. The if (i == 0 && !v) guard only covers the first iteration; on iterations 1 and 2 the re-lookup hands back a fresh PTR_TO_MAP_VALUE_OR_NULL that nothing checked before *v += 1:
N: R0=map_value_or_null(id=N,off=0,ks=4,vs=8) ...
N: (79) r1 = *(u64 *)(r0 +0)
R0 invalid mem access 'map_value_or_null'
Contrast the two snippets: the first loads because v is checked-then-used with no skipped check, so the check dominates every unrolled iteration; the second rejects because the per-iteration re-lookup creates an unchecked OR_NULL on the i > 0 paths. (Exact instruction numbers and id= values vary by kernel version.)
Lesson: the check must dominate the use on every execution path. Loops, branches, retries — all paths.
How to read a verifier log fast
Verbose logs look intimidating. They’re really three things stacked:
- Instruction trace. Each line shows one BPF instruction in pseudo-assembly:
index: (opcode) spelling. You now know the opcode bytes — scan the(xx)column for an LDX/STX (0x6x/0x7x) to find the loads and stores. - Register state. After interesting instructions (calls, jumps, exits) the Verifier prints the per-register table:
R0,R1, …R10. Recall the calling convention from “The eleven registers” above — R0 returns, R1–R5 are clobbered scratch, R6–R9 survive calls, R10 is the read-only frame pointer. - Final error. A one-line rejection naming the offending register, type, and offending instruction.
Tactics:
- Search the log for “R0 invalid” or “R0 type=”. That’s where the violation is.
- Walk backward from there a few instructions to see what the Verifier knew — find the
(85) callthat produced the OR_NULL, and check whether a NULL-comparison jump appears between it and the failing(79)load. - The instruction numbers match
llvm-objdump-21 -doutput of your.bpf.o— you can correlate to source if you compile with-g.
The full log goes to kern_log if your loader doesn’t capture it; sudo dmesg | tail -200 after a load failure usually has it (reading the kernel buffer needs root when kernel.dmesg_restrict=1, which is the default on this box).
What to read in the kernel
include/uapi/linux/bpf.h— the register enum (BPF_REG_0 .. BPF_REG_10, lines 62-78) and the opcode constants (BPF_ALU64,BPF_MOV,BPF_DW,BPF_CALL). The instruction classes and modes live ininclude/uapi/linux/bpf_common.h. Skim both once so the(79)/(85)notation stops being opaque.kernel/bpf/verifier.c:do_check— the main loop. Don’t read it all; just see the structure and theBPF_COMPLEXITY_LIMIT_INSNScheck (:17705).mark_ptr_or_null_regs(:16060) — ~20 lines. The function that flipsOR_NULLtypes after a comparison, and (for reference-bearing types) releases theref_obj_id.check_helper_call— how the Verifier knows what type a helper returns. The metadata comes from each helper’sbpf_func_proto(e.g.bpf_map_lookup_elem_protoinkernel/bpf/helpers.c:50).
include/linux/bpf.h— seeenum bpf_reg_typenearPTR_TO_MAP_VALUE_OR_NULL(:1026). Read the comment. This is the canonical list of register types — bookmark it.MAX_BPF_STACK = 512is ininclude/linux/filter.h:98.include/linux/bpf_verifier.h—struct bpf_reg_state, in particularu32 id(:155) andu32 ref_obj_id(:195). The two-id distinction lives here.tools/testing/selftests/bpf/progs/verifier_map_ret_val.c— each test is a 3-line program intended to be rejected, with the expected error embedded. Line 39 has__failure __msg("R0 invalid mem access 'map_value_or_null'")— the exact rejection you produced today.
Today’s experiment
Beyond mutating reject.bpf.c five times, watch the real opcodes:
# Disassemble your compiled object and find the (79) load:
# (the binary is versioned — use the one matching your clang toolchain)
llvm-objdump-21 -d reject.bpf.o
The byte columns there match the (xx) in the verifier log one-to-one. Find the LDX double-word load and confirm it’s the instruction the rejection names. Then add if (!v) return 0;, recompile, and watch that the load now appears after a (15)/(55) JEQ/JNE-against-zero jump — the comparison that lets mark_ptr_or_null_regs flip R0 before the deref.
Bullet Points
- BPF has exactly eleven registers, R0–R10, and the Verifier tracks a
bpf_reg_statefor each. R0 = return value, R1–R5 = args/scratch (clobbered by calls), R6–R9 = callee-saved, R10 = read-only frame pointer over a 512-byte stack. - A verifier log line is
index: (opcode) spelling. The(xx)is the raw opcode byte; LDX opcodes (0x6x/0x7x) are loads = dereferences, exactly what OR_NULL forbids. The*(u64*)/*(u32*)width echoes your C types. - The Verifier walks every path of your program with abstract interpretation.
- Every register has a type (e.g.,
SCALAR_VALUE,PTR_TO_MAP_VALUE_OR_NULL,PTR_TO_BTF_ID). PTR_TO_MAP_VALUE_OR_NULLcannot be dereferenced until a NULL check transitions it toPTR_TO_MAP_VALUEviamark_ptr_or_null_regs.- A reg carries two ids:
id(nullness linkage, what map-value uses — free to discharge) andref_obj_id(an acquired reference you must release, used by socket/mem-or-null). A bareif (!v) return 0;fully discharges a map value. - Each
bpf_map_lookup_elemcall returns a fresh OR_NULL with a newid— re-check every time. - Null check must dominate every dereference path — branches, loops, retries.
- Verifier log = instruction trace + register state + final error. Search the log for “invalid mem access” to land on the violation.
- All these rules apply to every OR_NULL type: socket-or-null, sock-common-or-null, tcp-sock-or-null, ringbuf-mem-or-null, btf-id-or-null, etc. The deref rule is shared; reference-bearing types additionally demand a release. (Packet pointers are not OR_NULL — they’re range-checked against
PTR_TO_PACKET_ENDinstead.) - The Verifier’s complexity budget is 1M instructions explored (
BPF_COMPLEXITY_LIMIT_INSNS). Hit it and you get “BPF program is too large.” (Day 5 covers this.)
Check question
The Verifier’s mark_ptr_or_null_regs runs after each conditional jump that compares an OR_NULL register against zero. Why does it have to run on both branches, not just the “non-NULL” one?
Click to reveal answer
Answer: Because the “NULL branch” needs the register marked as scalar zero — otherwise the Verifier wouldn’t know that subsequent code on that branch dealing with the register knows it’s NULL. Concretely, on the NULL branch, the Verifier wants to allow you to e.g. do return 0 (which doesn’t touch the pointer), or even further conditional logic that depends on having proved NULLness. And for reference-bearing OR_NULL types, the NULL branch is exactly where the acquired ref_obj_id gets released (the if (ref_obj_id && ref_obj_id == id && is_null) arm). Both transitions matter; the function name says “regs” plural because bpf_for_each_reg_in_vstate marks every register sharing the id, on both branches.
Tomorrow
Day 5: bounded loops. The verifier’s other big “I can’t prove this terminates” rejection. We meet bpf_loop, #pragma unroll, and the path-explosion problem (where the 1M BPF_COMPLEXITY_LIMIT_INSNS budget bites and you get “BPF program is too large”). End of phase 1: workflow + verifier intuition. Phase 2 (tracing specialization) starts Day 6.
Day 5 — Bounded loops, bpf_loop, and the path-explosion problem
Today’s mission: understand why “infinite loop” rejection is really “I can’t prove this terminates,” learn what the Verifier actually tracks about a loop counter, and learn the four ways to write loops it accepts (plus iterators, a loop-shaped bonus). End of phase 1. Total time: ~110 minutes.
“I’m just doing a for loop, why is it complaining?”
The Verifier’s contract is every BPF program must terminate within a bounded number of instructions. The reason is operational, not philosophical: BPF runs in kernel contexts where preemption may be disabled, IRQs may be off, scheduling may not happen. A loop that runs forever in such a context wedges the kernel — there is no watchdog that can yank you out. So the Verifier statically refuses any program where it can’t prove termination.
That’s the why. The how has three moving parts that the rest of this chapter leans on constantly, so we build all three before we touch a single loop:
- A numeric range for every register — the abstract domain the Verifier uses to prove a counter reaches its exit. (New today.)
- The control-flow-graph pass — a separate stage that finds the back-edge (the loop) before the main walk even starts. (New today.)
- More than one complexity ceiling — Day 4 taught you the 1M instruction budget; there is a second, smaller cap that branchy loops hit first. (New today.)
Day 4 introduced the Verifier as abstract interpretation: it walks the program symbolically, and every register carries a type and a reference id. Today is about the part Day 4 only named in passing as “bounds” — the numeric part of that same register state. Loops are where it earns its keep.
What the Verifier knows about a number
Here is the single idea the whole chapter hinges on, and most tutorials never state it:
For every register holding a
SCALAR_VALUE, the Verifier does not track the value. It tracks a range of possible values — a little box the true value is guaranteed to live inside. Loop termination is proved by watching that box shrink toward the exit condition, not by reading your C source.
Concretely, each scalar register carries five things at once (include/linux/bpf_verifier.h):
struct tnum var_off;        /* line 117 — known-bits mask */
s64 smin_value;             /* line 123 — minimum possible (s64)value */
s64 smax_value;             /* line 124 — maximum possible (s64)value */
u64 umin_value;             /* line 125 — minimum possible (u64)value */
u64 umax_value;             /* line 126 — maximum possible (u64)value */
s32 s32_min_value;          /* line 127 — 32-bit sub-register bounds, too */
Two complementary representations of “what could this number be”:
- The interval — four bounds, signed and unsigned:
smin/smaxandumin/umax. “This register is somewhere in[umin_value, umax_value].” A brand-new unknown scalar (say, the return ofbpf_get_prandom_u32()) starts at the widest possible box:umin=0, umax=U64_MAX. The Verifier knows nothing, so the box is everything. - The tnum (
var_off) — a known-bits mask. For each bit position it records “this bit is definitely 0,” “definitely 1,” or “unknown.” It captures facts the interval can’t, like “the low 7 bits are unknown but every higher bit is zero” — which is exactly what a bitmask operation produces.
Every operation on a register updates both. Add a constant, the interval slides. Mask with & 0x7f, the tnum’s high bits snap to known-zero. Compare in a branch, each side of the branch narrows the box. The Verifier propagates these forward instruction by instruction — this is the “abstract interpretation” from Day 4, made numeric.
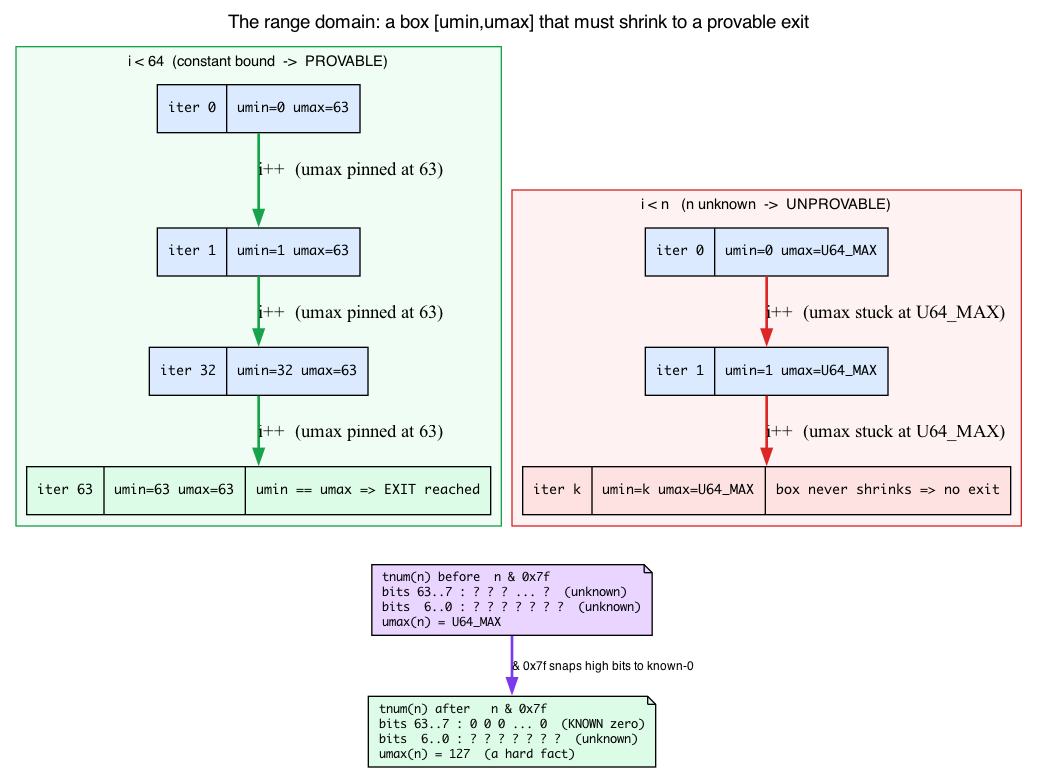
Why this is the whole game for loops
A loop is a back-edge: a jump to an earlier instruction. To accept it, the Verifier must prove the back-edge eventually stops being taken. It does this with the range domain:
-
for (i = 0; i < 64; i++)— the comparisoni < 64is a hard fact the Verifier folds straight intoi’s box: on the loop-body side,umax_value(i)becomes63. Every iteration adds 1, the box marches upward, and becauseumaxis pinned at 63 the Verifier can prove the exit is reached. Termination provable. The bound64is independent of anything else in the program. -
for (i = 0; i < n; i++)wherenis an unknown scalar —n’s box is[0, U64_MAX], soi < ntells the Verifier only thati < U64_MAX. That leavesumax_value(i)atU64_MAX. The box never shrinks to a provable exit. Termination unprovable — and that is the reason this is rejected, not some surface-level “n looks variable” heuristic.
This is why answer 3 of the quiz below works: i < n && i < 64 keeps the unbounded n and adds the static i < 64. The 64 caps umax_value(i) regardless of n, so the box shrinks and the loop is provable. The “min trick” is literally “give the range tracker a constant ceiling it can use.”
How the Verifier handles loops: the CFG pass and back-edges
Before the main per-instruction walk even begins, the Verifier runs a separate pass that builds a control-flow graph (CFG) of your program and classifies every jump. This is bpf_check_cfg, invoked as its own stage:
/* kernel/bpf/verifier.c:20033 */
ret = bpf_check_cfg(env);
A CFG is just instructions as nodes and jumps as edges. The pass does a depth-first walk and labels each edge. The one that matters today is the back-edge: a jump to an instruction the DFS has already entered but not yet finished — which is precisely the definition of a loop. When the pass finds one it can’t allow, it says so by line and instruction number:
/* kernel/bpf/cfg.c:138 */
verbose(env, "back-edge from insn %d to %d\n", t, w);
On old or unprivileged paths, a back-edge here is a hard rejection — the Verifier predates bounded-loop support and simply refuses any loop. On modern bounded-loop kernels (5.3+) the back-edge is allowed at this stage, and the question “does it terminate?” is deferred to the range tracking we just built. So the CFG pass is where the Verifier discovers the loop; the range domain is where it judges the loop.
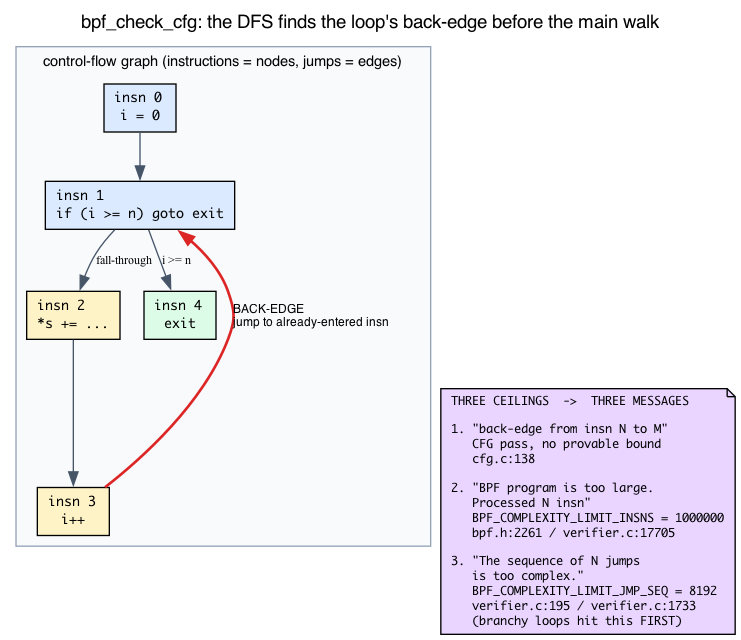
Three ceilings, three different rejection messages
Day 4 taught you the 1-million-instruction budget. That is not the only ceiling, and that is why the failures in this chapter don’t all say the same thing. There are three, and learning to map a message to its cause is half of reading verifier logs:
| Rejection message | Triggered by | Kernel constant |
|---|---|---|
back-edge from insn N to M | CFG pass: a loop with no provable bound (or an unprivileged/old path) | cfg.c:138 |
BPF program is too large. Processed N insn | the insns-processed budget: a genuinely unbounded loop explored to exhaustion | BPF_COMPLEXITY_LIMIT_INSNS = 1000000 (include/linux/bpf.h:2261) |
The sequence of N jumps is too complex. | the explore-stack depth cap: a branchy-but-bounded loop whose path count overflows the DFS stack | BPF_COMPLEXITY_LIMIT_JMP_SEQ = 8192 (verifier.c:195) |
The third one is the surprise. The insns budget counts how many instructions the Verifier has processed across all paths:
/* kernel/bpf/verifier.c:17705 */
if (++env->insn_processed > BPF_COMPLEXITY_LIMIT_INSNS) {
        verbose(env, ...
                "BPF program is too large. Processed %d insn\n", ...
Separately, the depth of the explore stack — how many pending branch-points the DFS is juggling — is capped much lower:
/* kernel/bpf/verifier.c:1733 */
if (env->stack_size > BPF_COMPLEXITY_LIMIT_JMP_SEQ) {
        verbose(env, "The sequence of %d jumps is too complex.\n", ...
A branchy loop overflows the 8192 jump-sequence stack first, long before it ever processes a million instructions — which is exactly the stress-test result you’ll see later at ~114K insns, well under 1M. When the chapter says “not the message you might expect,” this table is the answer.
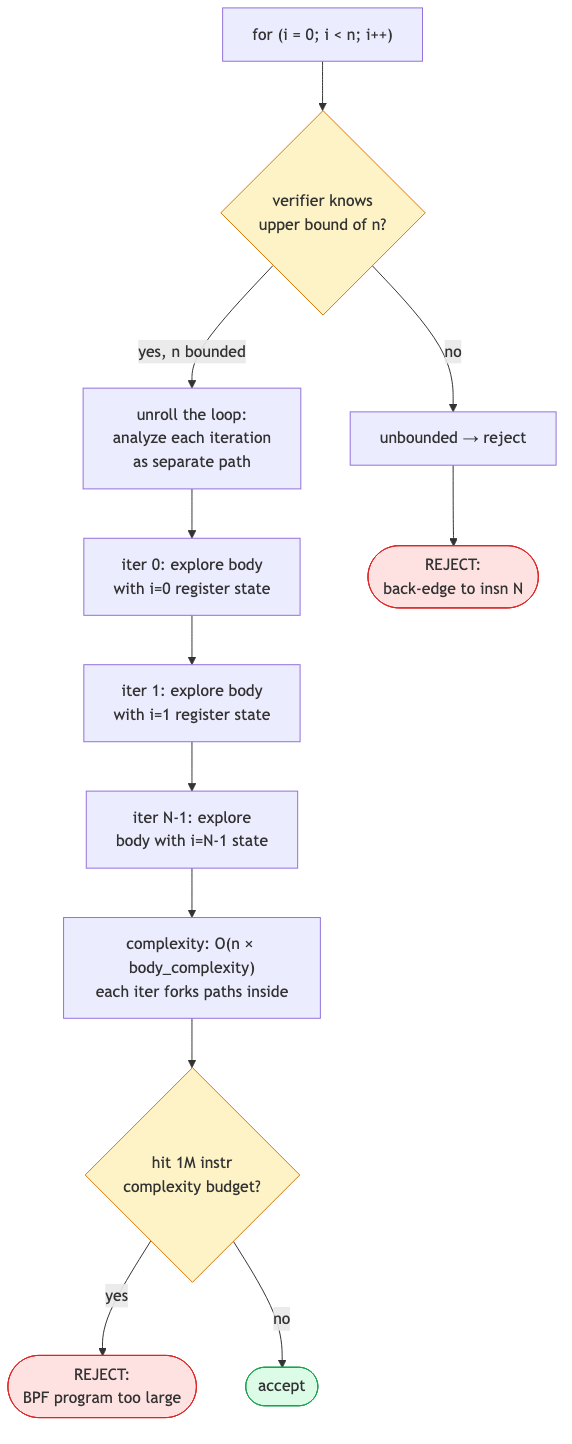
So the loop story end-to-end: the CFG pass (1) finds the back-edge, range tracking (2) tries to prove the counter’s box reaches the exit, and the two budgets (3) cap how much exploring that proof is allowed to cost.
There are no Dumb Questions
Q: 1M instructions sounds like a lot. How do programs actually hit it?
A: The 1M is paths explored across all branches, not instructions executed at runtime. A 100-iteration loop with 5 branches in the body explodes to ≈100×2⁵ = 3200 paths, each with maybe 50 instructions, that’s 160K — a lot already. Add nested loops or longer bodies and you breach 1M. The Verifier prunes aggressively but path-explosion is real.
Q: Why does state pruning sometimes work and sometimes not?
A: State pruning compares register states between two visits to the same instruction. If state A is “weaker than or equal to” state B (every register in A has a wider type than B), B can be pruned: anything safe in A is safe in B. The trick is that scalar values often narrow (the loop counter goes up by 1), making each iteration’s state strictly different from the prior one. Modern verifiers use scalar widening tricks to coerce many iterations into one merged state. See the
liveness.candstates.cfiles added in 2025–2026. (“Narrows” here means exactly the range domain above: each iteration’s[umin,umax]for the counter is a different box, so the states don’t match unless the Verifier deliberately widens them back together.)Q: I see
#pragma unrollin old tutorials. Should I use it?A: Sometimes.
#pragma unrolltells Clang to expand a loop at compile time. The Verifier then sees a straight-line program with no back-edge — definitely terminates. Works for small fixed counts. Doesn’t scale: unrolling 1000 iterations produces 1000× the code, blowing past instruction limits. Usebpf_loopfor non-trivial counts.
Sharpen your pencil
Predict which of these the Verifier accepts.
for (int i = 0; i < 10; i++) sum += i;for (int i = 0; i < n; i++) sum += i;(wherenis frombpf_get_prandom_u32())for (int i = 0; i < n && i < 100; i++) sum += i;(samen)int i = 0; while (1) { if (i >= 10) break; sum += i; i++; }.
.
.Answers: 1 ✓ (constant bound —
umax(i)pinned at 9, box shrinks, easy unroll). 2 ✗ (“infinite loop” —n’s box is[0,U64_MAX], soumax(i)staysU64_MAXand termination is unprovable). 3 ✓ (thei < 100is the static-cap trick from the range section — it capsumax(i)at 99 regardless ofn). 4 ✓ (functionally identical to 1 — theif (i >= 10) breakgives the range tracker the sameumax(i) <= 9fact).
Meet the four ways to loop
1. Constant-bound for (default first choice)
for (int i = 0; i < 16; i++)
    process(i);
The Verifier unrolls; works for small bounds. The constant 16 caps umax_value(i) immediately, so the back-edge is provable. Default first choice when the count is small (≤ ~64).
2. Variable-bound with a static cap (the “min” trick)
for (int i = 0; i < n && i < 64; i++)
    process(i);
Even when n is dynamic, the i < 64 clause pins umax_value(i) at 63 — a hard fact independent of n. The Verifier’s range box shrinks each iteration, so it accepts. Useful when n is “the smaller of: a parsed length, or our buffer size.”
3. #pragma unroll (deprecated for non-trivial counts)
#pragma unroll
for (int i = 0; i < 8; i++)
    out[i] = in[i] ^ 0xff;
Compiles to a straight-line sequence — no back-edge, so the CFG pass never even sees a loop, and the range tracker has nothing to prove. Fine for tiny counts. Bad for anything ≥ ~64 because it bloats program size.
4. bpf_loop (the modern answer for any non-trivial count)
static int my_cb(__u32 i, void *ctx) {
    /* ... */
    return 0;   /* return 1 to break early */
}

bpf_loop(1000000, my_cb, &ctx_struct, 0);
The Verifier verifies the callback once as a single iteration. Then it treats bpf_loop as a black-box helper that runs your verified callback up to N times. Complexity is independent of N.
This is the breakthrough that came in kernel 5.17 (commit e6f2dd0f8067 — “bpf: Add bpf_loop helper”). Before it, you were stuck unrolling. After, loops in BPF feel like loops in real C. But it has its own model, and it’s worth understanding why it works — that’s the next section.
What a BPF callback actually is
The exact line numbers below track the 7.1 tree; the symbol names (
bpf_loop_proto,set_loop_callback_state, theARG_*type tags) are the stable anchors to grep for on any kernel.
bpf_loop does something almost no other BPF program does: it takes a function pointer as an argument. To handle that, the Verifier has a dedicated argument type, and you can see it right in the helper’s prototype (kernel/bpf/bpf_iter.c:753-761; the two arg-types quoted below are at :758-759):
const struct bpf_func_proto bpf_loop_proto = {
    ...
    .arg2_type  = ARG_PTR_TO_FUNC,            /* the callback function */
    .arg3_type  = ARG_PTR_TO_STACK_OR_NULL,   /* the ctx — must be stack */
    ...
};
Two things to unpack here, and they explain the entire lab.
ARG_PTR_TO_FUNC — verify the callee once, as one generic iteration. When the Verifier sees the function-pointer argument, it treats your callback as a separate subprogram and walks it symbolically one time, with the index i modeled as a fully unknown scalar — set_loop_callback_state (verifier.c:9661) just marks R1 as a bare SCALAR_VALUE, leaving its range at the widest [0, U64_MAX] box. It is not narrowed to [0, nr_loops); the Verifier deliberately treats the index as completely opaque so that one symbolic walk covers every iteration regardless of nr_loops. It does not stamp out N copies of the body. That single symbolic walk is the whole reason cost is independent of N. The machinery that sets this up has a name:
/* kernel/bpf/verifier.c:9661 */
static int set_loop_callback_state(struct bpf_verifier_env *env, ...
invoked at verifier.c:10447 when the Verifier processes the bpf_loop call.
The callback contract is enforced, not advisory. Your callback must return 0 (continue) or 1 (stop). At the callback’s return point the Verifier applies the same range machinery from the start of this chapter, demanding R0 (the return register) lie in [0, 1]:
/* kernel/bpf/verifier.c:9896 */
"At callback return", "R0"
and the out-of-range complaint itself is the generic range message:
/* kernel/bpf/verifier.c:303 */
verbose(env, " should have been in [%d, %d]\n", range.minval, range.maxval);
This is the bridge that ties the chapter together: the scalar range domain you learned for proving loop termination is the exact same mechanism that checks a callback’s return value. “Bounded” and “in the allowed range” are different questions, and Break 4 below trips precisely on this.
Why the ctx must be stack memory. The 3rd argument is ARG_PTR_TO_STACK_OR_NULL — it must point at stack memory (fp = frame pointer). Hand it a raw PTR_TO_MAP_VALUE (a pointer into a map, like the one bpf_map_lookup_elem returns) and the Verifier rejects it:
R3 type=map_value expected=fp
That’s why the lab wraps its map pointer in a tiny stack struct and passes that struct’s address — it launders the map pointer through a stack slot to satisfy ARG_PTR_TO_STACK_OR_NULL. The wrapper isn’t a style choice; it’s the contract.
The runtime side is mundane. All the cleverness is on the verification side. At runtime, bpf_loop is an ordinary C for loop in the kernel (kernel/bpf/bpf_iter.c:743-751):
for (i = 0; i < nr_loops; i++) {
        ret = callback((u64)i, (u64)(long)callback_ctx, 0, 0, 0);
        /* return value: 0 - continue, 1 - stop and return */
        if (ret)
                return i + 1;
}
It calls your callback up to nr_loops times and stops early on a non-zero return. There is a runtime ceiling, too: nr_loops > BPF_MAX_LOOPS returns -E2BIG (bpf_iter.c:740-741), where BPF_MAX_LOOPS = 8 * 1024 * 1024 (include/linux/bpf.h:2268). So the “magic” is verify-once on the Verifier side; execution is a plain loop.
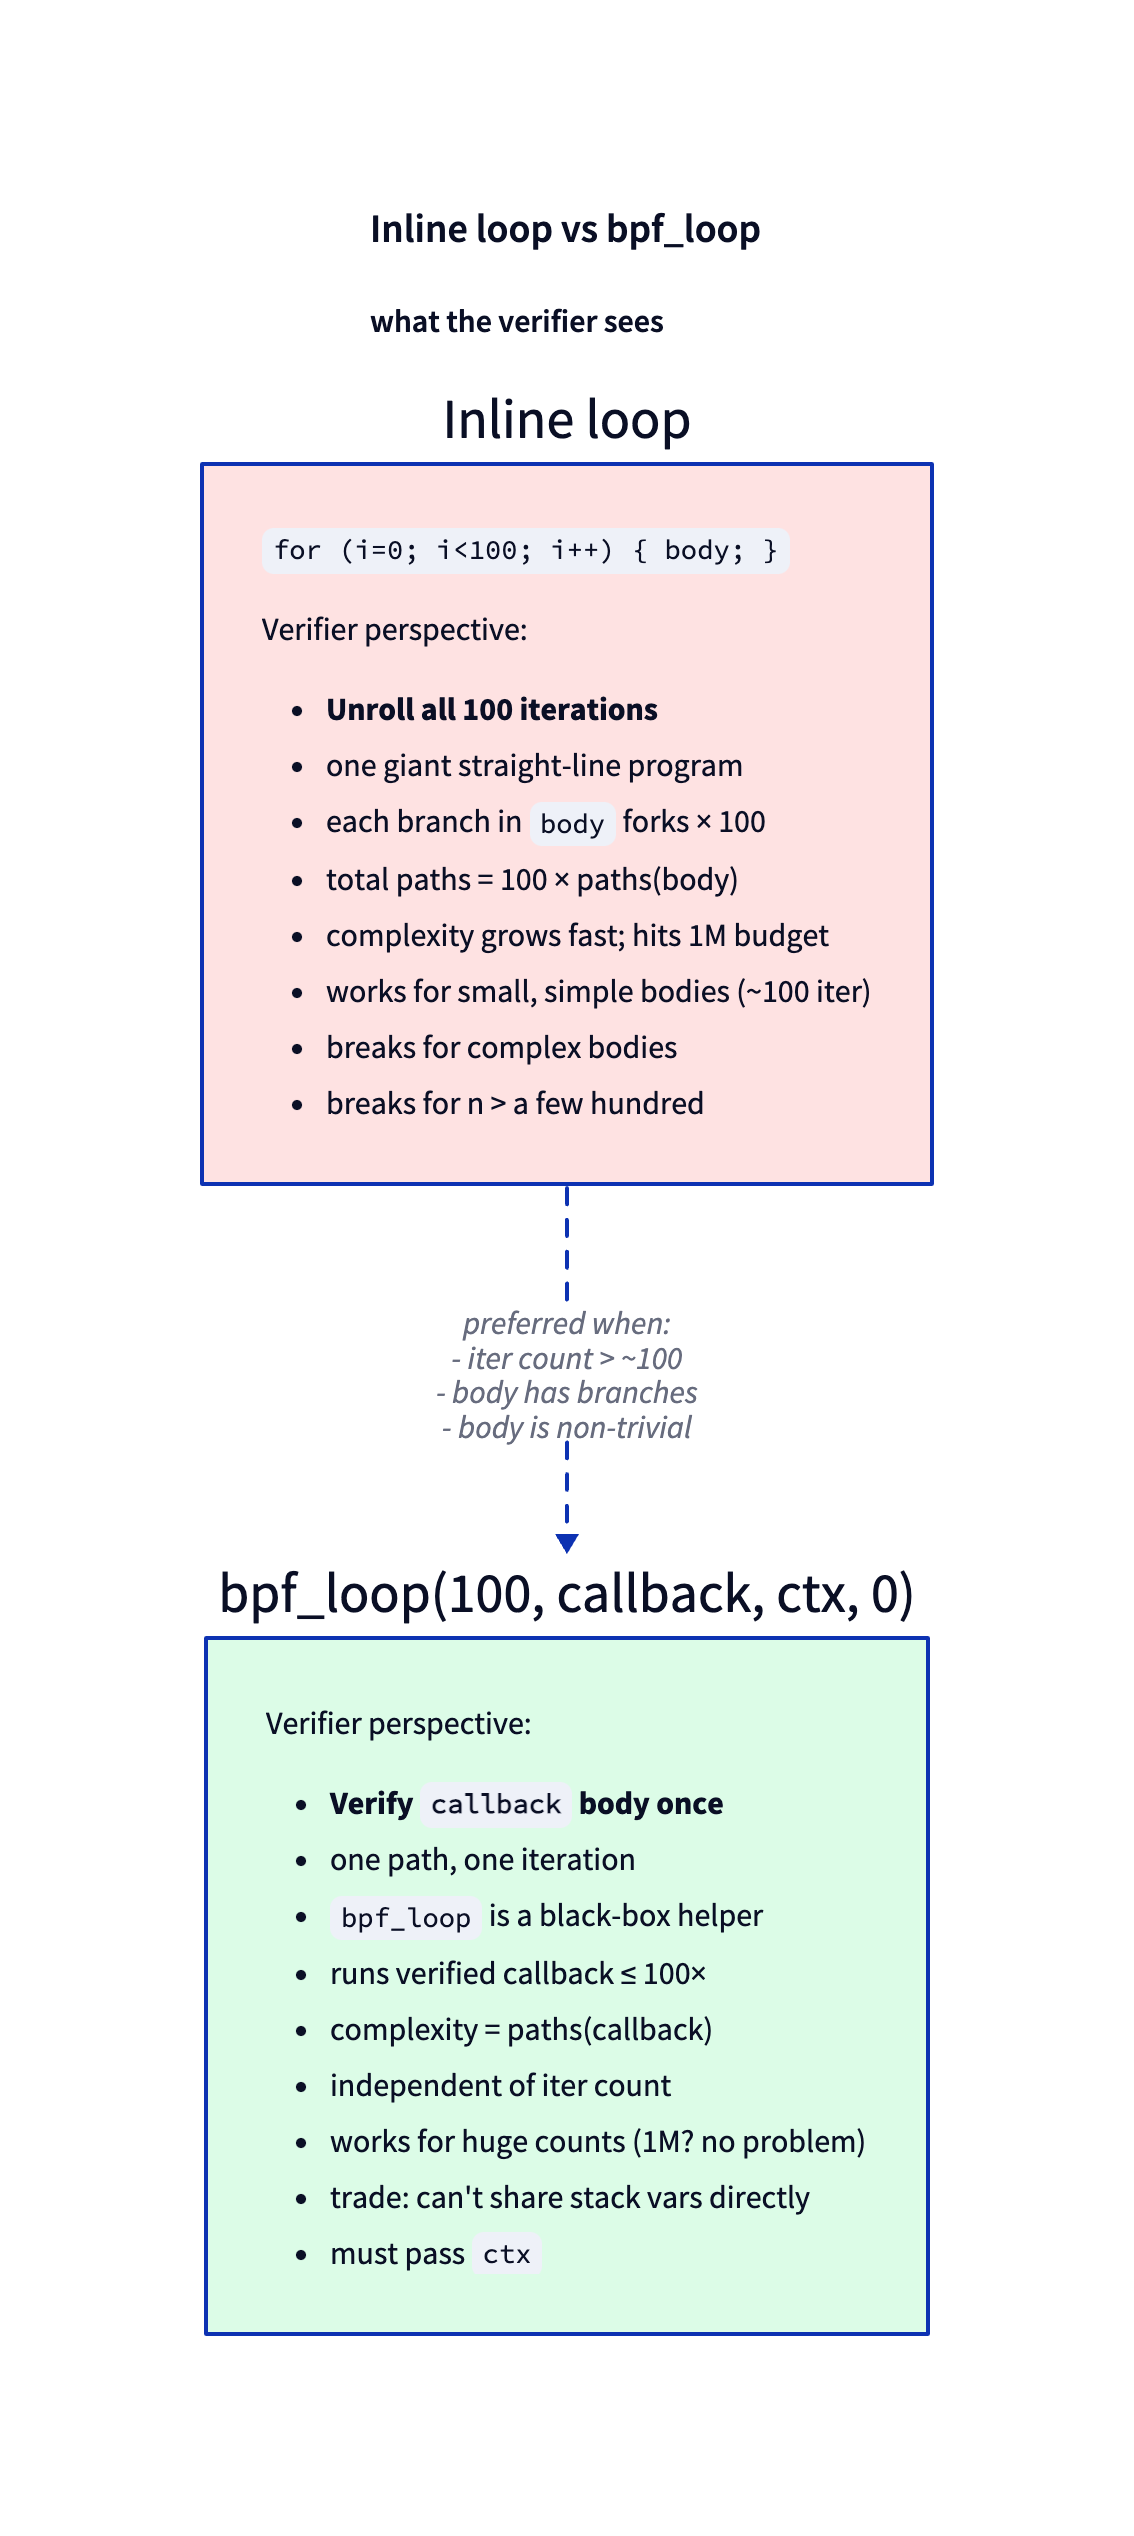
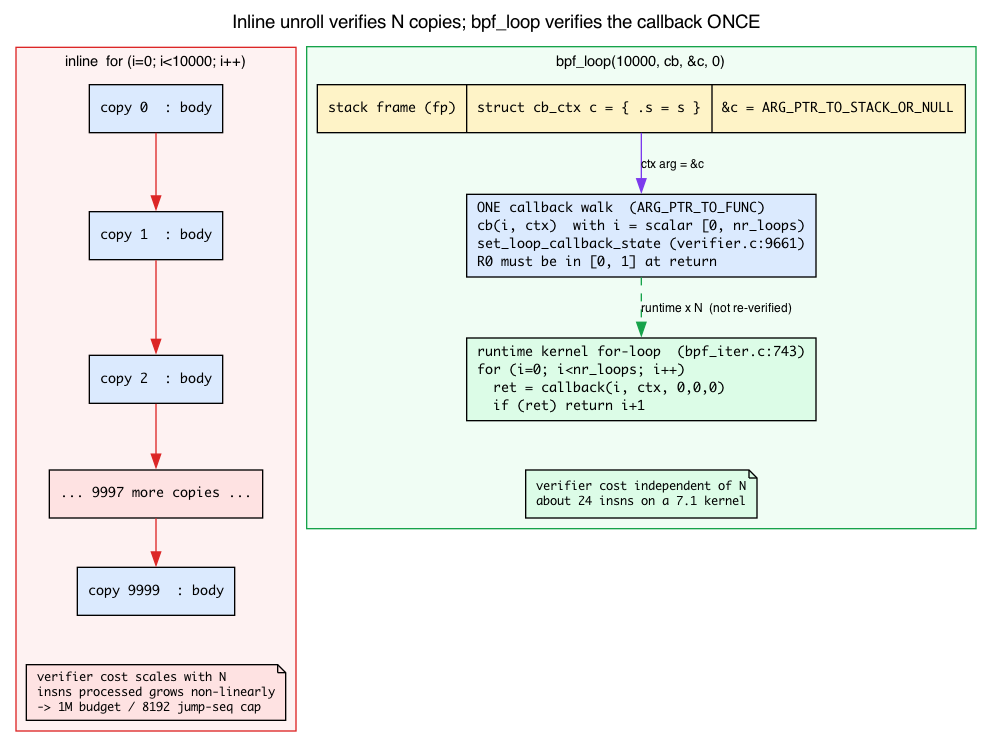
The catch: the callback can’t directly access local variables of the calling function. You pass state through the ctx pointer (last argument) — which, as we just saw, must live on the stack.
Bonus: Iterators (a fifth, loop-shaped tool)
For walking kernel data structures (tasks, sockets, cgroups, BTF), there are dedicated BPF iterators — task_iter, sock_iter, etc. These are programs, not loops, so they sit outside the four-way framing above. We meet them on Day 17. For now: just know they exist as a loop-shaped tool.
The lab
loops.bpf.c — try every shape
#include "vmlinux.h"
#include <bpf/bpf_helpers.h>
#include <bpf/bpf_tracing.h>

char LICENSE[] SEC("license") = "GPL";

struct {
    __uint(type, BPF_MAP_TYPE_ARRAY);
    __uint(max_entries, 1);
    __type(key, __u32);
    __type(value, __u64);
} sum SEC(".maps");

/* helper to get the singleton sum slot */
static __u64 *get_sum(void) {
    __u32 z = 0;
    return bpf_map_lookup_elem(&sum, &z);
}

/* shape 1: constant bound */
SEC("fentry/filename_unlinkat")
int BPF_PROG(loop_const)
{
    __u64 *s = get_sum();
    if (!s) return 0;
    /* The per-iteration helper call keeps clang -O2 from constant-folding
       the loop into a single `*s += 120`. Without it there is no loop left
       for the Verifier to see — and the comparison below would be bogus. */
    for (int i = 0; i < 16; i++)
        *s += bpf_get_prandom_u32();
    return 0;
}

/* shape 4: bpf_loop callback. bpf_loop's ctx argument is
   ARG_PTR_TO_STACK_OR_NULL, so it must point at *stack* memory. Passing the
   raw map-value pointer (a PTR_TO_MAP_VALUE) is rejected:
       R3 type=map_value expected=fp
   so we wrap the map pointer in a small stack struct and pass its address. */
struct cb_ctx { __u64 *s; };
static int cb(__u32 i, void *ctx)
{
    struct cb_ctx *c = ctx;
    *c->s += i;
    return 0;
}

SEC("fentry/filename_unlinkat")
int BPF_PROG(loop_helper)
{
    __u64 *s = get_sum();
    if (!s) return 0;
    struct cb_ctx c = { .s = s };
    bpf_loop(10000, cb, &c, 0);
    return 0;
}
The two programs share a 1-element array map (a “global counter” pattern — recall the array-map singleton trick from Day 2). Build and load both. Note cb_ctx: it exists for exactly one reason — to give bpf_loop a stack address (&c) instead of the raw map pointer s, satisfying ARG_PTR_TO_STACK_OR_NULL.
Inspect the verifier’s effort
Both programs above load successfully — and that changes how you measure them. bpftool prog load only prints a verifier log when a program is rejected, so on a clean load it shows you nothing useful. To see the effort on a successful load, use one of these two paths.
Path 1 — veristat (the purpose-built tool). It load-tests every program in an object file and prints a per-program stats table:
sudo veristat loops.bpf.o
The Insns and States columns are exactly the comparison we want — no attach needed. (veristat ships in the kernel tree under tools/testing/selftests/bpf and may need building/installing; it is not in $PATH by default.)
Path 2 — your own loader. Set the verifier log level before load and read the bottom line of the printed log:
LIBBPF_OPTS(bpf_object_open_opts, opts, .kernel_log_level = 1);
The last line of loop_helper’s log looks like:
processed 24 insns (limit 1000000) ...
processed N insns is the path-exploration cost. The exact counts are kernel- and compiler-version dependent, so capture your own rather than trusting any number printed here — but the relationship is the lesson:
loop_const(16-iter inline) verifies every unrolled iteration, so its insn count scales with the iteration count.loop_helper(10Kbpf_loop) verifies the callback once — that’s theset_loop_callback_statesingle-walk in action — so its cost is tiny and independent of N — about 24 insns on this 7.1 kernel.
bpf_loop is cheaper for the Verifier even though it does more work at runtime, because the callback verifies once.
Stress test: when does inline break?
Try replacing loop_const with a branchy, bounded inline loop:
for (int i = 0; i < N; i++) {
    __u64 v = bpf_get_prandom_u32();
    if (v & 1) *s += v;
    else       *s -= v;
}
Each N needs a fresh build, so: edit N, rebuild (make, or rerun your clang command), reload, repeat. Walk N up: 16, 64, 256, 1024, 10000, and watch processed insns grow non-linearly. N=1024 still loads; around N=10000 on a 7.x kernel it is rejected — but not with the “too large” message you might expect. A branchy body overflows the jump-sequence stack (BPF_COMPLEXITY_LIMIT_JMP_SEQ = 8192, the second of the three ceilings) long before the 1,000,000-instruction budget:
The sequence of 8193 jumps is too complex.
processed 114705 insns (limit 1000000)
Note it failed at ~114K insns — far below the 1M limit. That’s the table from earlier doing its work: this is the jump-sequence depth cap (verifier.c:1733), not the insns-processed budget (verifier.c:17705). The flat BPF program is too large. Processed 1000001 insn message comes from a genuinely unbounded loop instead; see Break 1.
Replace the for with bpf_loop. Loads in milliseconds. The branch in the body × 10000 iterations was 2¹⁰⁰⁰⁰ paths if the Verifier didn’t prune — bpf_loop makes it just paths(callback), because the callback verifies once with i modeled as a fully unknown (unbounded) scalar.
What to break, in order
Break 1 — Unbounded loop
__u32 n = bpf_get_prandom_u32();
for (__u32 i = 0; i < n; i++)
    *s += bpf_get_prandom_u32();   /* per-iteration helper call: cannot be folded */
Note the body. If you write
*s += i;, clang -O2 recognises the closed formn*(n-1)/2and compiles it to straight-line arithmetic with no back-edge — the program then loads fine and this break never fires. The per-iterationbpf_get_prandom_u32()defeats that folding so a real unbounded loop survives to the Verifier.
Reject — n is an unknown scalar, so its range box is [0, U64_MAX], which leaves umax_value(i) at U64_MAX: the Verifier can never prove the counter reaches the exit, so it explores until it exhausts the complexity budget:
BPF program is too large. Processed 1000001 insn
This is the insns-processed ceiling (BPF_COMPLEXITY_LIMIT_INSNS, verifier.c:17705). On older kernels — pre-5.3, before bounded-loop support — the CFG pass rejected this earlier as back-edge from insn N to M from the check_cfg DAG check (cfg.c:138); that wording no longer fires for this case on modern kernels, which allow the back-edge and defer the verdict to range tracking. Add && i < 1024 — the static-cap trick from the range section gives umax_value(i) a hard ceiling of 1023.
Break 2 — Bound that isn’t visible
__u32 n = bpf_get_prandom_u32() % 100;
for (__u32 i = 0; i < n; i++)
    *s += bpf_get_prandom_u32();   /* non-foldable body — keeps a real loop */
(As in Break 1, the body must be something clang can’t fold: with *s += i; the whole loop collapses to n*(n-1)/2 and no loop reaches the Verifier, so there is no range to track and the lesson is lost.)
The Verifier might accept this on modern kernels (it can track n’s range as [0, 99] and thus umax_value(i) <= 98). On older kernels it rejects, because modulo arithmetic doesn’t always propagate a tight umax through the scalar tracker — the range can stay wide even though % 100 logically bounds it. Compare that to a bitwise AND, which the tnum captures immediately:
n = n & 0x7f; // 0..127, verifier definitely sees the bound
& 0x7f sets every bit above bit 6 to known-zero in n’s tnum (var_off), which forces umax_value(n) to 127 on the spot. The high bits become a hard fact, so i < n now caps umax_value(i) at 126 and the loop is provable. Lesson: a bitmask updates the known-bits domain directly; modulo may not — be explicit when you can be.
Break 3 — Hit the complexity budget
A pattern that looks pathological:
char buf[256];
bpf_get_current_comm(buf, sizeof(buf));
for (int i = 0; i < 256; i++) {
    if (buf[i] == '/') { /* do A */ }
    else if (buf[i] == ' ') { /* do B */ }
    else { /* do C */ }
}
Surprise: on a modern (7.x) Verifier this loads cleanly. The branch bodies are empty, so every path leaves register/scalar state unchanged and state pruning collapses them all — the 256 iterations never explode. To actually breach the budget you need both a high iteration count (well past N=10000 on 6.6+, as in the stress test above) and branch bodies that diverge register state so the paths can’t be pruned. Give each branch a state-changing side effect and raise the count:
for (int i = 0; i < N; i++) {
    if      (buf[i] == '/') *s += i;
    else if (buf[i] == ' ') *s -= i;
    else                    *s ^= i;
}
Now the paths diverge (each branch leaves a different register-state box, so pruning can’t merge them) and, at a large enough N, you overflow the jump-sequence stack: The sequence of NNNN jumps is too complex. — the same BPF_COMPLEXITY_LIMIT_JMP_SEQ cap from the stress test, not the 1M insns budget. Fix: refactor with bpf_loop, or reduce the iteration count to the longest sensible string length.
Break 4 — Callback returning the wrong thing
Wire a callback that returns something other than 0 or 1 into the (now-loadable) loop_helper from the lab:
static int cb(__u32 i, void *ctx) {
    return 2;     // valid returns: 0 (continue) or 1 (break)
}
Verifier rejects:
At callback return the register R0 has smin=2 smax=2 should have been in [0, 1]
Read that message through the range domain. smin=2 smax=2 means R0 is the exact constant 2 — a perfectly bounded value; its box is the single point {2}. It is rejected anyway, because the callback-return range check (verifier.c:9896, “At callback return”, “R0”) demands R0 lie in [0, 1], and should have been in [0, 1] is the generic range complaint at verifier.c:303. “Bounded” and “in the allowed range” are different questions: the value is bounded, just bounded to the wrong range. This is the same scalar-range machinery that proves loop termination, now applied at the subprogram’s exit. (Exact register fields vary by kernel version. You can only reach this check once loop_helper’s ctx is fixed, otherwise the R3 type=map_value expected=fp error fires first.)
What to read in the kernel
kernel/bpf/bpf_iter.c— searchBPF_CALL_4(bpf_loop(line 727). The runtime implementation is the tightforloop at lines 743–751 calling the verified callback; the proto at 753–761 declaresARG_PTR_TO_FUNC(:758) andARG_PTR_TO_STACK_OR_NULL(:759). The Verifier knows about this helper specifically and verifies the callback once viaset_loop_callback_state(verifier.c:9661).include/linux/bpf_verifier.h— readstruct bpf_reg_statearound lines 117–127:var_off(the tnum) plus thesmin/smax/umin/umaxinterval and the 32-bit sub-register bounds. This is the abstract domain. Spend five minutes here; it pays off for every future verifier log.kernel/bpf/verifier.c:- search
bpf_is_state_visited(defined inkernel/bpf/states.c) — the heart of state pruning. - search
process_bpf_exit_full— how state propagates across paths at exit. For the liveness machinery it leans on, seekernel/bpf/liveness.c. - line 20033
bpf_check_cfg(env)— the CFG pass that finds back-edges.
- search
kernel/bpf/cfg.c— line 138, theback-edge from insn %d to %dmessage, so you can see where the loop is actually discovered.tools/testing/selftests/bpf/progs/bpf_loop.c— official examples of every loop shape.Documentation/bpf/verifier.rst— the kernel’s own doc on how the Verifier handles loops and value tracking. Worth one read.
Bullet Points
- The Verifier rejects unbounded loops because it must prove termination statically — there’s no kernel watchdog to recover from infinite BPF.
- Every scalar register carries a numeric range, not just a type: signed/unsigned
min/maxplus a tnum (var_off) known-bits mask. Loop bounds are proved by watching this box shrink toward the exit, not by reading C source. - A back-edge (loop) is found by the separate CFG pass (
bpf_check_cfg); termination is then judged by the range domain.i < 64pinsumax(i)=63; an unboundedi < nleaves it atU64_MAXand is unprovable. - Three ceilings, three messages:
back-edge from insn N to M(CFG pass),BPF program is too large(1M insns-processed budget),The sequence of N jumps is too complex(8192 jump-sequence stack — branchy loops hit this first). - Constant-bound
foris fine for small counts (≤ ~64); variable bound with static cap (i < n && i < CAP) hands the range tracker a constant ceiling;#pragma unrollremoves the back-edge entirely (tiny counts only). bpf_loop(N, cb, ctx, 0)is the modern answer: the callback (a subprogram passed viaARG_PTR_TO_FUNC) is verified once as a single generic iteration, so cost is independent of N. At runtime it’s a plain kernelforloop. Thectxmust be stack memory (ARG_PTR_TO_STACK_OR_NULL) — hence the stack wrapper.- The callback contract (return 0 or 1) is enforced by the same range machinery: R0 must be in
[0,1]at return — “bounded” ≠ “in the allowed range” (see Break 4). - A bitwise
& 0x7fsets known-zero bits in the tnum and snapsumaxto 127 immediately; modulo may not propagate a tight max — be explicit.
Check question
A loop iterates 100 times. Inside, you have an if/else with 4 conditions (so 4 branches at one point). Roughly how many paths does the Verifier explore without state pruning? And with bpf_loop instead of an inline loop?
Click to reveal answer
Answer: Without pruning: 4¹⁰⁰ ≈ 10⁶⁰ — astronomical. With state pruning the Verifier collapses iterations whose register states (the numeric range boxes for every scalar) are equivalent, often bringing it back to manageable. With bpf_loop, the callback (one iteration of the body) is verified once with its 4 branches = 4 paths total, with the index i modeled as a fully unknown (unbounded) scalar. The 100-iteration aspect is opaque to the Verifier — bpf_loop is just a helper call with a bounded execution contract.
End of Phase 1
You now have:
- A working libbpf+CO-RE+ringbuf+hashmap workflow.
- The instinct to null-check after every lookup or reserve.
- The vocabulary to read verifier logs — including the three distinct rejection messages and what each one means.
- An understanding of what the Verifier does — abstract interpretation over a numeric range domain, with state pruning, under (more than one) complexity budget.
That’s enough foundation to do real BPF work. Phase 2 (Days 6–13) specializes you into tracing: typed function tracing with fentry/fexit at scale, tracepoints, stack traces, uprobes, and sleepable programs.
Tomorrow
Day 6: typed function tracing with fentry/fexit at scale. We attach to kernel functions by name and read their arguments with full type information — no more PT_REGS_PARM guesswork. You’ll see how BTF lets fentry know the real signature of the function you hook, and why that makes argument access both safer and faster than the kprobe path.
Day 6 — fentry/fexit and the latency-measurement pattern
Today’s mission: measure the latency of every
vfs_readon your system. Build a map keyed by thread, store the entry timestamp on call-in, retrieve it on call-out, emit duration to userspace. Along the way: meetfexitand understand exactly how it differs from the olderkretprobe(the return-address swap, the instance pool, why bursts get missed), learn whatvfs_readactually is and what its return value means, and pick the right per-thread key. Total time: ~110 minutes.
Phase 2 starts here. Days 1–5 made you fluent with libbpf, CO-RE, maps, and the Verifier. Days 6–13 turn that fluency into tracing: typed kernel-function tracing at scale, tracepoints, stack traces, uprobes, and sleepable programs. By Day 13 you’ll be able to write the kind of tracer that ships in production observability tools.
The pattern that powers every tracer
Most tracing problems reduce to one shape:
“When event A happens, remember something. When the matching event B happens, retrieve and act on it.”
For latency: A = function entry, B = function exit. Remember the timestamp on A; on B compute now - remembered.
Yesterday you saw fentry. Today you meet its other half — fexit — and use them as a pair to do the most common BPF tracing pattern in the world.
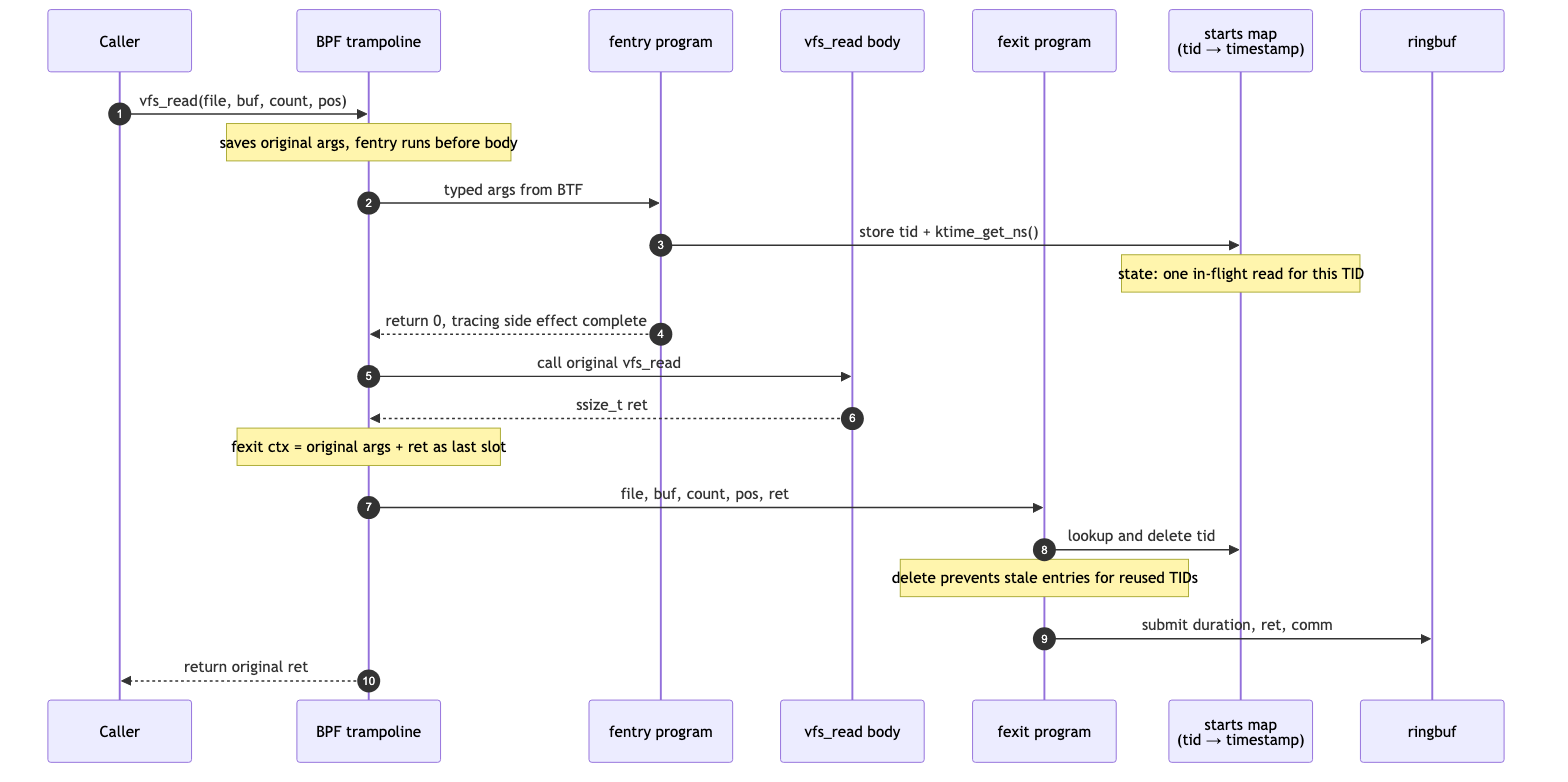
The fentry program runs before the function body. The fexit program runs after it. Both are connected to the same trampoline; the kernel installs them as a coordinated pair when you load the BPF object. Between entry and exit, the function does its work — could be 100 ns, could be 100 ms.
What is vfs_read, and what does its return value mean?
Before we hook anything, know your target. Today we trace vfs_read, and the lab only makes sense if you know two facts about it.
First: vfs_read is the kernel’s single central entry point for the read(2)/pread(2) family of syscalls. Every file-descriptor read — whether the fd is a regular file, a socket, a pipe, /dev/zero, or a procfs node — funnels through vfs_read before the kernel dispatches to that particular filesystem’s own read handler. That makes it a perfect chokepoint: hook vfs_read once and you see all reads on the box. (You actually used fentry/vfs_read back in a Day 2 break without explanation — now you know why it’s such a popular target.)
Second: its signature is exactly the four typed arguments our fentry program will declare, and its return type is exactly what fexit captures. In v7.1:
/* fs/read_write.c:554 */
ssize_t vfs_read(struct file *file, char __user *buf, size_t count, loff_t *pos)
struct file *file— the open file the fd refers to (Day 1 notedstruct filelives invmlinux.h; that’s all we need).char __user *buf— the userspace destination buffer.size_t count— how many bytes the caller asked for.loff_t *pos— pointer to the file offset.
The return type ssize_t is the contract our fexit program reads. On success it’s the number of bytes actually read — which can be less than count (a short read, or EOF returning 0). On failure it’s a negative errno. You can see all three failure returns right at the top of the function:
/* fs/read_write.c:558-563 */
if (!(file->f_mode & FMODE_READ))
    return -EBADF;
if (!(file->f_mode & FMODE_CAN_READ))
    return -EINVAL;
if (unlikely(!access_ok(buf, count)))
    return -EFAULT;
and the success value comes straight from the filesystem’s own read op:
/* fs/read_write.c:571-573 */
if (file->f_op->read)
    ret = file->f_op->read(file, buf, count, pos);
else if (file->f_op->read_iter)
    ret = new_sync_read(file, buf, count, pos);
That’s why today’s lab prints the return value as a signed number labelled “bytes”: vfs_read → 2543 bytes is a successful 2543-byte read; a negative number would be an errno. We don’t need the full VFS read path (->read vs ->read_iter dispatch) — just “central read chokepoint” and “return = bytes-or-negative-errno,” so the output isn’t magic.
Meet fexit
fexit is the counterpart to fentry: it attaches at function return. But unlike fentry, you also get the return value handed to you as a typed argument. That last argument matters — it’s what makes fexit strictly more powerful than the older kretprobe.
To appreciate why fexit is the better tool, you have to understand how the old return-probe machinery works — because the chapter is about to contrast against it repeatedly, and a kretprobe hooks a function’s return in a fundamentally trickier way than the entry kprobe you already know.
Refresher: the entry kprobe (Day 1)
Day 1 already explained the entry kprobe: it overwrites the probed function’s first instruction with an int3 breakpoint byte. When the CPU executes that byte it traps, the kprobe handler runs, then the original instruction is single-stepped or emulated and execution continues. On x86 the emulation helpers are right there — int3_emulate_call, int3_emulate_ret, int3_emulate_jmp (arch/x86/kernel/kprobes/core.c:507-525). We do not re-teach that here. The entry hook is solved.
The new question is: how do you run code at the return? There’s no single instruction to breakpoint — a function can ret from many places, and the same code runs for every caller.
How a kretprobe hijacks the return address
A kretprobe is layered on top of an entry kprobe, and it plays a stack trick:
- At function entry, the kprobe handler reads the function’s real return address off the kernel stack and saves it in a per-call object. Then it overwrites that saved return address on the stack with the address of a kernel trampoline.
- The function runs normally and eventually does
ret. Butretnow pops the trampoline address, not the real caller — so control lands in the trampoline. - The trampoline runs your return handler (which can read the return value), then jumps to the real saved caller address so the program continues as if nothing happened.
On x86 that trampoline is hand-written assembly whose address is what gets stuffed onto the stack:
/* arch/x86/kernel/rethook.c:26-38 */
"arch_rethook_trampoline:\n"
    ...
    "   pushq $arch_rethook_trampoline\n"   /* fake return addr for the unwinder */
    ...
    "   call arch_rethook_trampoline_callback\n"
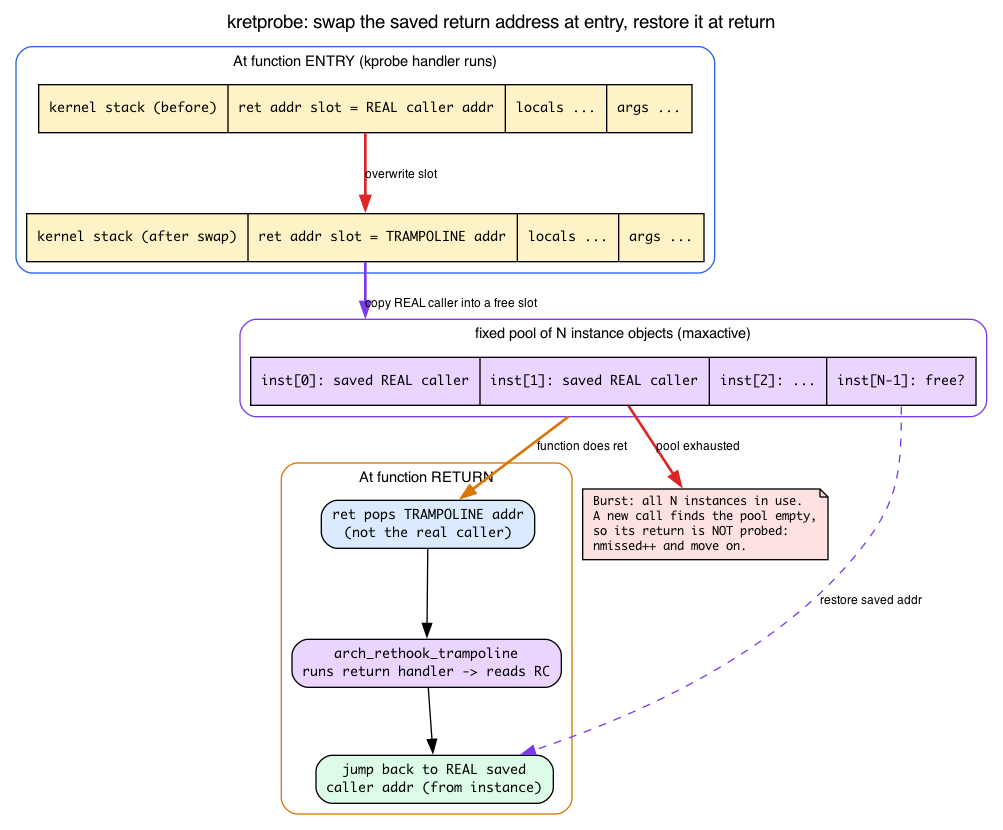
The instance pool. To save that real return address you need one object per in-flight call. Recursion, preemption, and many CPUs all mean several calls to the same function can be “in flight” at once, each needing its own saved address. So the kernel pre-allocates a fixed pool of these objects, sized by maxactive. The fields live right in struct kretprobe:
/* include/linux/kprobes.h:150-154 */
int maxactive;
int nmissed;
...
struct rethook *rh;
and the per-call save object is:
/* include/linux/kprobes.h:162-164 */
struct kretprobe_instance {
    ...
    struct rethook_node node;
    ...
};
The in-tree comment spells out the sizing contract: “maxactive - The maximum number of instances of the probed function that can be active concurrently” and “nmissed - tracks the number of times the probed function’s return was ignored, due to maxactive being too low” (include/linux/kprobes.h:135-138). If more calls are in flight simultaneously than the pool size, the extra returns simply aren’t probed — the kernel bumps nmissed and moves on. That’s what “bursts can exhaust the instances pool” means, made concrete: a sudden flood of concurrent calls silently loses return events.
The unwinder problem. Because the kretprobe rewrote the saved return address, anything that walks the kernel stack to reconstruct caller frames sees the trampoline address where the true caller should be. In the kernel this means the in-kernel stack unwinders (ORC on x86_64, frame-pointer unwinding) that back dump_stack(), /proc/<pid>/stack, perf/ftrace backtraces, and bpf_get_stack — there is no C++ exception machinery in the kernel; it’s all C. (The x86 trampoline even pushes a fake $arch_rethook_trampoline frame to tell the unwinder “this is a rethook,” precisely because the real return address is hidden.) This is the “stack-modifying tricks break unwinding” remark, made concrete.
Why fexit avoids all of that
fexit is part of the same trampoline fentry uses. The trampoline saves arguments on entry, calls fentry programs, calls the original function, gets the return value, appends it to the context array, then calls fexit programs.
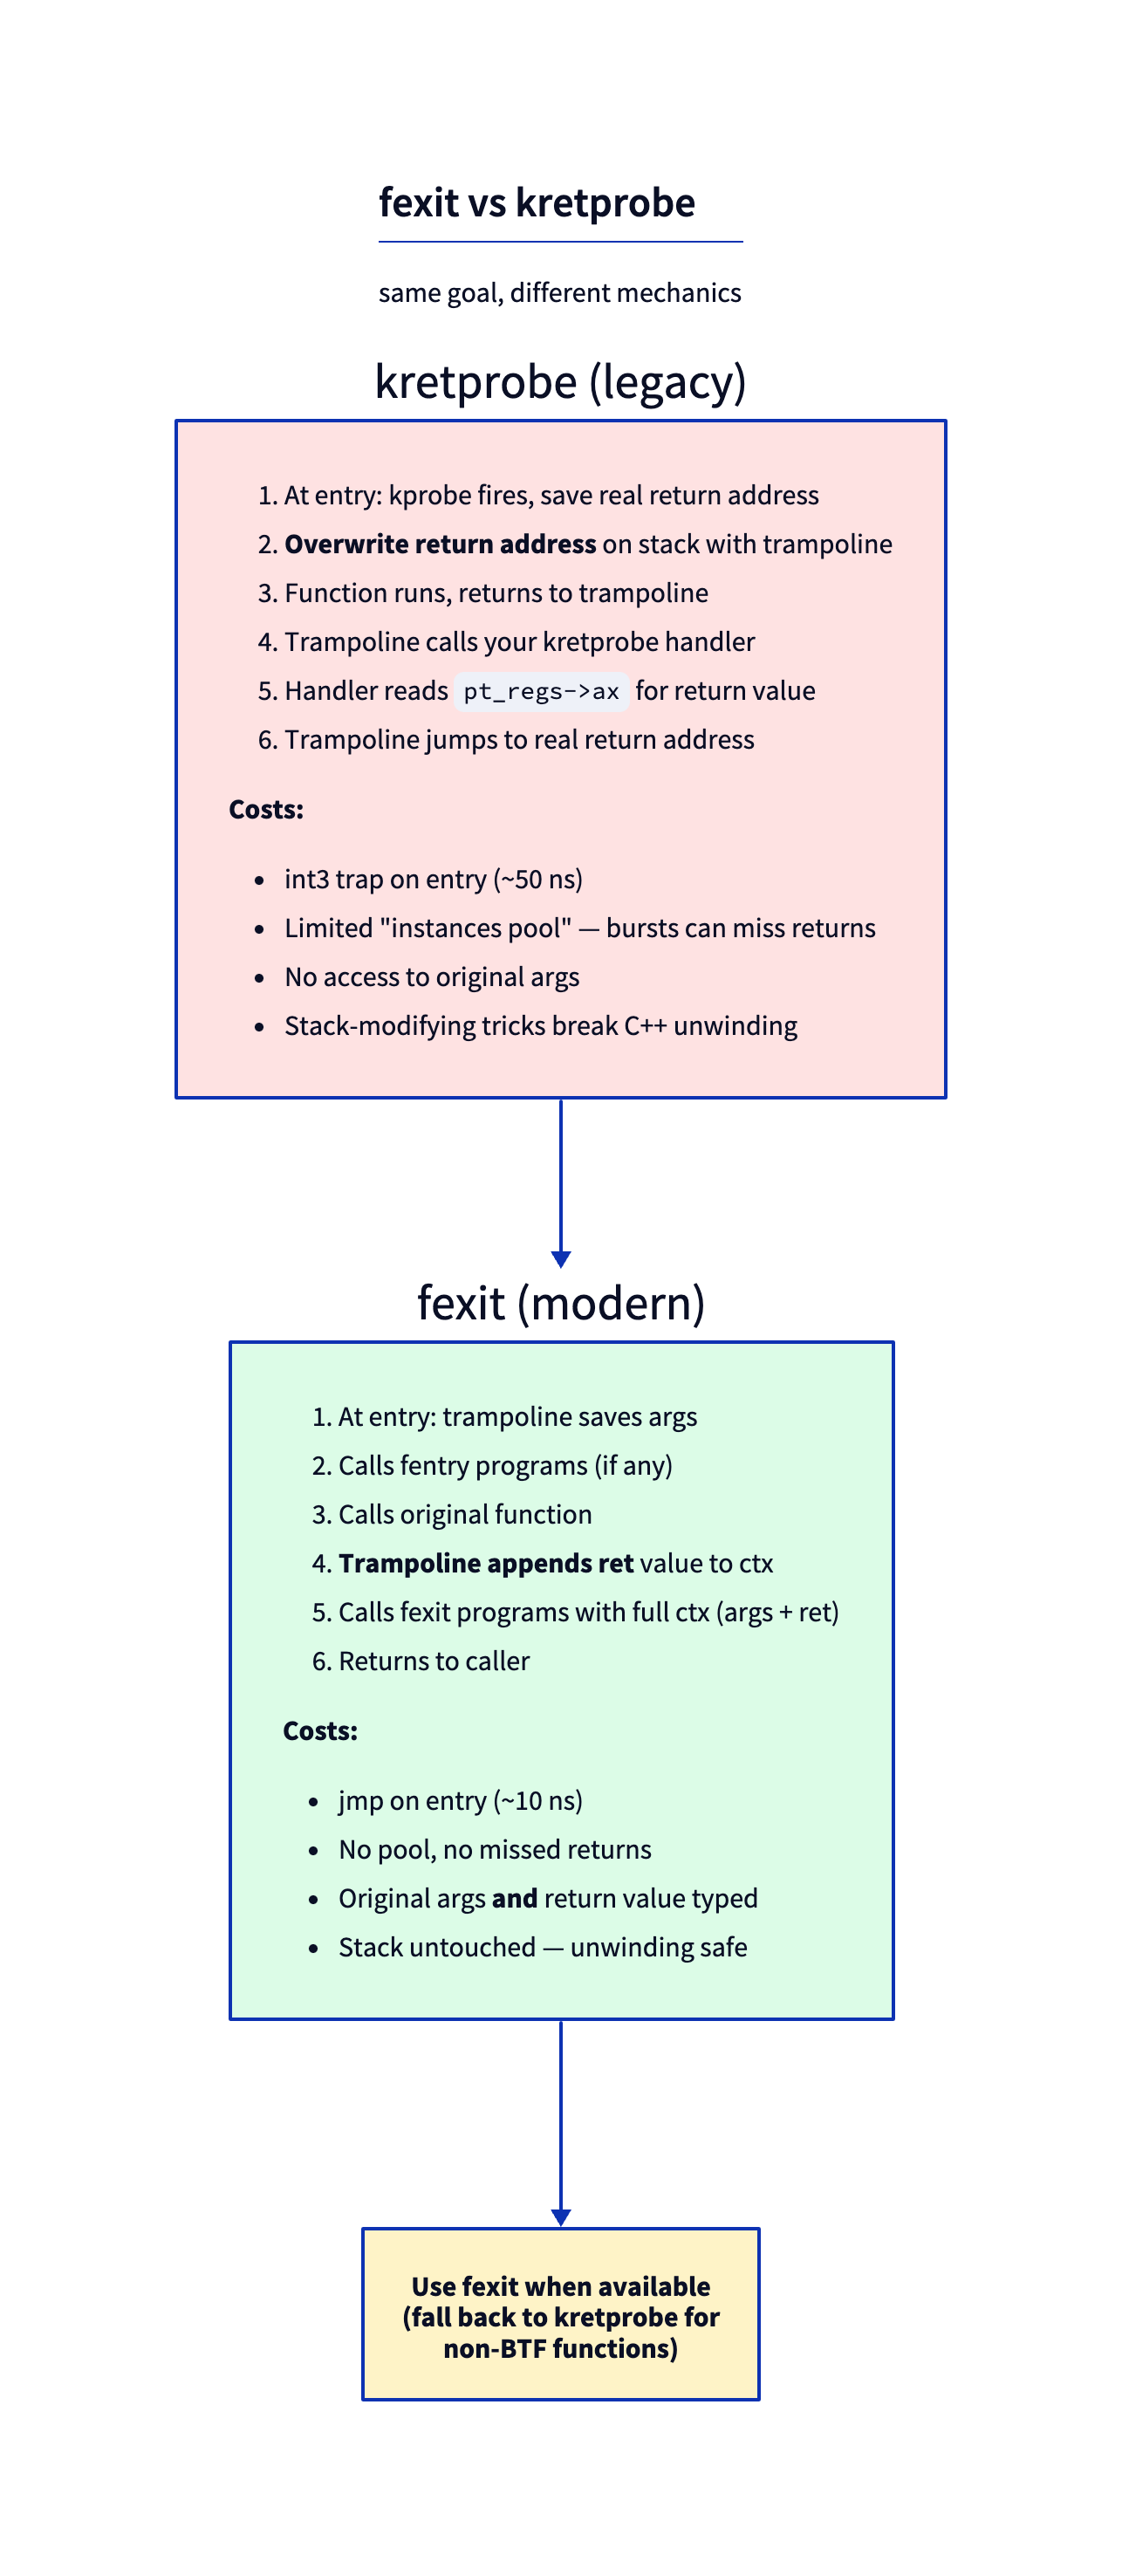
Compare the two mechanisms point for point:
- kretprobe rewrites the saved return address, needs a finite per-probe instance pool, drops returns (
nmissed++) on bursts, and confuses stack unwinders. Effective, but invasive. - fexit never touches the return address. The original function returns normally to its real caller; the trampoline captured the return value alongside, so there’s no stack rewrite, no finite pool, and no missed-on-burst failure mode.
That’s the whole argument: prefer fexit wherever it’s available — any function with BTF info (essentially every non-__attribute__((always_inline)) kernel function on a modern build). Use kretprobe only when fexit isn’t available.
There are no Dumb Questions
Q: Are fentry and fexit two separate hooks, or one?
A: One hook with two callbacks, conceptually. The kernel builds a single trampoline per attach target that invokes all attached fentry programs and all attached fexit programs in sequence. You can attach an fentry without an fexit, or vice versa. They share the trampoline infrastructure (
kernel/bpf/trampoline.c) but are independent BPF programs from your perspective.Q: What if the function never returns (panic, BUG_ON)?
A: Then fexit doesn’t run. Your map entry stays in the hash table indefinitely. We’ll see this exact failure mode in today’s “what to break” — it’s the source of slow leaks in tracers that run for weeks.
Q: Can a function be called recursively?
A: Yes, and it’s the case where TID-as-key breaks down. Today’s check question at the end walks through exactly why. For most kernel functions you trace, recursion isn’t an issue.
Meet bpf_ktime_get_ns
__u64 ts = bpf_ktime_get_ns();
Returns nanoseconds on the monotonic clock (CLOCK_MONOTONIC): time advances steadily and never goes backward, but it excludes any interval the machine spent suspended, so it isn’t literally “elapsed since boot.” That’s exactly what you want for measuring a latency delta — both reads use the same clock and the difference is meaningful. Cheap — implemented as ktime_get_mono_fast_ns under the hood, no locking, single read of a kernel timekeeping cache. ~10ns to invoke. It is not calendar/wall-clock time and you can’t correlate it with userspace clock_gettime(CLOCK_REALTIME) timestamps. If you need elapsed real time that also counts suspend, use bpf_ktime_get_boot_ns (CLOCK_BOOTTIME — still a monotonic count from boot, just inclusive of suspend, not wall-clock). The closest thing to wall-clock here is bpf_ktime_get_tai_ns (CLOCK_TAI, which tracks UTC up to a fixed leap-second offset).
TID vs TGID — pick the right key
This is the bug that bites everyone the first time they write a per-thread tracer. Read this carefully before writing code today.
bpf_get_current_pid_tgid() returns a packed u64:
+------------------+------------------+
| TGID (upper 32)  | TID (lower 32)   |
+------------------+------------------+
Linux kernel terminology and userspace terminology don’t match:
- What userspace calls “PID” is the kernel’s TGID (thread group ID — the leader thread’s TID).
- What the kernel calls TID is the per-thread identifier.
A multi-threaded process has many TIDs sharing one TGID. Inside bpf_get_current_pid_tgid:
__u32 tgid = bpf_get_current_pid_tgid() >> 32;       // userspace "PID"
__u32 tid  = bpf_get_current_pid_tgid() & 0xffffffff; // unique per thread
For tracking concurrent in-flight calls, you need per-thread granularity:
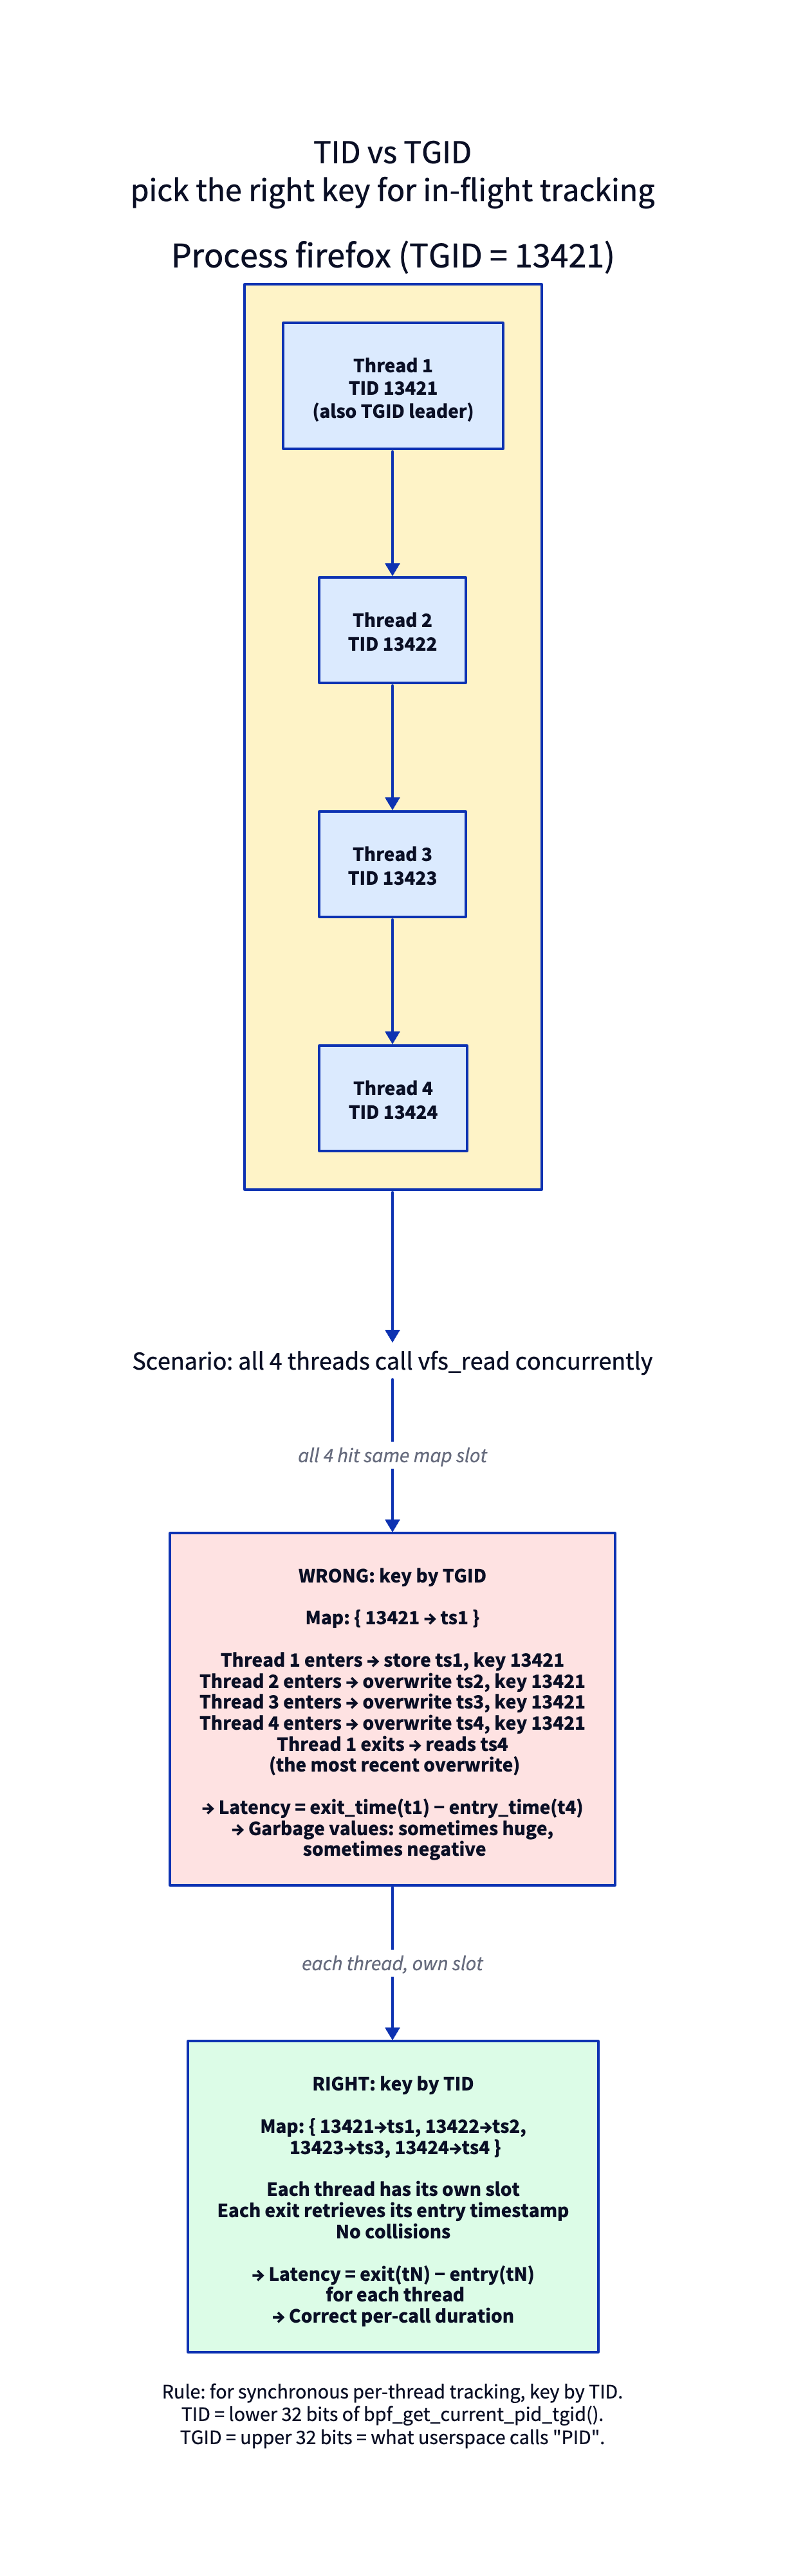
If you key by TGID, four threads of the same process all hit the same map slot, overwriting each other’s timestamps. The latency reading is garbage. Use TID.
Sharpen your pencil
Why doesn’t the kernel just give you a single “thread identifier” without ambiguity? Why does
bpf_get_current_pid_tgidpack two fields into one return value?.
.
.Answer: because one helper call is cheaper than two. The kernel only ever exposed the combined helper
bpf_get_current_pid_tgid(helper id 14) — there was never a separatebpf_get_current_pidorbpf_get_current_tgidin the UAPI. The single call returns both fields packed together, mirroring whattask_structitself carries: bothpid(kernel meaning) andtgid. The body is literallyreturn (u64) task->tgid << 32 | task->pid;(kernel/bpf/helpers.c:225-233). The naming confusion is historical — userspace called processes “PIDs” before threads existed.
The lifecycle, explicitly
Walk through what the map looks like over time when two threads concurrently read:
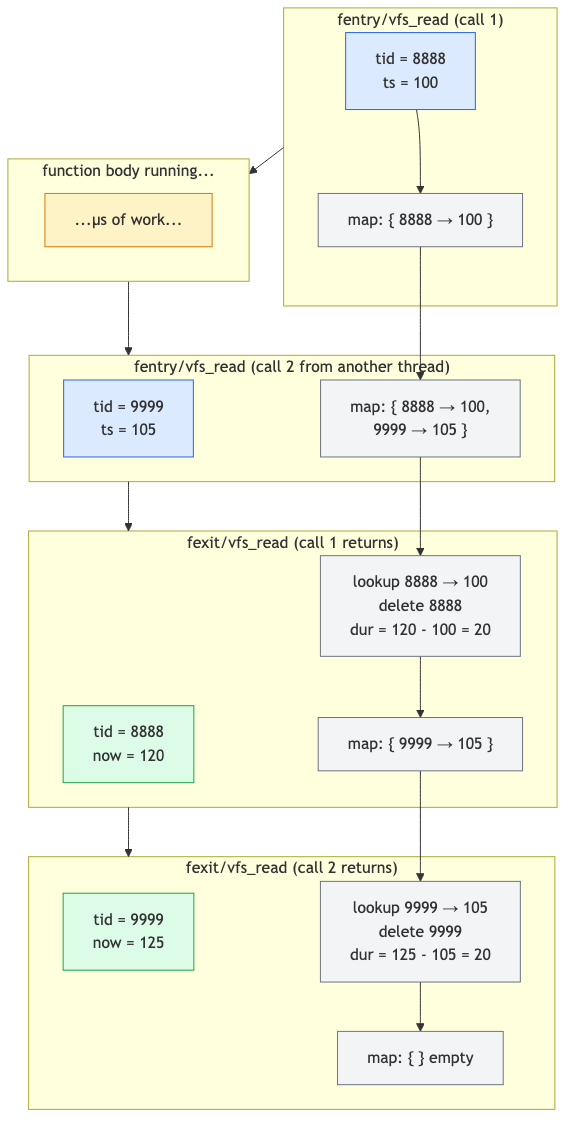
Each thread enters → its TID gets a slot. Each thread exits → its TID’s slot is read and deleted. The map is empty when nothing is in flight. The delete is critical — without it, the map fills as threads come and go.
The lab
latency.h — the shared event record
The producer and consumer share one struct through a header, exactly as Days 1 and 3 did:
#ifndef PRACTICAL_EBPF_LATENCY_H
#define PRACTICAL_EBPF_LATENCY_H

struct event {
    unsigned int pid;
    unsigned int tid;
    unsigned long long dur_ns;
    long long ret;
    char comm[16];
};

#endif
latency.bpf.c
#include "vmlinux.h"
#include <bpf/bpf_helpers.h>
#include <bpf/bpf_tracing.h>

#include "latency.h"

char LICENSE[] SEC("license") = "GPL";

struct {
    __uint(type, BPF_MAP_TYPE_HASH);
    __uint(max_entries, 10240);
    __type(key, __u64);    /* tid */
    __type(value, __u64);  /* ns timestamp */
} starts SEC(".maps");

struct {
    __uint(type, BPF_MAP_TYPE_RINGBUF);
    __uint(max_entries, 256 * 1024);
} rb SEC(".maps");

SEC("fentry/vfs_read")
int BPF_PROG(on_enter, struct file *f, char *buf, size_t n, loff_t *pos)
{
    __u64 tid = bpf_get_current_pid_tgid() & 0xffffffff;
    __u64 ts = bpf_ktime_get_ns();
    bpf_map_update_elem(&starts, &tid, &ts, BPF_ANY);
    return 0;
}

SEC("fexit/vfs_read")
int BPF_PROG(on_exit, struct file *f, char *buf, size_t n, loff_t *pos, ssize_t ret)
{
    __u64 id = bpf_get_current_pid_tgid();
    __u64 tid = id & 0xffffffff;
    __u64 *ts = bpf_map_lookup_elem(&starts, &tid);
    if (!ts)
        return 0;
    __u64 dur = bpf_ktime_get_ns() - *ts;
    bpf_map_delete_elem(&starts, &tid);

    struct event *e = bpf_ringbuf_reserve(&rb, sizeof(*e), 0);
    if (!e) return 0;
    e->pid = id >> 32;
    e->tid = tid;
    e->dur_ns = dur;
    e->ret = ret;
    bpf_get_current_comm(&e->comm, sizeof(e->comm));
    bpf_ringbuf_submit(e, 0);
    return 0;
}
The fentry signature (struct file *f, char *buf, size_t n, loff_t *pos) is exactly the four vfs_read arguments we read off fs/read_write.c:554 above. The fexit signature is those same four args plus the captured ssize_t ret — the byte-count-or-negative-errno we discussed, which is what e->ret carries to userspace.
What’s new since Day 1–5
- Two programs in one object, sharing maps. The skeleton exposes both as
skel->progs.on_enterandskel->progs.on_exit. Both auto-attach when you calllatency_bpf__attach(skel). BPF_PROG(on_exit, ..., loff_t *pos, ssize_t ret)— fexit receives all function arguments first, then the return value as the last parameter. TheBPF_PROGmacro knows fexit programs receive one extra ctx slot. We meetBPF_PROG’s mechanics in detail on Day 7.bpf_map_update_elem(..., BPF_ANY)— insert-or-update. Note we useBPF_ANYhere, notBPF_NOEXIST, because we don’t care if the same TID had a stale entry from a missedfexit(e.g., the previous call panicked). Overwriting is correct.bpf_map_lookup_elemreturns a pointer into live map memory. You can read it directly. The Verifier requires the null check.bpf_map_delete_elem— do not skip this. It’s the line that prevents the map from filling forever.
latency.c
Standard ringbuf consumer. Print:
printf("PID %u TID %u vfs_read → %lld bytes in %llu µs (%s)\n",
       e->pid, e->tid, (long long)e->ret,
       e->dur_ns / 1000, e->comm);
(We don’t capture the request size in this minimal version. Add it as an exercise.)
Run it
Use two terminals so the tracer and the workload don’t fight over one shell.
Terminal A — build and run the tracer in the foreground, and wait until it has attached before generating work (a vfs_read issued before latency_bpf__attach() returns is silently missed):
make
sudo ./latency
Terminal B — once the tracer is live, generate some reads:
cat /etc/passwd > /dev/null
dd if=/dev/zero of=/dev/null bs=1k count=100
Expected (in Terminal A):
PID 14001 TID 14001 vfs_read → 2543 bytes in 12 µs (cat)
PID 14002 TID 14002 vfs_read → 1024 bytes in 8 µs (dd)
PID 14002 TID 14002 vfs_read → 1024 bytes in 6 µs (dd)
...
The → N bytes column is vfs_read’s return value: 2543 bytes read by cat, 1024 per dd block. A negative value there would be an errno (e.g. -9 for -EBADF) — that’s the contract we read off fs/read_write.c:558-573.
This traces every vfs_read on the box, not just cat/dd — sshd, systemd, journald, and the shell itself all read constantly, so those two lines are buried in a flood of unrelated events. To isolate them, pipe Terminal A through grep -E 'cat|dd' (or filter by comm in the consumer). Stop the tracer with Ctrl-C in Terminal A when done. (If you prefer to background it with sudo ./latency &, remember to sleep 1 before generating work so attach completes, and sudo pkill latency to stop it.)
You just measured every kernel-side vfs_read on your system in real time, with typed argument access and a few hundred nanoseconds of overhead per call. This is what eBPF is for.
What to break, in order
Break 1 — Forget the bpf_map_delete_elem
You saw a preview of this back in Day 2 (Break 4, flagged as a Day 9 teaser); here it’s the actual failure mode of today’s tracer, so it earns a full walk-through. Day 2 used the quick-and-dirty wc -l counter — below we teach the dependable -j | jq length form instead, which is the count you should trust.
Comment it out, then make and relaunch a fresh tracer (sudo pkill latency; make && sudo ./latency &) — the starts map only exists while the loaded program is running, so bpftool map ... name starts finds nothing if the tracer isn’t up. Drive load from another terminal with find /usr -type f -exec cat {} + >/dev/null, then periodically read the live entry count. The reliable, version-independent way is the JSON dump piped to jq length:
sudo bpftool map dump -j name starts | jq length
21
(Plain bpftool map dump name starts prints the entries themselves — on the v7.x bpftool here as key: … value: … lines with a trailing Found N elements footer; only the -j flag emits a JSON array. The format varies across builds, which is exactly why the -j | jq length form above is the dependable counter. Don’t use bpftool map show name starts for this — it reports only the static max_entries 10240 ceiling and key/value sizes, never the live count. And don’t pipe map dump through wc -l: it counts formatting/footer lines, not elements.)
Watch N climb. Slowly at first, then steady. As it plateaus toward max_entries=10240, bpf_map_update_elem silently fails on every new TID. Your tracer’s coverage degrades to “only TIDs that were already in flight when the map filled.”
This is the slow-poison failure mode. Always delete on exit.
Break 2 — Use TGID instead of TID
In both programs, key the map on the TGID — bpf_get_current_pid_tgid() >> 32 — instead of the TID. (Note the entry program computes tid directly and has no id variable, so you’re changing the masked expression in each, not reusing an id.) The collision only shows up when several threads of one process (one shared TGID, many TIDs) read concurrently — separate processes each have a distinct TGID, so they never clash. Drive that with a single multi-threaded reader:
python3 - <<'EOF'
import threading, time
def r():
    while True:
        with open('/etc/passwd') as f:
            f.read()
for _ in range(8):
    threading.Thread(target=r, daemon=True).start()
time.sleep(10)
EOF
All 8 threads share one TGID and all call vfs_read, so a TGID-keyed map collides on every concurrent read: when thread B’s fentry overwrites thread A’s start timestamp with B’s own (later) timestamp, A’s fexit then reads B’s timestamp and computes a bogus delta. Watch your output. Two symptoms dominate. First, understated durations: bpf_ktime_get_ns is monotonic, so the timestamp sitting in the slot is essentially always earlier than the now a later fexit reads — the subtraction stays positive but tiny (now - ts_B instead of the true now - ts_A), so latencies come out implausibly low. Second, the event count drops: whichever thread’s fexit runs first deletes the shared slot, so the other thread’s fexit finds no entry (bpf_map_lookup_elem returns NULL) and silently bails. (A giant ~10^18 “underflowed” duration is not the expected symptom with a monotonic clock — that would require the stored timestamp to be greater than now, which only happens in a narrow race where another CPU’s fentry rewrites the slot value between this fexit’s clock read and its dereference; it’s a rare artifact, not the headline.) Contrast with TID keying: one entry per thread, so deltas stay correct and no events are lost.
Lesson stays: TID for synchronous per-thread tracking.
Break 3 — Drop the null check in fexit
__u64 *ts = bpf_map_lookup_elem(&starts, &tid);
__u64 dur = bpf_ktime_get_ns() - *ts;   // no null check
Verifier rejects with the same R0 type=map_value_or_null error from Day 4. Re-read the log; the rejection should now feel completely unsurprising.
Break 4 — Convert to kretprobe
Change SEC("fexit/vfs_read") to SEC("kretprobe/vfs_read"). Rebuild. Things break:
BPF_PROGmacro doesn’t know about kretprobe — useBPF_KRETPROBEinstead.- The argument list is wrong. kretprobe’s ctx is
struct pt_regs *, not the typed args + return. You can only get the return value viaPT_REGS_RC(ctx). - You can’t access
f,buf,n, orpos— they were the entry arguments and are gone by now.
This is the operational reason fexit is strictly better. With fexit you have entry args + return value; with kretprobe you have only return value (PT_REGS_RC reads it out of the trampoline’s saved registers) — and, as the mechanism section showed, you also inherit the instance pool, the nmissed burst drops, and the unwinder confusion.
The full equivalent kretprobe version:
SEC("kretprobe/vfs_read")
int BPF_KRETPROBE(on_exit_kretprobe, ssize_t ret)
{
    /* same body, but only `ret` is available */
}
Break 5 — A function that doesn’t always return
Try kernel_clone (the function that implements fork). Most calls return; a few may not (do_exit paths, exotic flags). Run for a long time. Check that the map stays bounded — kernel_clone is well-behaved here. Now try to attach fexit to do_exit itself:
SEC("fentry/do_exit")
int BPF_PROG(on_exit_enter) {
    /* ... store ... */
}

SEC("fexit/do_exit")
int BPF_PROG(on_exit_exit) {
    /* do_exit never returns */
}
On 7.1 this doesn’t even load. The Verifier knows do_exit is marked __noreturn, and it refuses to attach fexit to a function that can never return:
Attaching fexit/fsession/fmod_ret to __noreturn function 'do_exit' is rejected.
The kernel keeps a noreturn_deny BTF set (kernel/bpf/verifier.c) — do_exit, do_group_exit, make_task_dead, __module_put_and_kthread_exit, and friends — and rejects fexit/fmod_ret on any of them at load time. So the leak you might expect here never happens: the Verifier protects you up front.
The leak lesson still stands, though — it just applies to functions the denylist can’t catch. A function that returns on most paths but conditionally doesn’t (a goto into a do_exit call, an unwound error path that calls panic) isn’t __noreturn, so fexit attaches happily — and then silently never fires on the non-returning path, leaking that thread’s map entry. Not every function has a sensible fexit pair. For those, you need a different cleanup strategy (a periodic sweep from userspace, or a tracepoint at task termination such as sched_process_exit).
What to read in the kernel
kernel/bpf/trampoline.c— open it. Searcharch_prepare_bpf_trampoline. The trampoline is generated assembly that saves arguments, calls fentry programs, calls the original function, captures the return value into the ctx array, and calls fexit programs. The ASM is per-arch (x86_64, arm64, etc.) but the structure is consistent.tools/lib/bpf/bpf_tracing.h— searchBPF_PROG. The macro is ~30 lines of variadic-template-style C macros. Read it once. You’ll see how theu64 *ctxarray gets unpacked into typed parameters via((__u64 *)ctx)[N]casts. After this, the macro stops feeling magic.kernel/trace/bpf_trace.c— searchbpf_get_func_argandbpf_get_func_ret(bpf_get_func_ret_protois atbpf_trace.c:1223). These are helper-based access patterns for the same data, used whenBPF_PROG’s positional args don’t fit (e.g., variadic kernel functions).arch/x86/kernel/rethook.c— the hand-writtenarch_rethook_trampoline(:26) whose address a kretprobe swaps onto the stack. Read it once after today and the return-address trick stops being abstract.Documentation/bpf/libbpf/program_types.rst— the official doc listing tracing program types (fentry,fexit,fsession). One read, optional.
Bullet Points
vfs_readis the kernel’s central read chokepoint (fs/read_write.c:554); itsssize_treturn is bytes-read on success or a negative errno on failure — that’s the “→ N bytes” you print.fexitattaches at function return; receives original arguments and the return value as typed parameters.- A kretprobe hooks the return by swapping the saved return address on the stack for a trampoline at entry, using a finite instance pool (
maxactive); bursts beyond the pool are dropped and counted innmissed, and the swap confuses stack unwinders. - Use fexit > kretprobe wherever fexit is available (any function with BTF): same trampoline as fentry, no return-address rewrite, no pool, no missed-on-burst. kretprobe is legacy.
bpf_ktime_get_ns()returnsCLOCK_MONOTONICnanoseconds (excludes suspend, not wall-clock); cheap, ~10ns to call. Perfect for a latency delta, useless for calendar time.- Key per-thread tracers by TID, not TGID. Multi-threaded processes will collide on TGID-keyed maps.
- The latency pattern:
fentrystores entry timestamp keyed by TID;fexitretrieves it, computes duration, deletes the entry, emits the event. - Don’t forget
bpf_map_delete_elem. Tracers that don’t clean up degrade silently as their map fills. - Some kernel functions don’t return (e.g.,
do_exit); fexit-based tracking can’t handle them. The Verifier even rejects fexit on__noreturnfunctions up front. Use a different mechanism (tracepoints, periodic sweeps). BPF_PROGmacro unpacks typed arguments from the trampoline’su64 *ctxarray — same macro for fentry and fexit; fexit just has one extra arg (the return value) at the end.
Check question
You attach an fentry+fexit pair to a function that, on some paths, calls itself recursively. The latency map is keyed by TID. Does the measurement still work?
Click to reveal answer
Answer: No. On the recursive call, the second fentry overwrites the first’s timestamp (same TID). When the inner call’s fexit runs, it reads its own timestamp and deletes the entry. The outer fexit then can’t find any entry — bpf_map_lookup_elem returns NULL, the duration computation is skipped, and the event is silently dropped. To handle this, you need a recursion-aware key like (tid, depth) where depth is tracked in a percpu map, or you switch to bpf_get_func_ip(ctx) plus stack-allocated counters. Most kernel functions don’t recurse meaningfully, so this rarely matters in practice — but when it does, you’ve found a real subtlety.
Tomorrow
Day 7: the BPF_PROG macro demystified. The ctx array, PT_REGS_* for kprobes, function argument access patterns, and the helper-vs-kfunc distinction. Less hands-on building, more “now you understand what the macros are doing.”
Day 7 — BPF_PROG demystified, ctx layouts, helpers vs kfuncs
Today’s mission: stop thinking of
BPF_PROG/BPF_KPROBE/BPF_KRETPROBEas magic. See what they expand to. Understand why each program type hands you arguments in a different shape — a typed trampoline array, a saved-register snapshot, or a copied event struct — and why the Verifier trusts some of those shapes and not others. Total time: ~120 minutes. Light on coding, heavy on understanding.
Why this day exists
Yesterday you wrote BPF_PROG(on_exit, struct file *f, char *buf, size_t n, loff_t *pos, ssize_t ret) and it just worked. Today we open the hood.
This matters because:
- When you start using non-trivial program types (kprobe, raw tracepoint, sk_msg, sock_ops), the macro and ctx access differ.
- When the macro doesn’t fit your case (variadic functions, exotic signatures), you need to access ctx by hand.
- When the Verifier complains about a register’s type, knowing where that type came from in the proto is the difference between minutes and hours of debugging.
There are three pieces of background you’ve never been shown that every example today leans on:
struct pt_regs— the saved-register snapshot a kprobe hands you, and why offset 0 of it is not the first argument.bpf_printkandtrace_pipe— the debug-output channel today’s lab reads. Days 1–6 sent data out through ringbuf and maps; today is the first time you’ll print straight to the kernel’s shared trace buffer.- What a tracepoint actually is — the
TRACE_EVENTmacro, the generatedtrace_event_raw_*struct, theformatfile, and the raw-args array. Three of today’s five program flavors hang on this.
We’ll teach each as we hit the part that depends on it.
What BPF_PROG actually does
The trampoline calls your BPF program with a single argument — unsigned long long *ctx — pointing at an array of u64 values, one per kernel-function argument (plus, for fexit, the return value at the end).
You don’t want to write (struct file *)ctx[0] everywhere. So BPF_PROG exists.
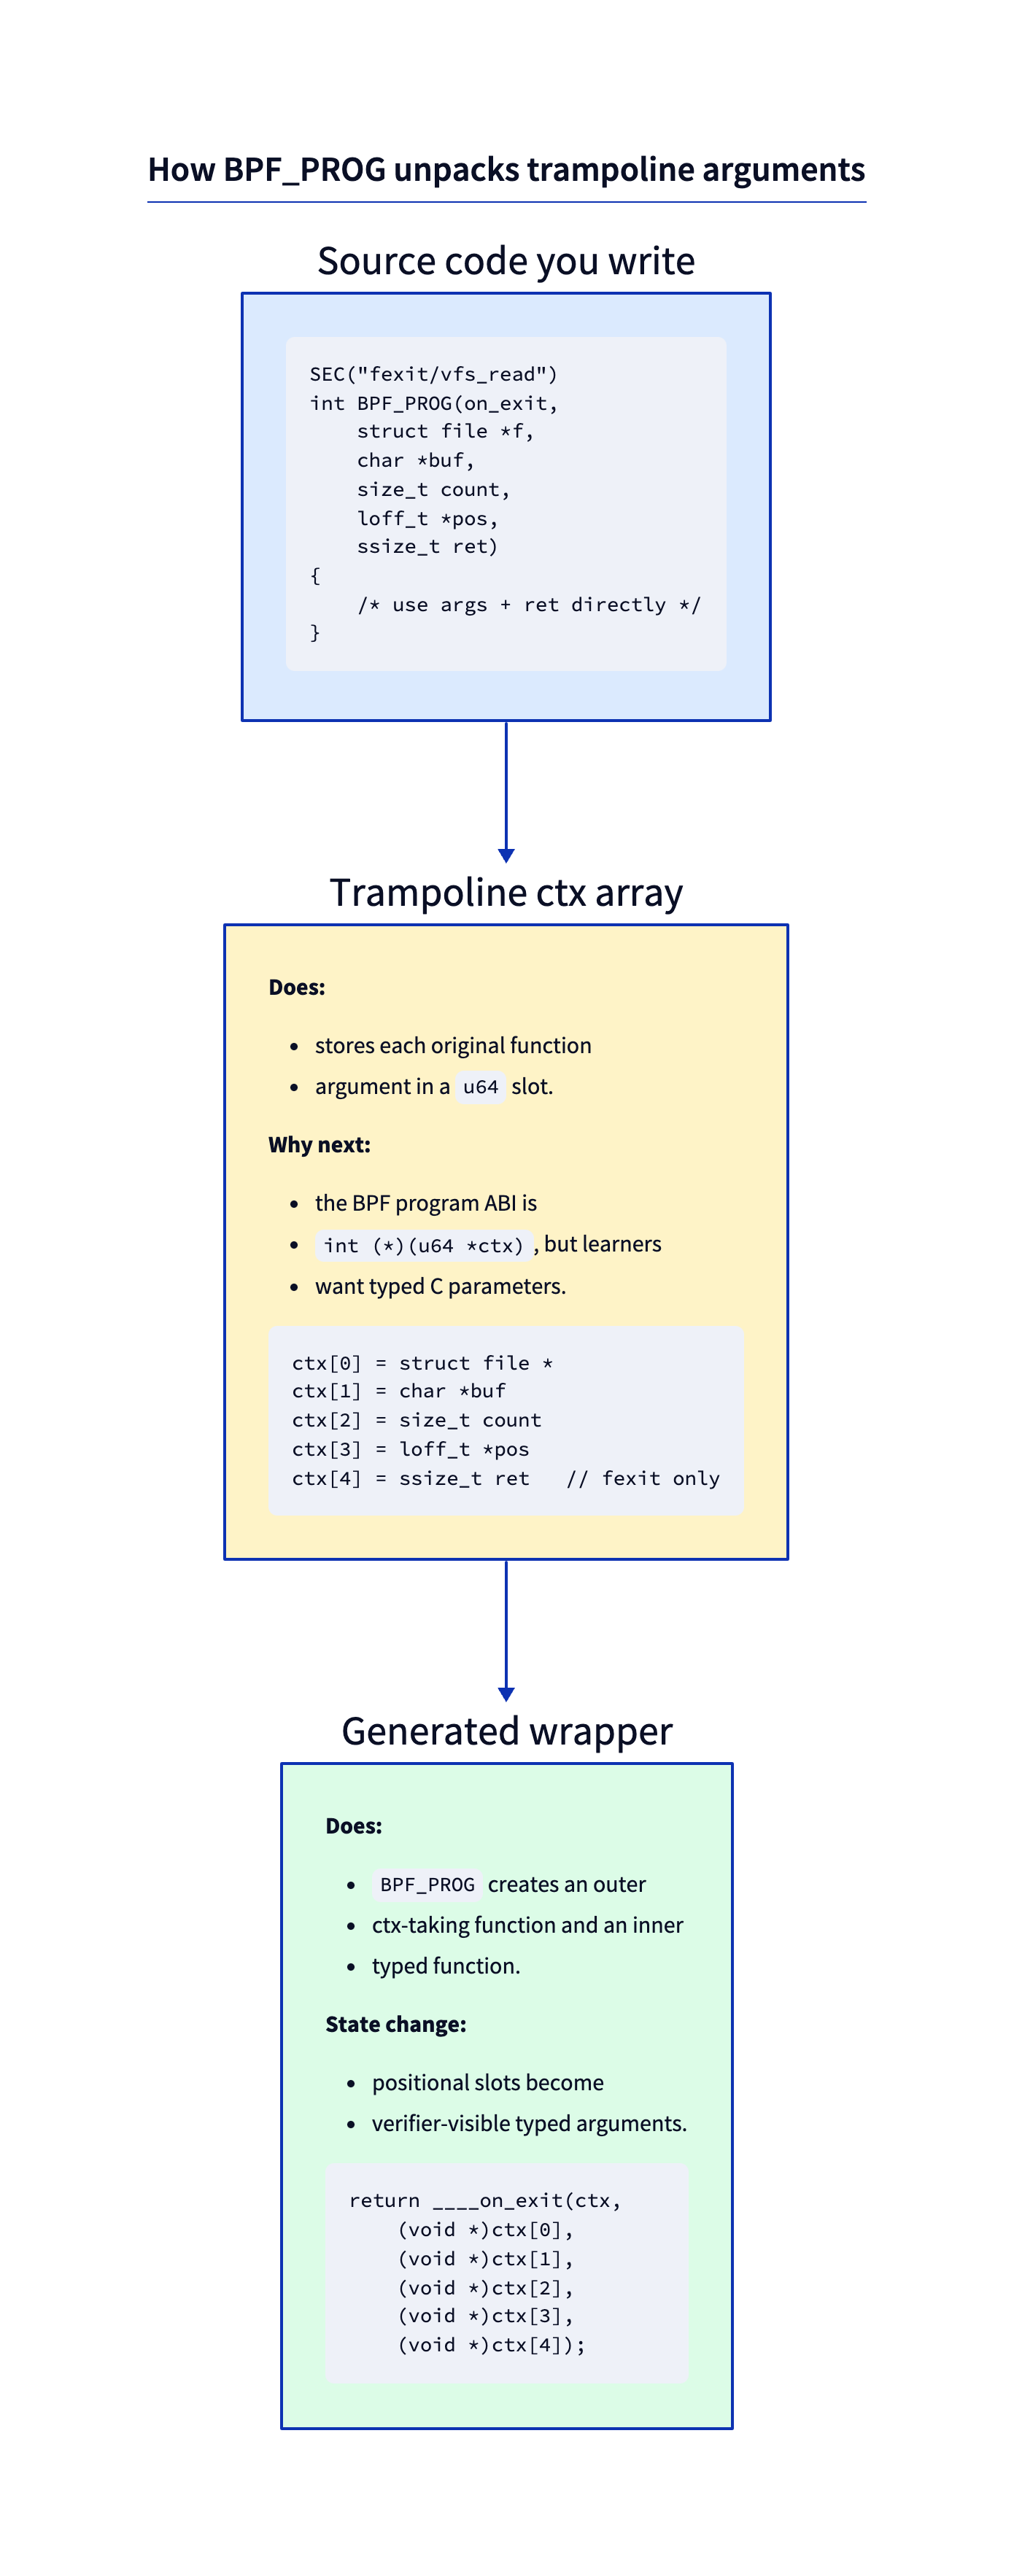
The macro is variadic-template-style C — it generates an outer function that the BPF program calls (taking only ctx), and an inner __always_inline function that takes your typed parameters. The outer function casts each ctx[N] slot to the right type and forwards into the inner.
You can read the actual macro at tools/lib/bpf/bpf_tracing.h:672 (the #define BPF_PROG(name, args...) line). It’s about 30 lines of variadic macros. Worth opening once. After you do, there’s no more magic — BPF_PROG is a code generator that saves you from writing position-based casts. The line that does the real work is its forwarding through ___bpf_ctx_cast, which expands to ctx[0], ctx[1], ctx[2]… — literal indices into that u64 array.
There are no Dumb Questions
Q: How does the macro know how many arguments my function has?
A: C variadic macros (
__VA_ARGS__) plus a counting trick (___bpf_narg) that uses preprocessor recursion to figure out the arity.bpf_tracing.hthen dispatches through___bpf_ctx_castto the right___bpf_ctx_cast0..___bpf_ctx_cast12slot-caster (supporting up to 12 args). The actual implementation is gnarly C macro magic but the concept is simple.Q: What if my function has more than 12 arguments?
A: You’re using the wrong tool. Most kernel functions have ≤ 6 args (matching the System V calling convention). For variadic kernel functions, use
bpf_get_func_arg(ctx, N, &out)— a helper that reads the Nth argument by index and writes it toout(BPF_FUNC_get_func_arg= 183,include/uapi/linux/bpf.h:6088; implemented atkernel/trace/bpf_trace.c:1194). We won’t use it today.Q: Why does
BPF_PROG’s syntax look weird? Why isn’t it just a normal function?A: Because the BPF program’s real signature must be
int (*)(unsigned long long *)— that’s what the trampoline calls. Without the macro, you’d write that signature and unpackctx[]manually. The macro pretends you wrote a normal C function but generates the unpacking glue.
Two shapes of ctx: the trampoline array vs. the register snapshot
Before the five-flavor chart, you need to see clearly that the word “ctx” means two physically different things depending on program type. Get this and half of today’s surprises evaporate.
Shape A — the trampoline u64 ctx[] (fentry/fexit/tp_btf). This is the array you met on Day 1: the trampoline saves the traced function’s arguments into a small u64[] and hands you a pointer to it. ctx[0] is the first typed argument, ctx[1] the second, and so on. BPF_PROG indexes straight into it (___bpf_ctx_cast → ctx[0], ctx[1]…), which is why BPF_PROG’s forwarding lives at bpf_tracing.h:672.
Shape B — the struct pt_regs * snapshot (kprobe/kretprobe). A kprobe doesn’t get a tidy array. Recall from Day 1: a kprobe fires via the int3 trap — the kernel overwrites the first byte of the traced instruction with a breakpoint, and when the CPU hits it the trap handler runs. At that moment the handler captures every general-purpose register into a struct pt_regs and hands your program a pointer to that. So a kprobe’s ctx is a frozen photograph of the CPU registers, not a per-argument array.
That difference is the whole reason BPF_KPROBE is a separate macro from BPF_PROG. BPF_KPROBE (tools/lib/bpf/bpf_tracing.h:816) declares ctx as struct pt_regs * and, instead of indexing an array, forwards each argument through PT_REGS_PARM1, PT_REGS_PARM2, … — macros that read a named register slot out of the snapshot.
Why offset 0 of pt_regs is the saved r15, not your first argument
Here is the layout that makes every “+112”, “+0x70”, “+0x60” you’ll see today legible. The x86-64 struct pt_regs is at arch/x86/include/asm/ptrace.h:103, and its fields are laid out in this exact order:
/* arch/x86/include/asm/ptrace.h:103 — x86-64 struct pt_regs */
unsigned long r15;   /* offset 0x00  ← FIRST member */
unsigned long r14;   /* 0x08 */
unsigned long r13;   /* 0x10 */
unsigned long r12;   /* 0x18 */
unsigned long bp;    /* 0x20 */
unsigned long bx;    /* 0x28 */
unsigned long r11;   /* 0x30 */
unsigned long r10;   /* 0x38 */
unsigned long r9;    /* 0x40 */
unsigned long r8;    /* 0x48 */
unsigned long ax;    /* 0x50 */
unsigned long cx;    /* 0x58 */
unsigned long dx;    /* 0x60  ← arg3 */
unsigned long si;    /* 0x68  ← arg2 */
unsigned long di;    /* 0x70  ← arg1 */
/* ... orig_ax, ip, cs, flags, sp, ss ... */
Two facts fall straight out of this picture:
- Byte offset 0 is
r15— a callee-saved register that has nothing to do with your function’s arguments. This is exactly why Break 2 below produces garbage: when you (wrongly) putBPF_PROGon a kprobe, the macro reads “ctx[0]” = the 8 bytes at offset 0 = the savedr15, casts it tostruct file *, and you’re off into the weeds. disits 15th in the struct → offset 14 × 8 = 112 =0x70. That’s the number you’ll see the kprobe program load from in both the verifier log (r1 +112) and the disassembly (r1 + 0x70).dxis 13th → offset 96 =0x60(arg3).
The layout is deliberately arch-specific. There’s a separate 32-bit struct pt_regs at arch/x86/include/asm/ptrace.h:12 that starts bx, cx, dx, si, di, … — a completely different order. The offsets only make sense once you’ve pinned down the architecture, which is why the build needs -D__TARGET_ARCH_x86 (more on that at the lab).
Mapping System V arguments onto register slots
Recall from Day 1: the System V x86-64 calling convention passes the first integer/pointer argument in rdi, the second in rsi, the third in rdx. The PT_REGS_PARM* macros are just that convention written down. In tools/lib/bpf/bpf_tracing.h:
/* tools/lib/bpf/bpf_tracing.h:87 */
#define __PT_PARM1_REG di
#define __PT_PARM2_REG si
#define __PT_PARM3_REG dx
...
/* tools/lib/bpf/bpf_tracing.h:492 */
#define PT_REGS_PARM1(x) (__PT_REGS_CAST(x)->__PT_PARM1_REG)
So PT_REGS_PARM1(ctx) reads ctx->di, PT_REGS_PARM2(ctx) reads ctx->si, PT_REGS_PARM3(ctx) reads ctx->dx. This is the bridge that makes the disassembly’s “+0x70 = di = PT_REGS_PARM1 = f” and “+0x60 = dx” lines readable: argument 1 of vfs_read is struct file *f, it was passed in rdi, the trap saved rdi at offset 0x70, and the kprobe program loads f from there.
Contrast the two shapes one more time: fentry hands you the trampoline’s u64 ctx[] where ctx[0] genuinely is the typed first argument; kprobe hands you pt_regs where you must dig the argument out of a named register slot. That is why BPF_PROG indexes ctx[] and BPF_KPROBE wraps PT_REGS_PARM*. Same data, two different containers.
![Side-by-side fentry trampoline ctx[] vs struct pt_regs register snapshot](diagrams/day07_ctx_vs_ptregs.png)
What a tracepoint actually is
Three of today’s five flavors (regular tracepoint, raw tracepoint, tp_btf) hook a tracepoint, and you’ve only ever seen the word in passing. Let’s make it concrete, because the structs those flavors declare come from a specific macro and live in a specific file.
A tracepoint is a named, static instrumentation site compiled into the kernel — sched_switch, sys_enter, kfree_skb, and hundreds more. Unlike fentry or kprobe, which hook an arbitrary function you name, a tracepoint is a deliberately placed, stable hook with a declared field schema. Kernel developers put it where it’s useful and promise to keep its fields meaningful across releases.
Every tracepoint is declared with the TRACE_EVENT() macro:
/* include/linux/tracepoint.h:671 */
#define TRACE_EVENT(name, proto, args, struct, assign, print) ...
That one macro generates a lot of code. The piece you care about today is a C struct describing the event’s copied payload:
/* include/trace/trace_events.h:62 — generated for every tracepoint */
struct trace_event_raw_##name {
    ...
};
So sched_switch gets a struct trace_event_raw_sched_switch, sys_enter gets a struct trace_event_raw_sys_enter, and so on. These structs are compiled into the kernel and end up in its BTF, which is why they appear in your vmlinux.h and why the flavor-3 program below can just declare struct trace_event_raw_sys_enter *ctx without defining it.
The crucial property: the kernel copies the chosen fields into that struct. When the tracepoint fires, it fills a trace_event_raw_* instance with the selected values and hands your program a pointer to those copied bytes — not to live kernel objects. That single fact explains Break 3 at the bottom: you can read ctx->prev_comm directly (it’s an embedded char array, copied in for you), but you cannot reach the parent task, because no pointer to it was ever copied.
The format file: a tracepoint’s public schema
Because a tracepoint has a declared schema, the kernel exposes it in human-readable form under tracefs:
sudo cat /sys/kernel/tracing/events/raw_syscalls/sys_enter/format
For sys_enter you’ll see fields including long id and unsigned long args[6]. (Note the path is raw_syscalls/, not syscalls/: the syscalls/ directory holds only the per-syscall nodes like sys_enter_read, whose format lists typed fields fd/buf/count. The generic id + args[6] schema that the flavor-3 program reads is the raw_syscalls:sys_enter tracepoint.) That’s not a coincidence — it comes straight from the declaration in include/trace/events/syscalls.h:18:
/* include/trace/events/syscalls.h:18 */
TRACE_EVENT_SYSCALL(sys_enter,
    TP_PROTO(struct pt_regs *regs, long id),
    ...
    TP_STRUCT__entry(
        __field( long,          id        )
        __array( unsigned long, args, 6   )
    ),
    ...
The __array(unsigned long, args, 6) is why the flavor-3 program reads ctx->args[0] to get the syscall’s first argument (the fd for read()): the kernel copied all six syscall arguments into that args[6] array for you. The format file is the contract; ctx->args[0] is you reading it.
Raw tracepoints: skip the copy, get positional u64s
A raw tracepoint (flavor 4) is the same instrumentation site without the copy step. Instead of a typed trace_event_raw_* struct, the kernel hands you:
/* include/uapi/linux/bpf.h:7286 */
struct bpf_raw_tracepoint_args {
    __u64 args[0];
};
That’s it — a bare array of __u64, one slot per TP_PROTO argument, unmodified. For sched_switch the TP_PROTO is (bool preempt, struct task_struct *prev, struct task_struct *next, …), so ctx->args[0] is the preempt bool, ctx->args[1] is a task_struct * you cast by hand, ctx->args[2] the next one. No fields are copied, no schema is applied; you unpack by position and you’re responsible for the casts.
tp_btf (flavor 5, detailed tomorrow) is the same raw argument array, but BTF-typed: the Verifier knows args[1] is a struct task_struct * and marks it PTR_TO_BTF_ID (recall from Day 1: a trusted, typed kernel pointer the Verifier will let you dereference), so you can dereference it directly. Raw args, but trusted.
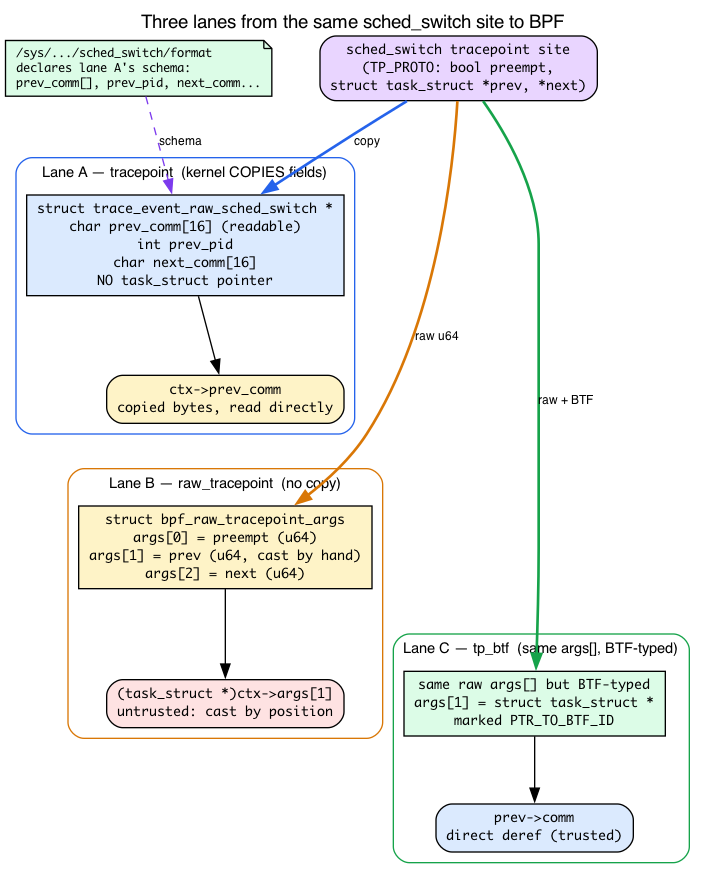
Argument access by program type — five flavors
Different program types access arguments five different ways. This is the chart you’ll come back to whenever you’re confused about a “wrong type” verifier rejection — and now you have the background to read every row of it.
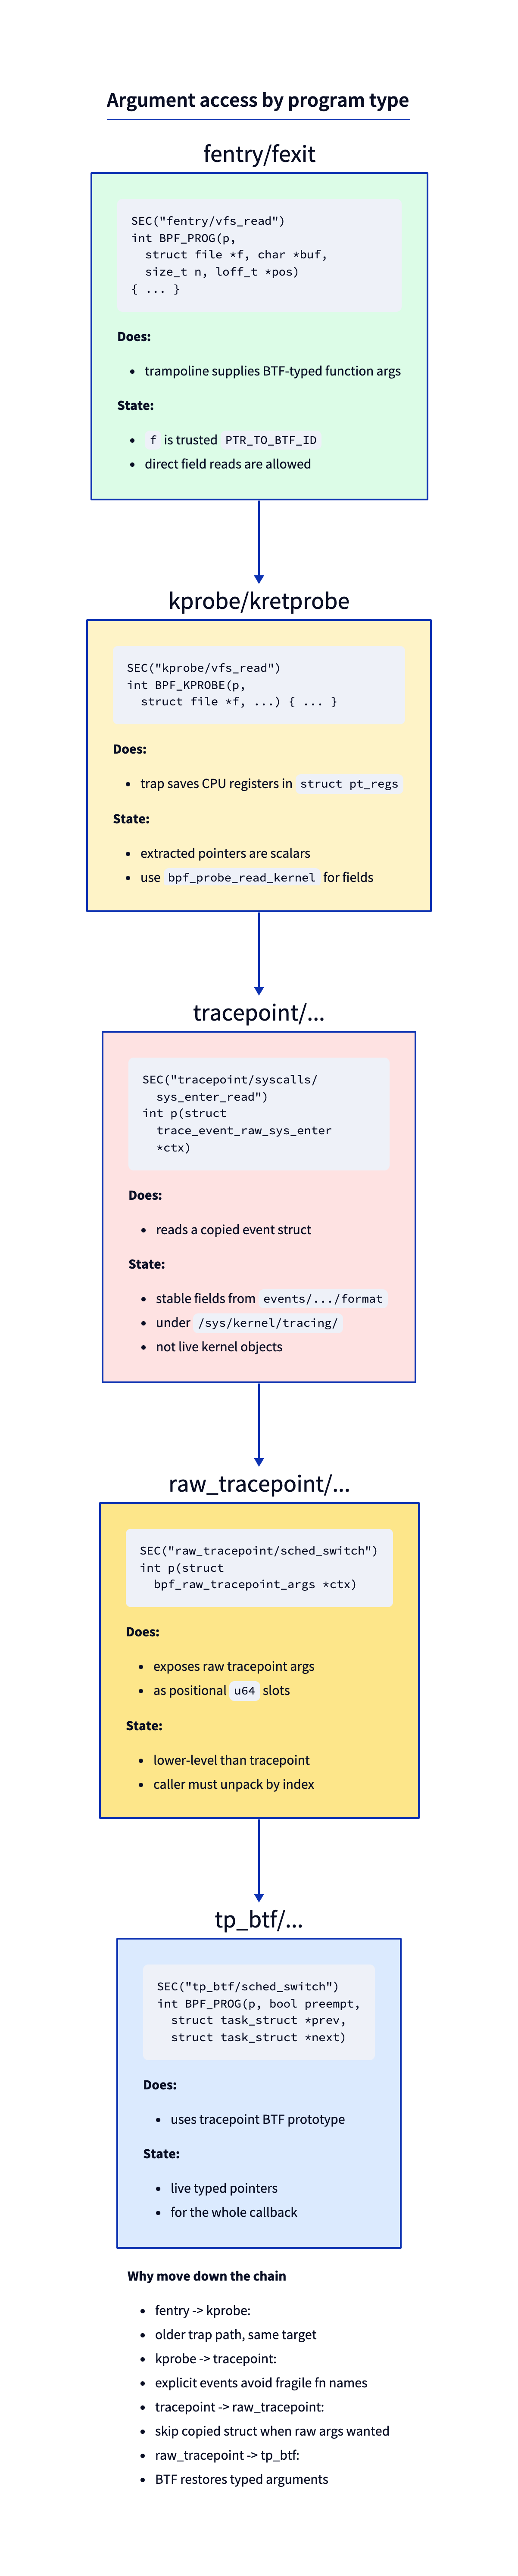
1. fentry/fexit — typed args from BTF
SEC("fentry/vfs_read")
int BPF_PROG(p, struct file *f, char *buf, size_t n, loff_t *pos) {
    loff_t cur = f->f_pos;   // direct deref allowed
}
The trampoline gives you a u64 *ctx. BPF_PROG casts each slot to your declared type. Because BTF has the original function’s signature, the cast is meaningful — f really is a struct file * pointing at a live kernel object. The Verifier marks f as PTR_TO_BTF_ID (typed kernel pointer), allowing direct dereference of fields.
Pros: typed, fast, direct deref. Cons: requires BTF (essentially always present in modern kernels).
2. kprobe/kretprobe — pt_regs from a trap
SEC("kprobe/vfs_read")
int BPF_KPROBE(p, struct file *f, char *buf, size_t n, loff_t *pos) {
    /* f is pt_regs->di on x86_64 */
}
BPF_KPROBE is a different macro that knows ctx is struct pt_regs * (a saved register snapshot from the entry trap). It expands to ((struct file *)PT_REGS_PARM1(ctx)) for the first argument, etc. The values are correct — they’re whatever was in RDI, RSI, etc. when the int3 fired — but the pointers are not marked as PTR_TO_BTF_ID because the Verifier can’t trust them in a kprobe context (the function’s BTF signature isn’t bound to the regs).
You access fields via bpf_probe_read_kernel:
loff_t pos;
bpf_probe_read_kernel(&pos, sizeof(pos), &f->f_pos);
This is why kprobes feel clunkier than fentry. Same data, more friction.
3. tracepoint/... — copied event context
SEC("tracepoint/syscalls/sys_enter_read")
int p(struct trace_event_raw_sys_enter *ctx) {
    int fd = (int)ctx->args[0];
}
The regular tracepoint program sees a stable kernel-defined event struct. The kernel copies the relevant fields into that per-tracepoint struct, and ctx points at the copied bytes. You don’t get live pointers. Useful when you want the stable event format in /sys/kernel/tracing/events/.../format.
4. raw_tracepoint/... — raw tracepoint argument array
SEC("raw_tracepoint/sched_switch")
int p(struct bpf_raw_tracepoint_args *ctx) {
    bool preempt = (bool)ctx->args[0];
    struct task_struct *prev = (void *)ctx->args[1];
    struct task_struct *next = (void *)ctx->args[2];
}
Raw tracepoints skip the copied event struct and expose the tracepoint arguments as raw u64 slots. You unpack by position. The verifier does not give you the same typed-argument ergonomics as tp_btf, so new code usually prefers tp_btf when BTF is available.
5. tp_btf — typed kernel pointers from a tracepoint
SEC("tp_btf/sched_switch")
int BPF_PROG(p, bool preempt, struct task_struct *prev, struct task_struct *next) {
    bpf_printk("%s -> %s", prev->comm, next->comm);  // direct deref
}
This is the modern typed interface to the same tracepoint event. The kernel hands you typed pointers (BTF-tagged) rather than copied bytes or raw positional slots. Direct deref works. Use tp_btf instead of raw tracepoint for new code when BTF is available — we’ll see this in detail tomorrow.
Sharpen your pencil
A function
int foo(struct file *f, void *data, size_t len)is in the kernel. You attach an fentry. You want to readf->f_inode->i_ino. Three ways to do it:
__u64 ino = f->f_inode->i_ino;__u64 ino = BPF_CORE_READ(f, f_inode, i_ino);(CO-RE, from Day 3 — walks the pointer chain with relocations, each hop viabpf_probe_read_kernel)__u64 ino; bpf_probe_read_kernel(&ino, sizeof(ino), &f->f_inode->i_ino);Which works? Which is preferred?
.
.
.Answers: All three load. (1) and (2) work cleanly because
fisPTR_TO_BTF_IDand the Verifier proves the chain. (1) is fastest: it’s a direct verified load — the Verifier permits the deref as a plain BPF load (LDX) and records it in the kernel exception table for fault handling, so there’s no helper call and nothing lowers tobpf_probe_read_kernel. (2) is safe-by-default (returns 0 on bad pointer) and is what (3) is the explicit form of —BPF_CORE_READlowers tobpf_probe_read_kernel. Prefer (1) for trusted chains, (2) for chains where any hop could be NULL. (3) is rarely written by hand anymore.
Helpers vs kfuncs — the two extension mechanisms
Yesterday you used bpf_get_current_pid_tgid, bpf_ktime_get_ns, bpf_map_lookup_elem. Those are helpers — a frozen UAPI list of functions BPF programs can call. You declared them via bpf_helpers.h, the linker resolves them to enum values (BPF_FUNC_get_current_pid_tgid = 14, etc.), and at load time the verifier/JIT resolves the call against a per-program-type proto table.
But there’s a second, newer mechanism: kfuncs. Functions declared in any kernel C file, registered via BTF_KFUNCS_START, that BPF programs can call by name (matched against kernel BTF at load time).
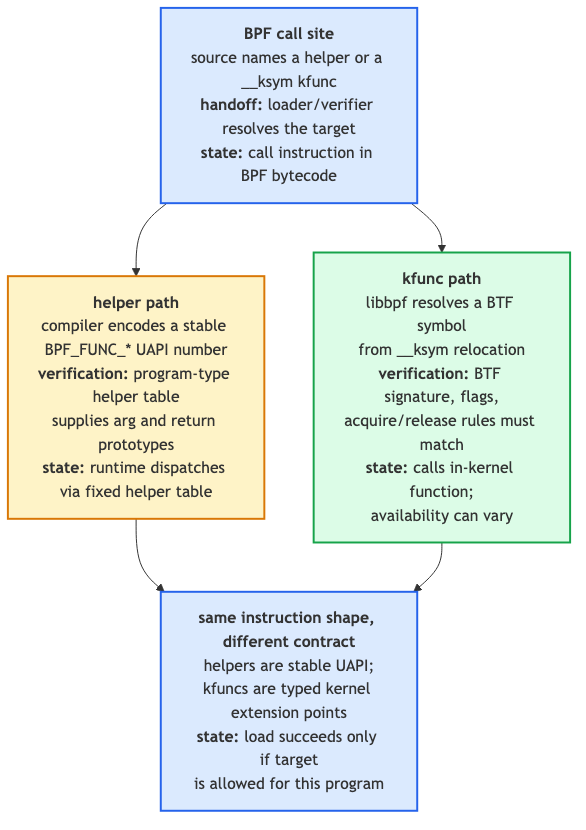
Why both exist:
- Helpers are frozen UAPI. Adding a helper is a forever commitment; removing or changing one breaks user programs. Process to add a helper is heavyweight.
- kfuncs are not UAPI. They can evolve, be added, removed, renamed. The maintainers can change a kfunc’s signature in the next release; user programs that use the old name fail to load on the new kernel. Lower commitment.
Around 2022, the kernel community decided to stop adding new helpers and add functionality as kfuncs instead. This is why your “use this BPF feature” docs from 2024+ talk about kfuncs more than helpers.
You’ll meet kfuncs properly on Day 20. For now, just know: when you see extern struct task_struct *bpf_task_acquire(struct task_struct *) __ksym;, that’s a kfunc. The __ksym attribute tells libbpf “match this name to a kfunc in kernel BTF at load time.”
There are no Dumb Questions
Q: How do I know if
bpf_xxxis a helper or a kfunc?A: Helpers are listed in
include/uapi/linux/bpf.h(theenum bpf_func_idtable starting withBPF_FUNC_unspec). Kfuncs aren’t UAPI; their list lives in source files viaBTF_KFUNCS_STARTblocks.bpftool feature probeshows what’s available on your kernel. Or just check: does it appear in<bpf/bpf_helpers.h>? If yes, helper. If no but you see__ksym, kfunc.Q: Are helpers going away?
A: No. Existing helpers are stable forever (UAPI). New functionality comes as kfuncs. So the helper list will keep working but won’t grow.
bpf_printk and the trace_pipe debug channel
Today’s lab is the first in this book to use bpf_printk, so let’s be precise about what it is — because it does not go through the ringbuf or maps you’ve used on Days 1–6.
bpf_printk is not a function — it’s a libbpf macro. It builds a format string and dispatches to a helper:
/* tools/lib/bpf/bpf_helpers.h:341 */
#define bpf_printk(fmt, args...) ___bpf_pick_printk(args)(fmt, ##args)
The dispatcher ___bpf_pick_printk (bpf_helpers.h:334) picks the lowering by argument count. For ≤3 args it selects the __bpf_printk path (bpf_helpers.h:293), whose underlying helper is bpf_trace_printk — BPF_FUNC_trace_printk = 6 in the UAPI enum:
/* include/uapi/linux/bpf.h:5911 */
FN(trace_printk, 6, ##ctx) \
For 4 or more args it selects a different path — __bpf_vprintk (bpf_helpers.h:304) — which calls a separate helper, bpf_trace_vprintk (BPF_FUNC_trace_vprintk = 177, include/uapi/linux/bpf.h:6082). So the underlying helper is not the same either way: FN 6 for the short form, FN 177 for the wide form.
Where does the output go? Not into your own ringbuf or map — into the kernel’s shared ftrace ring buffer, a single system-wide buffer that every bpf_printk user writes to. You read it from userspace through a tracefs file:
sudo cat /sys/kernel/tracing/trace_pipe
trace_pipe is a blocking, drain-on-read pipe: cat it and it blocks until a line appears, and reading a line consumes it. Because the buffer is global, you’ll see lines from every BPF program on the system that calls bpf_printk, interleaved. That’s exactly why today’s “observe all three” experiment can simply cat trace_pipe and watch three different programs’ output land in one stream.
How many format arguments? Up to 12. Each path has its own ceiling. The bpf_trace_printk helper (the ≤3 path) builds a fixed three-slot array:
/* kernel/trace/bpf_trace.c:359 */
#define MAX_TRACE_PRINTK_VARARGS 3
/* kernel/trace/bpf_trace.c:362 */
BPF_CALL_5(bpf_trace_printk, char *, fmt, u32, fmt_size, u64, arg1,
           u64, arg2, u64, arg3)
{
    u64 args[MAX_TRACE_PRINTK_VARARGS] = { arg1, arg2, arg3 };
    ...
}
But that MAX_TRACE_PRINTK_VARARGS = 3 is the limit of the legacy bpf_trace_printk helper only — not of the bpf_printk macro. Pass a fourth value and the dispatcher transparently switches you to bpf_trace_vprintk (FN 177), which packs the args into a u64[] and allows up to MAX_BPRINTF_VARARGS = 12 (include/linux/bpf.h:3875; the bound is enforced in bpf_trace.c:424 as data_len > MAX_BPRINTF_VARARGS * 8). So bpf_printk("%d %d %d %d", a, b, c, d) compiles and loads fine — only a 13th argument is rejected. Today’s lab passes only two values per call because that’s all each line needs, not because of a ceiling.
Framing: bpf_printk is a debugging and teaching tool. It’s global, low-throughput, and serializes all writers — fine for “did my program fire and what did it see?”, wrong for production. Real tracers stream through the ringbuf and maps you already learned. That’s exactly why the book waited until a “poke at the macros” day to introduce it.
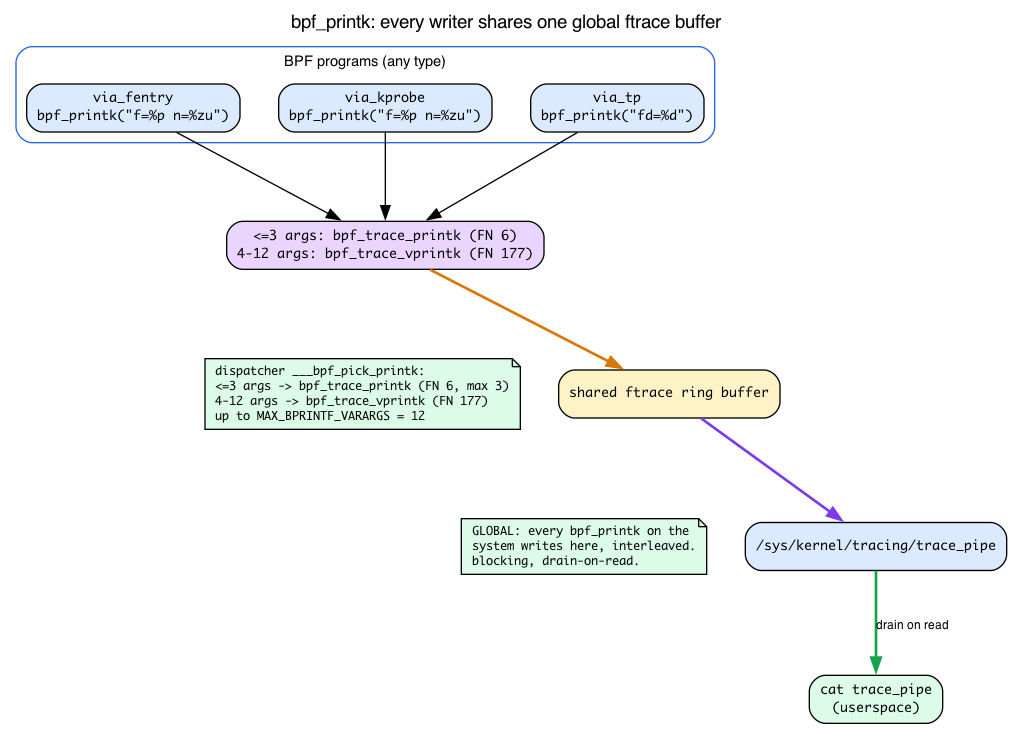
Today’s lab — small, focused
We’re not building a new tracer today. We’re poking at what the macros emit.
inspect.bpf.c
#include "vmlinux.h"
#include <bpf/bpf_helpers.h>
#include <bpf/bpf_tracing.h>

char LICENSE[] SEC("license") = "GPL";

/* Same logic, three different program types */

SEC("fentry/vfs_read")
int BPF_PROG(via_fentry, struct file *f, char *buf, size_t n, loff_t *pos)
{
    bpf_printk("fentry: f=%p n=%zu", f, n);
    return 0;
}

SEC("kprobe/vfs_read")
int BPF_KPROBE(via_kprobe, struct file *f, char *buf, size_t n, loff_t *pos)
{
    bpf_printk("kprobe: f=%p n=%zu", f, n);
    return 0;
}

SEC("tracepoint/syscalls/sys_enter_read")
int via_tp(struct trace_event_raw_sys_enter *ctx)
{
    int fd = (int)ctx->args[0];
    bpf_printk("tp: fd=%d", fd);
    return 0;
}
Notice each bpf_printk passes at most two values (f and n, or just fd) — not because of any ceiling (the macro supports up to 12), but simply because that’s all each line needs. And via_tp reaches the fd through ctx->args[0], exactly the args[6] slot the sys_enter format file declares.
First generate the type header if you don’t already have it from Day 1, then build the object. The -D__TARGET_ARCH_x86 is required: BPF_KPROBE expands to the arch-specific PT_REGS_PARM* macros (which select di/si/dx for x86-64), and without it the compile fails — there’d be no way to know which register order to use.
# once per kernel, if you don't already have vmlinux.h from Day 1:
sudo bpftool btf dump file /sys/kernel/btf/vmlinux format c > vmlinux.h

clang -g -O2 -D__TARGET_ARCH_x86 -target bpf -c inspect.bpf.c -o inspect.bpf.o
The verifier only runs when a program is loaded, and the detailed per-instruction register state only prints at log level 2. Copy Day 6’s loader to inspect.c, point it at inspect.bpf.o, and raise the log level in the open options — the LIBBPF_OPTS line below is wired into the object-open call, which is what makes it take effect:
LIBBPF_OPTS(bpf_object_open_opts, opts, .kernel_log_level = 2);
struct bpf_object *obj = bpf_object__open_file("inspect.bpf.o", &opts);
bpf_object__load(obj);   /* verifier runs here; its log prints to stderr */
make
sudo ./inspect 2>&1 | less
If you have veristat (it ships in the kernel tree under tools/testing/selftests/bpf/, so you may need to build it), you can skip the loader entirely and dump the same per-instruction log: sudo veristat -v -l 2 inspect.bpf.o 2>&1 | less — -v is what emits the log and -l 2 is the log level that prints the R1_w=... register-state lines.
Inspect the verifier log for each program
For via_fentry, you’ll see early register state lines like:
0: R1=ctx() R10=fp0
1: (79) r1 = *(u64 *)(r1 +0)
2: R1_w=trusted_ptr_file(off=0,...)
R1_w=trusted_ptr_file — the Verifier sees R1 as a trusted (BTF-validated) pointer to struct file. That’s why f->f_pos works. Note the load is from +0 — ctx[0], the first slot of the trampoline array.
For via_kprobe:
0: R1=ctx()
1: (79) r1 = *(u64 *)(r1 +112)   /* PT_REGS_PARM1: di on x86_64 */
2: R1_w=scalar()
R1_w=scalar() — kprobe ctx access produces an untrusted scalar, not a typed pointer. That’s why direct deref f->f_pos is forbidden. And there’s the +112 from the pt_regs layout: offset 112 is di, the saved rdi, which held f.
For via_tp:
0: R1=ctx()
1: (61) r2 = *(u32 *)(r1 +16)
2: R2_w=scalar(...)
The tp ctx is a typed struct (provided by vmlinux.h); reads are scalar values from the copied event buffer — exactly the “kernel copied the fields in” model from the tracepoint section.
Inspect what BPF_PROG actually generated
Disassemble the same inspect.bpf.o you built above:
llvm-objdump -dr inspect.bpf.o | head -40
0000000000000000 <via_fentry>:
       0:	r4 = *(u64 *)(r1 + 0x10)
       1:	r3 = *(u64 *)(r1 + 0x0)
       2:	r1 = 0xa ll
       4:	w2 = 0x13
       5:	call 0x6
       6:	w0 = 0x0
       7:	exit
Because the inner ____via_fentry is static __always_inline and we compile at -O2, it is inlined into the single emitted function via_fentry — there is no separate inner function and no call to it. The only call is the bpf_trace_printk helper (call 0x6 — and yes, that 0x6 is BPF_FUNC_trace_printk = 6 from the UAPI enum). You’ll see via_fentry load f from *(u64 *)(r1 + 0x0) (ctx[0]) into r3 and n from *(u64 *)(r1 + 0x10) (ctx[2]) into r4 — the buf/ctx[1] slot at +0x8 is dead and elided. Run the same for via_kprobe and you’ll see it load from pt_regs offsets instead: *(u64 *)(r1 + 0x70) is di = PT_REGS_PARM1 = f (and +0x60 is dx). The two-function shape the macro creates collapses into one function in the object — the macro is purely a source-level code generator.
Observe all three reach the same read
The three programs each print via bpf_printk. Attach them and watch one vfs_read flow through all three paths. Auto-attach the object, then read the trace buffer while you trigger a read — trace_pipe is the shared ftrace buffer from the section above, so all three programs’ lines surface in the one stream:
sudo bpftool prog loadall inspect.bpf.o /sys/fs/bpf/insp autoattach
sudo cat /sys/kernel/tracing/trace_pipe &
dd if=/etc/hostname of=/dev/null bs=64 count=1
You’ll see three lines for the same call (addresses differ on your box; the point is the two f= values match):
             dd-20461   [001] ...21  9183.441: bpf_trace_printk: tp: fd=3
             dd-20461   [001] ...21  9183.441: bpf_trace_printk: fentry: f=ffff8e0c1a3b4500 n=64
             dd-20461   [001] ...21  9183.441: bpf_trace_printk: kprobe: f=ffff8e0c1a3b4500 n=64
fentry and kprobe both hook vfs_read, so the f= pointer for the same call is identical — even though fentry got it from BTF (ctx[0]) and kprobe from pt_regs->di. Same data, two paths. The tracepoint sits one layer up (the read() syscall entry, which later calls vfs_read), which is why it prints fd rather than f. Clean up:
sudo kill %1 2>/dev/null
sudo rm -rf /sys/fs/bpf/insp
What to break, in order
Break 1 — Try to direct-deref in a kprobe
SEC("kprobe/vfs_read")
int BPF_KPROBE(p, struct file *f) {
    loff_t pos = f->f_pos;          /* direct deref */
    bpf_printk("pos=%lld", pos);
    return 0;
}
Drop this into inspect.bpf.c, rebuild, and try to load it — bpftool prog loadall runs the verifier and prints its log to stderr on failure:
clang -g -O2 -D__TARGET_ARCH_x86 -target bpf -c inspect.bpf.c -o inspect.bpf.o
sudo bpftool prog loadall inspect.bpf.o /sys/fs/bpf/x
The verifier rejects it (no pin is created on failure, so there’s nothing to clean up):
R1 invalid mem access 'scalar'
Because in kprobe context, R1 (the cast from pt_regs->di) is a scalar, not a PTR_TO_BTF_ID. Fix:
loff_t pos;
bpf_probe_read_kernel(&pos, sizeof(pos), &f->f_pos);
Break 2 — Use BPF_PROG with kprobe
SEC("kprobe/vfs_read")
int BPF_PROG(p, struct file *f) { ... }
This one loads (verify with sudo bpftool prog loadall inspect.bpf.o /sys/fs/bpf/x — no verifier error — then sudo rm -rf /sys/fs/bpf/x), but the argument access is wrong. BPF_PROG reads ctx[0] — but kprobe’s ctx is pt_regs *, not the trampoline ctx array. As the pt_regs layout showed, offset 0 of struct pt_regs on x86-64 is the saved r15, a callee-saved register that has nothing to do with the first function argument. So BPF_PROG casts the leftover r15 to struct file *: pure garbage. Use BPF_KPROBE for kprobes — it reads PT_REGS_PARM1 = di = offset 112, where f actually lives.
Break 3 — Direct deref in a regular tracepoint
SEC("tracepoint/sched/sched_switch")
int p(struct trace_event_raw_sched_switch *ctx) {
    bpf_printk("%s", ctx->prev_comm);   /* direct read of copied bytes */
}
Works — sudo bpftool prog loadall inspect.bpf.o /sys/fs/bpf/x reports the program loaded with no verifier error (clean up with sudo rm -rf /sys/fs/bpf/x). The ctx->prev_comm is a copied char array embedded in the event struct (the kernel copied it in via TRACE_EVENT), not a pointer. No deref needed.
But:
SEC("tracepoint/sched/sched_switch")
int p(struct trace_event_raw_sched_switch *ctx) {
    /* try to read the parent task's comm */
    /* you can't! ctx doesn't have a task pointer, just the values */
}
Regular tracepoint/... programs give you what the kernel chose to copy. The format file for sched_switch lists prev_comm, prev_pid, next_comm, … — copied scalars and char arrays, no task_struct pointer. Since no pointer was copied, there’s nothing to follow to the parent. For more, switch to tp_btf (Day 8) where you get live typed pointers; use raw_tracepoint/... only when you explicitly want raw positional tracepoint args.
What to read in the kernel
tools/lib/bpf/bpf_tracing.h— the canonical reference forBPF_PROG(:672),BPF_KPROBE(:816),BPF_KRETPROBE,BPF_KSYSCALL, and thePT_REGS_*family (PT_REGS_PARM1at:492, the__PT_PARM1_REG didefinitions from:87). Read all of it. It’s ~930 lines but most is per-arch macros for register names.arch/x86/include/asm/ptrace.h— the 64-bitstruct pt_regs(:103) whose field order (r15first,diat offset 112) is what makes the+0x70/+0x60loads legible, plus the separate 32-bit struct at:12proving the layout is arch-specific.include/uapi/linux/bpf.h— searchenum bpf_func_id. The complete helper list. ~200 entries. Skim — recognize the categories (skb manipulation, map ops, networking, tracing, time, random, etc.). Notetrace_printk= 6 (:5911) andget_func_arg= 183 (:6088), and thestruct bpf_raw_tracepoint_argsat:7286.include/linux/tracepoint.handinclude/trace/trace_events.h—TRACE_EVENT()(tracepoint.h:671) and thestruct trace_event_raw_##name { … }generation site (trace_events.h:62) that produces the structs your tracepoint programs declare.include/trace/events/syscalls.h— thesys_enterdeclaration (:18) with__array(unsigned long, args, 6), proving whyctx->args[0..5]works.kernel/bpf/helpers.c— searchbpf_get_current_pid_tgid_proto. Each helper has abpf_func_protostruct that declares its argument types, return type, and which program types can call it. This is what the Verifier consults when type-checking a helper call.kernel/trace/bpf_trace.c—MAX_TRACE_PRINTK_VARARGS(:359) andbpf_trace_printk_proto(:386), the helperbpf_printklowers to; plusget_func_arg(:1194).net/core/filter.c— searchbpf_helper_changes_pkt_dataorxdp_func_proto. Per-program-type proto tables that gate which helpers a given program can call.Documentation/bpf/btf.rstandDocumentation/bpf/kfuncs.rst— official docs, one read each.
Bullet Points
BPF_PROGis a code generator that unpacks au64 *ctxarray into typed parameters via casts (ctx[0],ctx[1]…).BPF_KPROBE/BPF_KRETPROBEare a different macro: ctx isstruct pt_regs *, a saved-register snapshot from the int3 trap, unpacked viaPT_REGS_PARM*(= named register slots).- On x86-64
struct pt_regsstarts withr15at offset 0, withdx/si/diat0x60/0x68/0x70— soPT_REGS_PARM1readsdiat offset 112, and a strayBPF_PROGon a kprobe readsr15= garbage. - fentry/fexit give you BTF-typed pointers — direct deref OK.
- kprobe gives you scalars from registers — must use
bpf_probe_read_kernel. - A tracepoint is a static
TRACE_EVENT-declared hook; it generates astruct trace_event_raw_<name>and a/sys/.../formatschema. The kernel copies fields in, so you read values but get no live kernel pointers. - Regular tracepoint gives you copied event bytes (
ctx->args[N], embedded char arrays). - Raw tracepoint gives you positional raw args in
struct bpf_raw_tracepoint_args { __u64 args[]; }— the unmodifiedTP_PROTOarguments, cast by hand. - tp_btf gives you those same raw args but BTF-typed (
PTR_TO_BTF_ID) — direct deref, tracepoint stability — modern preference. bpf_printkis a macro that dispatches by arg count: ≤3 args lower to thebpf_trace_printkhelper (FN 6, max 3), 4–12 args to a separatebpf_trace_vprintkhelper (FN 177, maxMAX_BPRINTF_VARARGS= 12). Output lands in the shared ftrace buffer read via/sys/kernel/tracing/trace_pipe. Debug-only, global, serialized — production uses ringbuf/maps.- Helpers are a frozen UAPI list in
include/uapi/linux/bpf.h. Kfuncs are non-UAPI in-tree functions exposed via BTF; they can evolve. New BPF features are added as kfuncs, not helpers. Helper allowance is per program type.
Check question
Why can your fentry program directly deref f->f_pos, but your kprobe program cannot?
Click to reveal answer
Answer: In fentry, the trampoline saves arguments into a u64 ctx[] and BPF_PROG casts them to your declared types. The Verifier matches your declared types against the function’s BTF signature, marking each parameter as PTR_TO_BTF_ID — a trusted, typed kernel pointer the Verifier knows it can deref safely. In kprobe, the ctx is struct pt_regs * — a saved register snapshot from the int3 trap. The Verifier doesn’t bind those register values to the function’s BTF signature (kprobe is generic; it doesn’t know which function it’s tracing at load time the way fentry does). So the cast (struct file *)PT_REGS_PARM1(ctx) — which is really ctx->di, the saved rdi at offset 112 — produces a scalar (SCALAR_VALUE) from the Verifier’s perspective, not a typed pointer. Scalars can’t be derefed; you have to round-trip through bpf_probe_read_kernel, which fault-handles.
Tomorrow
Day 8: tp_btf vs raw tracepoint in depth. We trace sched_switch, get typed task_struct * pointers for both prev and next, and observe scheduling latency without writing any kprobe glue.
Day 8 — Tracepoints, raw vs tp_btf, and how to find them
Today’s mission: measure scheduler latency by hooking
sched_switch. But first understand what that even means — what a context switch is, why a task “waits,” and exactly what number the lab computes. Then learn the anatomy of theTRACE_EVENTmacro that makes a tracepoint exist, how the kernel dispatches a firing tracepoint to its listeners, and why tp_btf is the cheap, powerful way in. Compare raw tracepoint and tp_btf attach modes. Learn how to discover every tracepoint on your kernel and read its format. Total time: ~110 minutes.
Why tracepoints when fentry exists?
Fentry attaches to function entries. That’s perfect when there’s a function whose name describes the event you care about (vfs_read, filename_unlinkat). But many interesting events don’t map to a single function — or they’re emitted from inside a function that does many things.
Tracepoints are explicit instrumentation points added by kernel developers via TRACE_EVENT(...) macros. They name the event, specify the data fields, and live forever as part of the kernel’s API contract.
When you write a tracer for “every context switch,” you don’t want to attach to __schedule and figure out which paths inside it correspond to actual switches. You want sched_switch — the tracepoint that fires once per actual switch with prev and next already determined.
Tracepoints exist for: scheduler events, block I/O, networking, memory allocation, filesystem operations, syscalls, and many more.
First: what is a context switch, and what does “scheduling latency” mean?
The whole lab today computes a number it calls wait_ns and prints lines like firefox [4001] waited 152 µs. Before we hook anything, you need to know what that number is — otherwise it’s just a digit with a unit. So let’s build the scheduler model from scratch. You met task_struct on Day 3 (the kernel’s per-process descriptor); nothing earlier taught you how the scheduler runs those tasks. Here it is.
One CPU runs exactly one task at a time. That’s the whole problem the scheduler solves. You have hundreds of runnable threads and (say) 8 logical CPUs, so at any instant at most 8 threads are physically executing. Everyone else is waiting for a turn.
A run queue is the waiting room. Each CPU has its own run queue (struct rq) — the set of tasks that are runnable (ready to execute, not blocked on I/O or a lock) but aren’t the one currently on the CPU. The scheduler’s job is to repeatedly pick the next task to run from that queue.
A context switch is the hand-off. When the scheduler decides task B should run instead of task A, it performs a context switch: save A’s CPU register state and stack pointer, load B’s, and resume B where it last left off. To the running code, nothing happened — A simply “froze” mid-instruction-stream and will thaw later exactly where it stopped. The function that performs the actual register/stack swap is context_switch():
/* kernel/sched/core.c:5329 */
context_switch(struct rq *rq, struct task_struct *prev,
               struct task_struct *next, struct rq_flags *rf)
Note the two arguments already named prev and next — the outgoing and incoming task_struct. By the time the switch happens, the scheduler has already chosen who runs next.
sched_switch fires once per switch, after the choice is made. A single function drives every voluntary switch (a task blocks on I/O) and every preemptive switch (a task’s time slice expires, or a higher-priority task woke up): __schedule().
/* kernel/sched/core.c:7017 */
static void __sched notrace __schedule(int sched_mode)
Inside it, just before handing off to context_switch, the kernel emits the tracepoint with the already-decided prev and next:
/* kernel/sched/core.c:7186 */
trace_sched_switch(preempt, prev, next, prev_state);
That trace_sched_switch(...) call is the tracepoint firing. Those four arguments — preempt, prev, next, prev_state — are exactly the arguments your tp_btf program will receive. Hold that thought; we’ll cash it in below.
So what is “scheduling latency”? Informally: the gap between the moment a task became runnable (it was put on the run queue) and the moment the CPU actually picked it and started running it. During that gap the task sits in the run queue while other tasks use the CPU. A long gap means the task was ready but couldn’t get a turn — that’s scheduling delay, and it’s what makes an interactive app feel laggy under load.
Be precise about what THIS lab measures. We are not going to install two probes. We record one timestamp per task on every switch-out (when a task becomes prev), and when that same tid later shows up as next (switched back in), we report now - last_run. That is the wall-clock time the task spent off-CPU between two of its own on-CPU stints — the time it was not running. That’s an excellent, cheap proxy for scheduling delay, but it is not the textbook wakeup-to-run latency. The textbook version would also need sched_wakeup to mark the exact instant the task became runnable (it might have been blocked on disk for much of that off-CPU gap, which isn’t the scheduler’s fault). State this to yourself every time you read the output: wait_ns = elapsed off-CPU time between two runs of the same task. Trust the number for what it is.
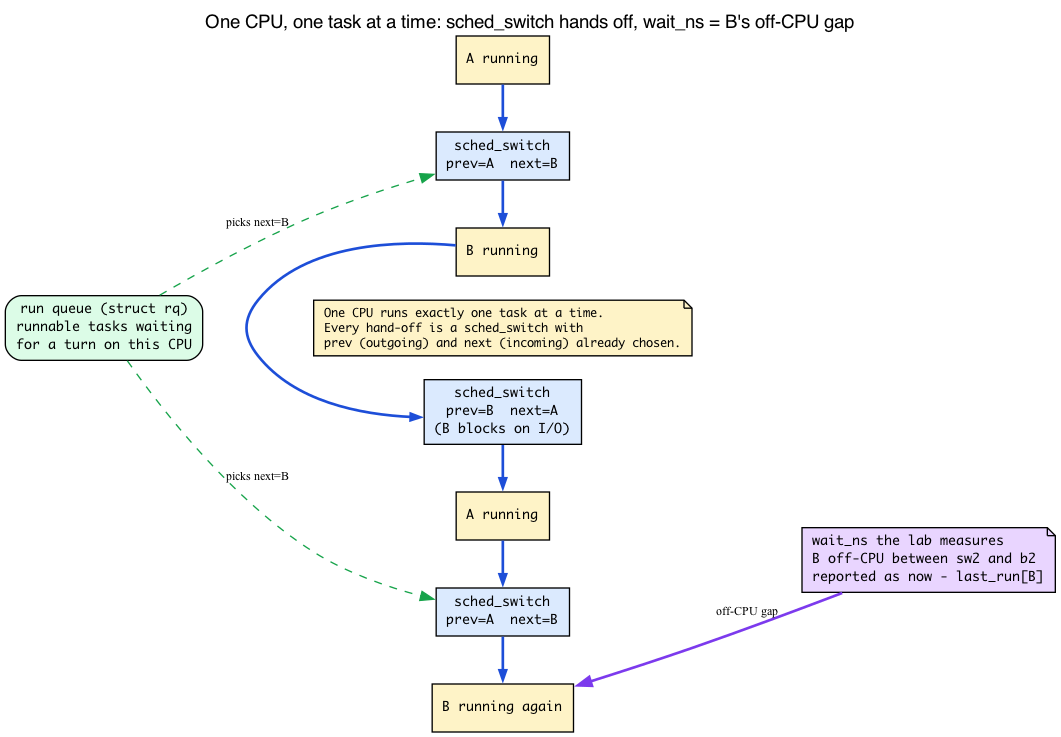
There’s one more payoff from knowing prev and next are full struct task_struct * (Day 3’s descriptor): tp_btf hands you those live typed pointers, so you can read prev->mm, prev->cgroup, prev->real_parent, and anything else in the task. A regular tracepoint, as we’ll see, only hands you a handful of copied fields. That difference is the spine of today’s chapter.
The three BPF-facing ways to attach to a tracepoint
For tracepoint events, BPF has three related section families:
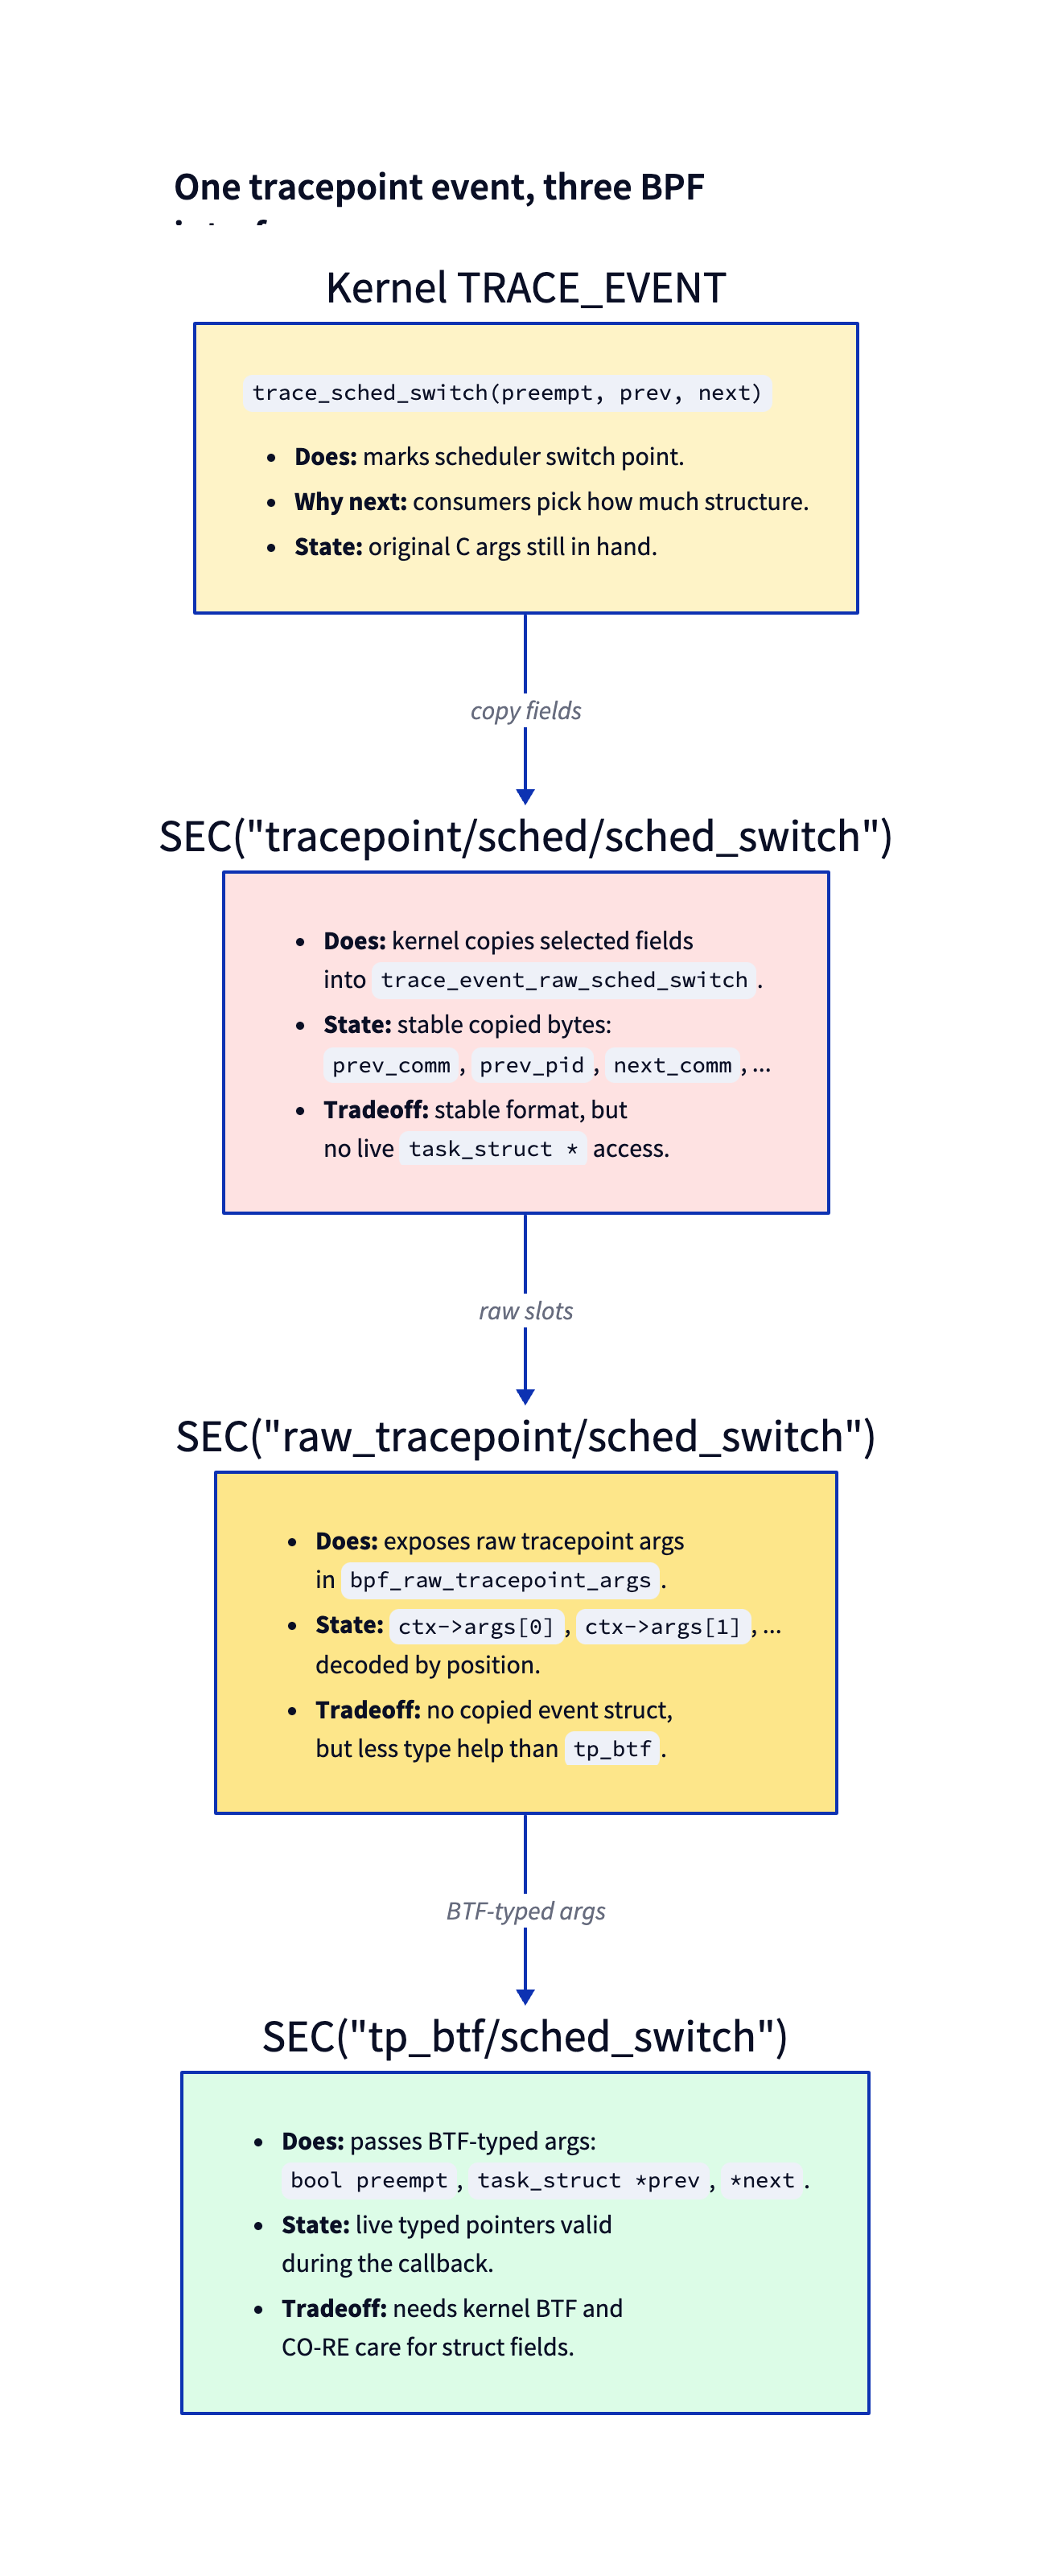
Regular tracepoint (SEC("tracepoint/group/event")) gives you a struct of copied bytes — whatever fields the tracepoint definition chose to copy out. Stable across kernel versions because the tracepoint format is part of the kernel’s API.
Raw tracepoint (SEC("raw_tracepoint/event")) gives you raw positional arguments in struct bpf_raw_tracepoint_args. It avoids the copied event struct, but you unpack by index and lose typed-argument ergonomics.
tp_btf (SEC("tp_btf/event")) gives you the original typed kernel pointers the tracepoint received as arguments. You can dereference fields directly when the pointer is valid for the callback. Same hook, more power.
Same event, three BPF-facing interfaces. The kernel dispatches whichever listener types are attached:
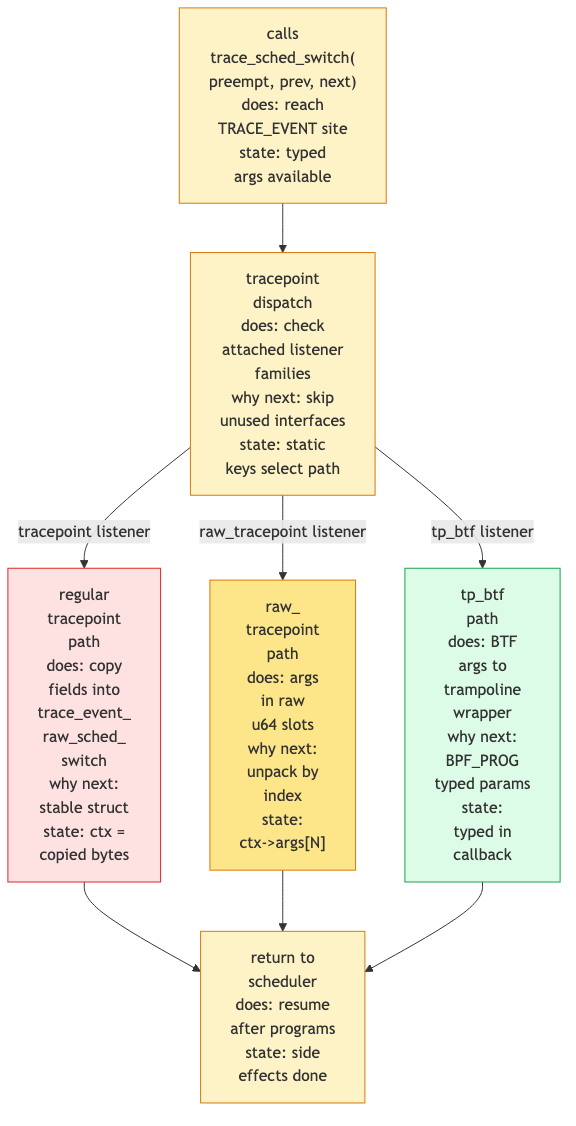
When a tracepoint fires, regular tracepoint/... listeners get the copied event struct, raw_tracepoint/... listeners get raw argument slots, and tp_btf/... listeners get typed arguments. Cost is bounded: the event-struct copy only happens for regular tracepoint listeners.
That “cost is bounded” claim is load-bearing for the whole “use tp_btf, it’s cheaper” thesis — so let’s ground it, because right now it’s just an assertion.
How a firing tracepoint actually reaches its listeners
A tracepoint is not an if in the hot path. It’s a registered list of probe callbacks sitting behind a near-zero-cost static branch. When the tracepoint is off (no listeners), a static-key patch turns it into a fall-through — the CPU pays essentially nothing. When at least one listener attaches, the branch is patched live to call into the dispatch machinery.
That dispatch machinery is a generated per-event function, __traceiter_<event>. Every TRACE_EVENT expands through a chain of macros (TRACE_EVENT → DECLARE_TRACE_EVENT → __DECLARE_TRACE → __DECLARE_TRACE_COMMON), and it is __DECLARE_TRACE_COMMON that generates it:
/* include/linux/tracepoint.h:267 */
extern int __traceiter_##name(data_proto);
and the firing site reaches it through a static call (on a CONFIG_HAVE_STATIC_CALL kernel — the common case today):
/* include/linux/tracepoint.h:227 */
static_call(tp_func_##name)(__data, args);
(On kernels without CONFIG_HAVE_STATIC_CALL, the #else branch at line 231 reaches the same iterator with a plain indirect call: __traceiter_##name(NULL, args).)
When sched_switch fires, __traceiter_sched_switch walks the list of attached probe callbacks and calls each one with the raw TP_PROTO arguments — (preempt, prev, next, prev_state). Crucially: nothing is copied at this layer. The iterator just passes the pointers the kernel already had in registers to each registered function.
So where does the “copied event struct” come from? It’s itself just one probe callback on that list. The probe that performs the TP_fast_assign memcpy (the flat prev_comm@8, prev_pid@24, … struct) is registered only when a regular tracepoint/... (or ftrace/perf) listener attaches. If the only listener is a tp_btf or raw program, that copy probe is never on the list, so the memcpy never runs. That is precisely why the cost is “bounded”: you pay the copy if and only if someone asked for the copied form.
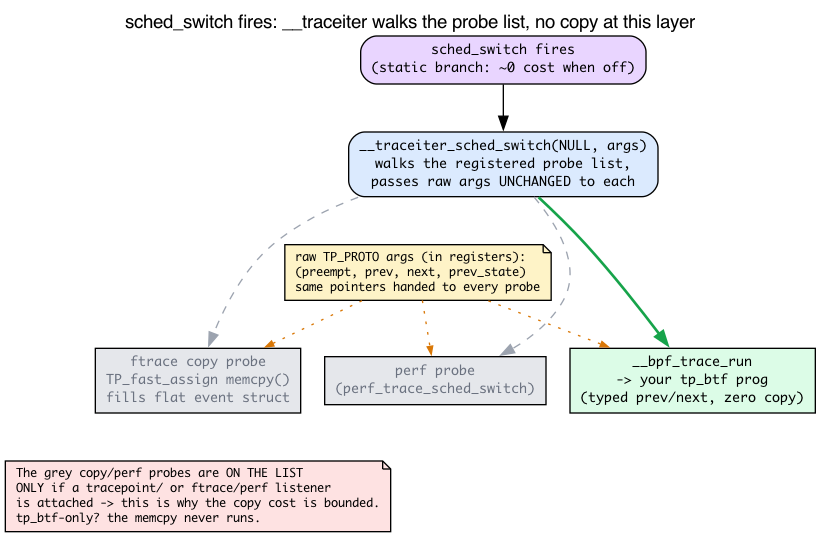
Where BPF plugs in. BPF raw and tp_btf programs attach through the same raw-tracepoint path. libbpf opens a BPF_TRACE_RAW_TP link:
/* kernel/bpf/syscall.c:4388 */
case BPF_TRACE_RAW_TP:
The attach resolves the event name to its raw event map:
/* kernel/trace/bpf_trace.c:2051 */
struct bpf_raw_event_map *bpf_get_raw_tracepoint(const char *name)
and when the tracepoint fires, the BPF dispatch probe on the iterator’s list is __bpf_trace_run, which invokes your program with the raw argument slots:
/* kernel/trace/bpf_trace.c:2073 */
void __bpf_trace_run(struct bpf_raw_tp_link *link, u64 *args)
tp_btf differs from raw in exactly one way: the verifier tags those raw argument slots with their BTF types, so instead of opaque u64s you get a typed struct task_struct *prev. Same path, same __bpf_trace_run, same zero-copy delivery — just type information layered on top. Because tp_btf rides this raw path, it pays neither the per-event struct copy nor a tracefs format lookup: it just receives the pointers the kernel already had in registers. This is the concrete grounding under the chapter’s “tp_btf goes through the same raw-tracepoint path” sentence.
There are no Dumb Questions
Q: If tp_btf is strictly better, why does raw tracepoint still exist?
A: Three reasons. First, history — raw tracepoints predate BTF. Second, raw tracepoints work on kernels without BTF (rare today, but possible). Third, raw tracepoint structs are explicitly stable —
prev_commwill always be a 16-byte char array; the kernel maintainers commit to that. tp_btf gives you livetask_struct *, buttask_structitself isn’t stable across versions (you’d need CO-RE for any field access).Q: How do tracepoints differ from kprobe?
A: Tracepoints are explicitly placed by kernel developers as part of the kernel’s API. Their format is stable. Kprobes are dynamic — you can attach to any function, but the function isn’t part of any contract; it can be renamed, removed, or have its signature change in the next release.
Q: What about
raw_tracepoint(with the underscore)?A: That’s the raw positional-argument mode:
ctx->args[0],ctx->args[1], and so on. It is distinct fromSEC("tracepoint/..."), which receives a copied event struct.tp_btfsupersedes raw tracepoints for most new code on BTF-enabled kernels because it gives typed arguments instead of positional slots.
How to find tracepoints on your kernel
# All tracepoints, grouped by subsystem:
sudo ls /sys/kernel/tracing/events/

# All sched events:
sudo ls /sys/kernel/tracing/events/sched/

# Format of a specific tracepoint (the struct you'd get from raw):
sudo cat /sys/kernel/tracing/events/sched/sched_switch/format
These all need sudo: the tracefs root /sys/kernel/tracing is mounted mode 0700 root:root, so unprivileged users can’t even traverse into events/. (The event subdirectories below it are 0755, and each format file is 0440 root:root, but the root directory gates access to everything underneath.) You’ll see the struct layout, e.g.:
name: sched_switch
ID: 310
format:
	field:char prev_comm[16];	offset:8;	size:16;	signed:0;
	field:pid_t prev_pid;	offset:24;	size:4;	signed:1;
	field:int prev_prio;	offset:28;	size:4;	signed:1;
	field:long prev_state;	offset:32;	size:8;	signed:1;
	field:char next_comm[16];	offset:40;	size:16;	signed:0;
	field:pid_t next_pid;	offset:56;	size:4;	signed:1;
	field:int next_prio;	offset:60;	size:4;	signed:1;
...
Those prev_*/next_* fields are exactly the copied struct a regular tracepoint/... program receives.
Where the format file and the copied bytes actually come from
You just saw two seemingly-unrelated descriptions of the same event: a flat format file with byte offsets, and (earlier) a TP_PROTO(...) C argument list. How does one tracepoint yield both? The answer is the anatomy of the TRACE_EVENT() macro, and once you see it, every “where did that field come from” question dissolves.
Open include/trace/events/sched.h and look at the macro for sched_switch. It has three parts that map directly onto the three attach modes:
/* include/trace/events/sched.h:220 */
TRACE_EVENT(sched_switch,

	/* include/trace/events/sched.h:222 — the C argument list */
	TP_PROTO(bool preempt,
		 struct task_struct *prev,
		 struct task_struct *next,
		 unsigned int prev_state),

	/* include/trace/events/sched.h:229 — the flat per-event struct layout */
	TP_STRUCT__entry(
		__array( char, prev_comm, TASK_COMM_LEN )
		__field( pid_t, prev_pid )
		__field( int, prev_prio )
		__field( long, prev_state )
		__array( char, next_comm, TASK_COMM_LEN )
		__field( pid_t, next_pid )
		__field( int, next_prio )
	),

	/* include/trace/events/sched.h:239 — code that fills the flat struct */
	TP_fast_assign(
		memcpy(__entry->prev_comm, prev->comm, TASK_COMM_LEN); /* :240 */
		__entry->prev_pid = prev->pid;
		/* ...one assignment per field... */
	),
	...
);
Read the three parts as three answers:
TP_PROTOis the C argument list. These become your tp_btfBPF_PROGparameters and the rawargs[]slots. This is the contract the raw path delivers.TP_STRUCT__entrydeclares the layout of the flat per-event struct. This is exactly what theformatfile describes —prev_commfirst (offset 8 after an 8-byte common header), thenprev_pid, and so on. A regulartracepoint/...program receives a pointer to a struct shaped like this.TP_fast_assignis the code that copies live data into that flat struct when the event fires. Thememcpy(__entry->prev_comm, prev->comm, TASK_COMM_LEN)at line 240 is the literal copy — the “copy cost” we said only happens for regular-tracepoint listeners. It’s the body of that one copy-probe on the iterator’s list.
So the offsets you cat out of the format file (prev_comm@8, prev_pid@24, prev_state@32, …) are generated from TP_STRUCT__entry, and the bytes that fill them at runtime are generated from TP_fast_assign. Two faces, one macro.
This is also the airtight reason a regular tracepoint can never reach prev->mm: TP_fast_assign only copied the handful of fields the kernel author chose to put in TP_STRUCT__entry. There’s no mm in there, so there’s nothing to read. tp_btf instead receives the un-copied TP_PROTO pointer prev, so every field of task_struct is reachable.
One small consistency you’ll lean on: TASK_COMM_LEN is 16:
/* include/linux/sched.h:325 */
TASK_COMM_LEN = 16,
That’s why both the kernel’s __array(char, prev_comm, TASK_COMM_LEN) and your own struct event { char comm[16]; } agree, and why __builtin_memcpy(dst, src, sizeof(dst)) of 16 bytes is exactly right.
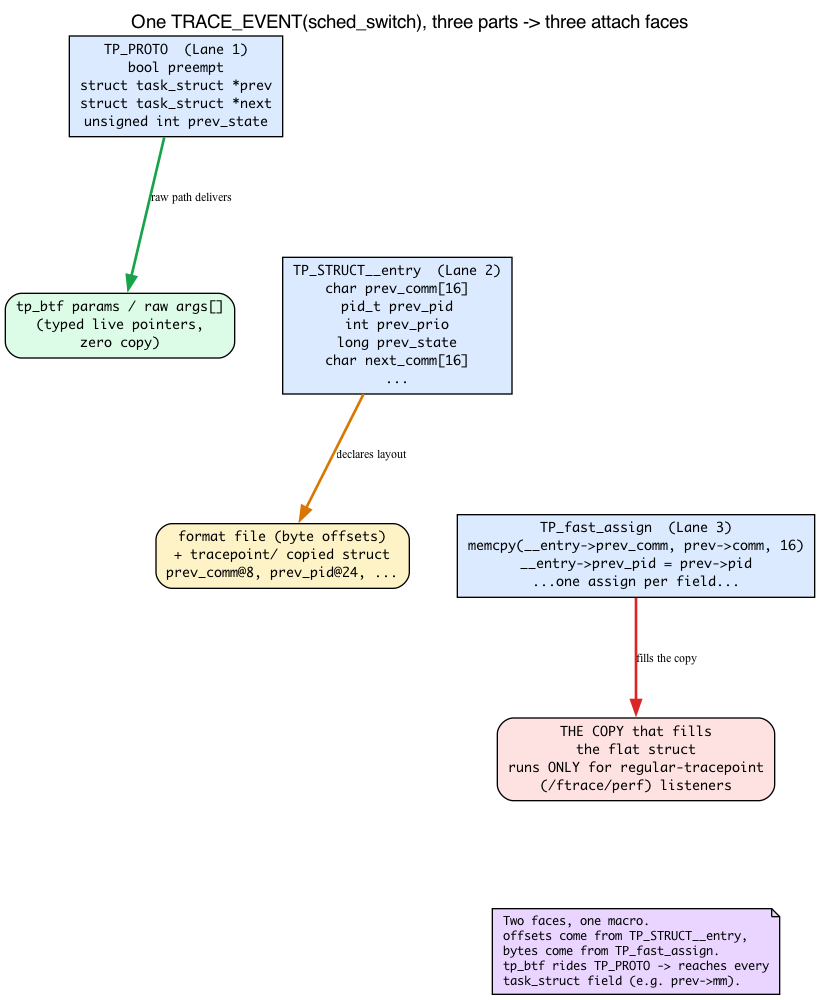
For a BPF-aware view of what your kernel exposes, perf lists every registered tracepoint by name:
sudo perf list 'sched:*' # all sched tracepoints
  sched:sched_migrate_task                           [Tracepoint event]
  sched:sched_process_exec                           [Tracepoint event]
  sched:sched_process_fork                           [Tracepoint event]
  sched:sched_switch                                 [Tracepoint event]
  sched:sched_wakeup                                 [Tracepoint event]
  ...
(Note: sudo bpftool perf list is not a way to discover tracepoints — it lists BPF programs currently attached to perf events, so on an idle box with nothing loaded it prints nothing at all.)
Common families you should know about:
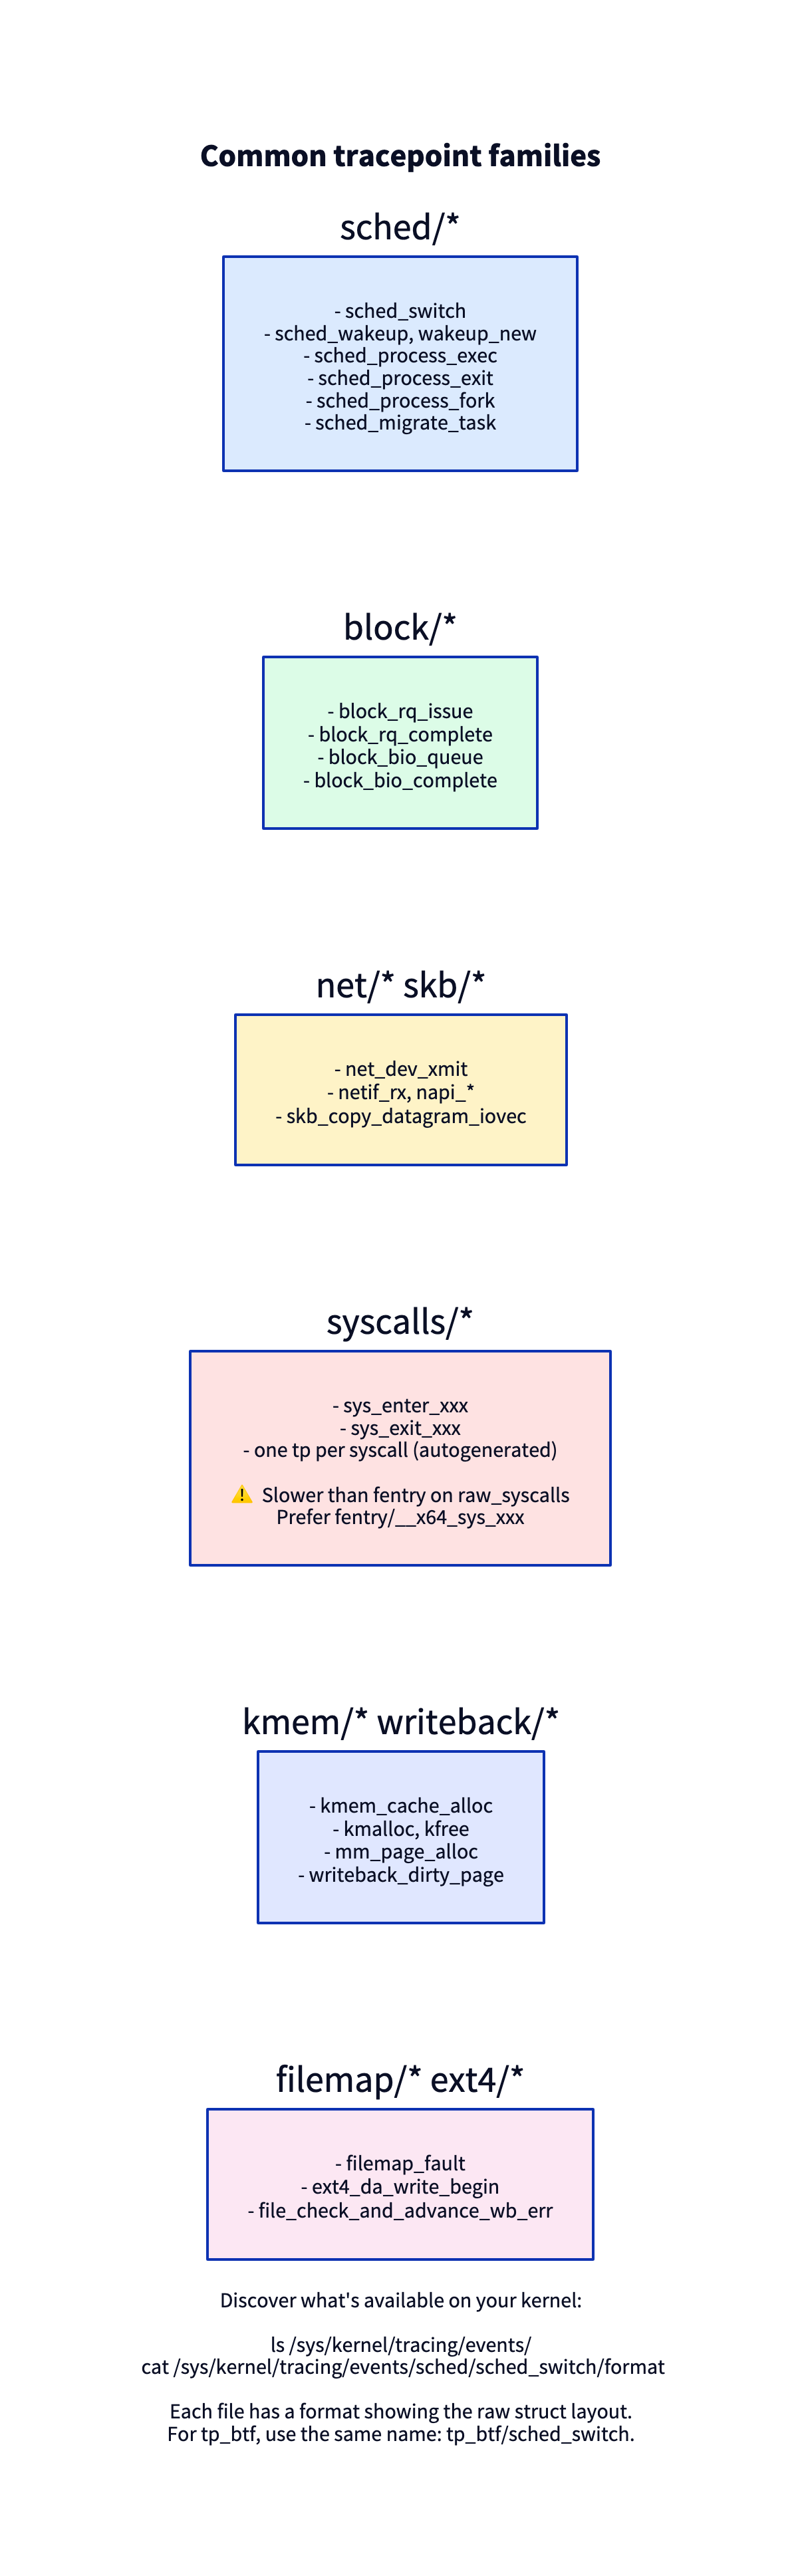
Sharpen your pencil
A workload runs slowly. You want to see which tasks the scheduler is preempting. You could:
- fentry on
__schedule().- Raw tracepoint on
sched_switch.- tp_btf on
sched_switch.Which gives you the cleanest data with least friction?
.
.
.Answer: (3).
__scheduleruns for many reasons; you’d have to figure out which calls are switches (and as we saw,__scheduleis the single function behind every voluntary and preemptive switch — one function, many reasons). Rawsched_switchgives you the right event but only copied fields (no access to e.g.prev->mm). tp_btf gives you livetask_struct *prev, *next— read whatever you want.
tp_btf signature — how to know the arguments
For an fentry program, the function’s signature is in BTF — straightforward. For a tp_btf program, the tracepoint’s signature is what matters. Tracepoints are defined via TRACE_EVENT() macros, and the args are the parameters declared in TP_PROTO (which, you now know, is the same list __traceiter_sched_switch passes unchanged to every listener).
Look in include/trace/events/sched.h:
TRACE_EVENT(sched_switch,
    TP_PROTO(bool preempt,
             struct task_struct *prev,
             struct task_struct *next,
             unsigned int prev_state),
    ...
);
So your tp_btf program is:
SEC("tp_btf/sched_switch")
int BPF_PROG(on_switch, bool preempt, struct task_struct *prev, struct task_struct *next, unsigned int prev_state)
Four args matching the TP_PROTO (the trailing prev_state was added in 5.18 — commit 9c2136be0878, “sched/tracing: Append prev_state to tp args instead”).
For tracepoints whose TP_PROTO you don’t know offhand, bpftool btf dump file /sys/kernel/btf/vmlinux | grep btf_trace_sched_switch will show you the typedef.
The lab
schedlat.h — the shared event record
#ifndef PRACTICAL_EBPF_SCHEDLAT_H
#define PRACTICAL_EBPF_SCHEDLAT_H

struct event {
    unsigned int prev_pid;
    unsigned int next_pid;
    unsigned long long wait_ns;     /* how long next was waiting */
    char prev_comm[16];
    char next_comm[16];
};

#endif
schedlat.bpf.c — measure scheduling latency per task
#include "vmlinux.h"
#include <bpf/bpf_helpers.h>
#include <bpf/bpf_tracing.h>

#include "schedlat.h"

char LICENSE[] SEC("license") = "GPL";

/* When was this task last switched OUT (i.e. when did it stop running)? */
struct {
    __uint(type, BPF_MAP_TYPE_HASH);
    __uint(max_entries, 16384);
    __type(key, __u32);    /* tid */
    __type(value, __u64);  /* timestamp captured on switch-out */
} last_run SEC(".maps");

struct {
    __uint(type, BPF_MAP_TYPE_RINGBUF);
    __uint(max_entries, 256 * 1024);
} rb SEC(".maps");

SEC("tp_btf/sched_switch")
int BPF_PROG(on_switch, bool preempt, struct task_struct *prev, struct task_struct *next, unsigned int prev_state)
{
    __u64 now = bpf_ktime_get_ns();
    __u32 prev_tid = prev->pid;   /* live ptr deref! */
    __u32 next_tid = next->pid;

    /* Record when prev was scheduled out */
    bpf_map_update_elem(&last_run, &prev_tid, &now, BPF_ANY);

    /* How long was next waiting? */
    __u64 *t = bpf_map_lookup_elem(&last_run, &next_tid);
    if (!t)
        return 0;     /* first time we see next; no wait time */

    __u64 wait = now - *t;
    if (wait < 1000)
        return 0;     /* skip < 1µs noise */

    struct event *e = bpf_ringbuf_reserve(&rb, sizeof(*e), 0);
    if (!e) return 0;
    e->prev_pid = prev_tid;
    e->next_pid = next_tid;
    e->wait_ns = wait;
    /* Direct deref of comm[16] — array, not pointer */
    __builtin_memcpy(e->prev_comm, prev->comm, sizeof(e->prev_comm));
    __builtin_memcpy(e->next_comm, next->comm, sizeof(e->next_comm));
    bpf_ringbuf_submit(e, 0);
    return 0;
}
What’s new
SEC("tp_btf/sched_switch")— tp_btf attach. Args matchTP_PROTOofsched_switch. (prevandnextare the sametask_struct *the kernel passed totrace_sched_switchatcore.c:7186.)- Direct deref of
prev->pid,next->pid,prev->comm— works becauseprevandnextarePTR_TO_BTF_ID(live, typed kernel pointers).prev->pidreads the field atinclude/linux/sched.h:1063;prev->commreads the 16-byte array atinclude/linux/sched.h:1173. A regular tracepoint could read these too (they’re in the copied struct) — but only these. The win is that you could also readprev->mm,prev->cgroup, etc., none of whichTP_fast_assigncopied. - The pattern is more interesting than a single function tracer. We’re tracking every task. The map fills up to one entry per active TID and naturally bounds itself (active TIDs ≪ max_entries on most systems).
if (wait < 1000) return 0;— filter sub-µs noise. The kernel switches frequently enough that without filtering, you’d flood the ringbuf.- Remember what
wait_nsis. It’snow - last_run[next_tid]: the off-CPU gap between this task’s two consecutive on-CPU stints. A proxy for scheduling delay, not strict wakeup-to-run latency.
schedlat.c — userspace consumer
Same pattern. Print:
printf("%s [%u] waited %llu µs after %s [%u]\n",
       e->next_comm, e->next_pid, e->wait_ns / 1000,
       e->prev_comm, e->prev_pid);
Run
make
sudo ./schedlat 2>&1 | head -50
Expected: a stream of switches with wait times, e.g.:
firefox [4001] waited 152 µs after kworker/u8:2 [42]
chromium [5002] waited 89 µs after firefox [4001]
...
Spikes (> 1ms) often correlate with workload, lock contention, scheduler decisions worth investigating.
What to break, in order
Break 1 — Convert to regular tracepoint
SEC("tracepoint/sched/sched_switch")
int on_switch(struct trace_event_raw_sched_switch *ctx)
{
    __u32 prev_tid = ctx->prev_pid;
    __u32 next_tid = ctx->next_pid;
    /* ... no struct task_struct * available ... */
}
This compiles and works for prev_pid, next_pid, prev_comm, next_comm (all in the copied struct — the exact fields TP_STRUCT__entry declared and TP_fast_assign filled). But there’s no way to reach prev->real_parent, prev->cgroup, prev->mm, etc. — those live in the task_struct, and a regular tracepoint only hands you the copied event fields, not the live pointer. (And note: attaching this regular tracepoint/... program is what puts the TP_fast_assign copy probe on the iterator’s list — so now the per-event memcpy actually runs.)
For most tracers, tp_btf is more ergonomic. Reach for regular tracepoint/... only when:
- You explicitly want stability (the raw struct format won’t change).
- The kernel doesn’t have BTF (rare; pre-5.4).
- You want to be portable across BPF runtimes that lack BTF awareness.
Break 2 — Attach to a non-existent tracepoint
SEC("tp_btf/this_tracepoint_is_not_real")
Load fails:
libbpf: prog 'on_switch': failed to find kernel BTF type ID of 'this_tracepoint_is_not_real'
The tracepoint name is verified against kernel BTF. Typo-proof.
Break 3 — Wrong signature
SEC("tp_btf/sched_switch")
int BPF_PROG(p, struct task_struct *prev, struct task_struct *next)
{ /* missing 'bool preempt' first arg */ }
Loads, runs, but prev is actually bool preempt cast to a pointer — garbage. Direct deref segfaults the BPF program (Verifier kills the run).
The Verifier should catch this if you compile against the right BTF — but if it doesn’t, the symptom is “program loads but data is wrong.” Always check TP_PROTO.
Break 4 — Use BPF_CORE_READ when direct deref would do
__u32 next_tid = BPF_CORE_READ(next, pid); /* helper-call-based */
Works. Slower than direct deref (~50ns extra for the helper call). For trusted, well-typed pointers like next here, direct deref is preferred.
But: if next could be NULL or invalid, BPF_CORE_READ returns 0 instead of crashing. So for edges where you’re chasing a chain (next->mm->start_brk), prefer BPF_CORE_READ so any NULL hop is silently zero-handled.
What to read in the kernel
include/trace/events/sched.h— definitions of all sched/* tracepoints. SearchTRACE_EVENT(sched_switch(line 220). The macro expands into a lot of code, but the three parts that matter areTP_PROTO(line 222, your tp_btf args),TP_STRUCT__entry(line 229, theformat/copied-struct layout), andTP_fast_assign(line 239, the copy code — note thememcpyat line 240).include/linux/tracepoint.h— the macro machinery. Skim. Note__DECLARE_TRACEand__DECLARE_TRACE_COMMON(the helperTRACE_EVENTexpands through), the generated__traceiter_##name(line 267), and how the firing site reaches it via__DO_TRACE_CALL(lines 227/231: astatic_callwhenCONFIG_HAVE_STATIC_CALL, else a plain indirect call).kernel/tracepoint.c— what happens when a tracepoint fires. The generated__traceiter_<event>iterator walks the registered probe list.kernel/trace/bpf_trace.c— searchbpf_get_raw_tracepoint(line 2051). This is how BPF programs attach to raw tracepoints; the per-event dispatch into your program is__bpf_trace_run(line 2073).tp_btfgoes through the same raw-tracepoint path (BPF_TRACE_RAW_TP,kernel/bpf/syscall.c:4388): the link is set up viabpf_raw_tracepoint_open/bpf_get_raw_tracepoint, just with BTF-typed arguments.kernel/sched/core.c— the scheduler core. See__schedule(line 7017),context_switch(line 5329), and the tracepoint firing sitetrace_sched_switch(preempt, prev, next, prev_state)(line 7186) — the source of everything today’s lab measures.tools/testing/selftests/bpf/progs/cgrp_ls_tp_btf.c— official examples using tp_btf.
Bullet Points
- A CPU runs one task at a time; runnable-but-waiting tasks sit on a per-CPU run queue. A context switch (
context_switch,core.c:5329) savesprevand loadsnext;__schedule(core.c:7017) drives every switch and firessched_switch(core.c:7186) withprev/nextalready chosen. - Today’s
wait_nsis off-CPU time between a task’s two runs (now - last_run[next_tid]) — a proxy for scheduling delay, not strict wakeup-to-run latency (that needssched_wakeup). - A
TRACE_EVENThas three parts:TP_PROTO(your tp_btf/raw args),TP_STRUCT__entry(theformatfile + copied struct), andTP_fast_assign(the memcpy that fills the copy). A regular tracepoint can only see whatTP_fast_assigncopied — which is why it can’t reachprev->mm. - A firing tracepoint runs
__traceiter_<event>, which walks a probe list and calls each listener with the rawTP_PROTOargs — no copy at this layer. The struct copy is one optional probe, present only when atracepoint//ftrace/perf listener attaches — that’s why the cost is bounded. - Tracepoints are explicit instrumentation hooks placed by kernel devs; their format is stable across versions.
- Tracepoint events have three BPF section families:
tracepoint/...(copied struct),raw_tracepoint/...(raw positional args), andtp_btf/...(typed BTF args). BPF raw and tp_btf share the path throughbpf_get_raw_tracepoint/__bpf_trace_run(BPF_TRACE_RAW_TP); tp_btf just adds BTF types. - Use tp_btf for new code. Same hook, lower overhead (no copy, no tracefs lookup), full field access via direct deref.
- The
TP_PROTO(...)of a tracepoint defines your tp_btf BPF program’s argument list. - Discover tracepoints in
/sys/kernel/tracing/events/. - Common families:
sched/*,block/*,net/*,syscalls/*,kmem/*,filemap/*. - Prefer fentry over
tracepoint/syscalls/sys_enter_xxx(faster on the syscall path). - Direct deref works on tp_btf args;
BPF_CORE_READfor chains where any hop could be NULL.
Check question
You attach a tp_btf to sched_switch. Inside your program, you save prev (a task_struct *) into a hash map for use later. Will dereferencing it later still work?
Click to reveal answer
Answer: No. The pointer was trusted during the tracepoint callback because the kernel handed it to you with a guarantee that the task is alive for the duration of the callback. Once the callback returns, that guarantee is gone — the task may be freed. Storing the raw pointer for later use is a use-after-free risk and the Verifier rejects it. To save a reference safely, you’d use bpf_task_acquire (a kfunc — Day 20) which atomically takes a refcount, then bpf_task_release later. Or, simpler: store fields (pid, comm) rather than the pointer.
Tomorrow
Day 9: stack traces. BPF_MAP_TYPE_STACK_TRACE, bpf_get_stackid, kernel vs user stacks, and how to fold output for flame graphs.
Day 9 — Stack traces and the path to flame graphs
Today’s mission: capture the kernel call stack at every
vfs_read, aggregate by unique stack, and produce data ready for a flame graph. Along the way you’ll learn what a native call stack actually is, how the kernel unwinds it without frame pointers, and why turning a raw return address back into a function name is a userspace job split across/proc/kallsyms,/proc/PID/maps, and a pile of base arithmetic. Total time: ~120 minutes.
Why stack traces matter
Counters tell you “this happened 1000 times.” Stack traces tell you who caused it. Combined with rate aggregation, they reveal hotspots — which user code, through which kernel paths, accounts for the bulk of an event’s occurrences.
This is how perf top, bpftrace, and most profiling tools work under the hood. By Day’s end you’ll know how to write your own.
But “capture the stack” hides four things that will bite you the moment you look at the raw output, and most of today is about making them obvious:
- What a native call stack even is — and how the kernel walks it backwards (the thing
bpf_get_stackiddoes for you). - What the syscall-entry frames are — why every
read()shares an identical base of kernel frames. - How a raw kernel return address becomes a function name —
/proc/kallsyms, and why an exact match almost never works. - How a raw user return address becomes a function name — ASLR, load bases, and
addr2line.
We’ll teach each as we hit the part of the lab that needs it.
First: what is a call stack, and how do you walk it backwards?
Before we touch any BPF, we have to be precise about the thing we’re capturing. When one function calls another on x86_64, the CALL instruction does one concrete thing: it pushes the return address — the address of the instruction right after the call — onto the stack, then jumps. When the callee runs RET, it pops that address and resumes there. So at any instant, the stack contains a chain of return addresses: one per function currently in flight, innermost (the leaf, where the CPU is right now) at the top.
Unwinding = recovering that ordered list of return addresses, leaf-first. That list is the stack trace. Unwinding produces exactly this — an array of return addresses (the internal trace->ip[]), innermost first; bpf_get_stackid hashes that array, stores it, and returns a stackid (see below).
Don’t confuse this with the BPF stack from Day 1/4. Day 1 taught the BPF program’s own 512-byte stack addressed through register
R10— that’s scratch space the verifier polices for your eBPF code. Today’s call stack is the CPU’s native kernel/user stack: the real x86 stack of return addresses laid down byCALLinstructions in compiled kernel and userspace code. Different stack, different purpose.bpf_get_stackidwalks the native one.
So how do you walk it backwards? You have a stack pointer and you know the top frame’s instruction pointer — but the stack is just bytes. Where does one frame end and the next begin? There are two answers.
Frame-pointer unwinding (the simple way)
With -fno-omit-frame-pointer, the compiler dedicates register %rbp to point at a known spot in the current frame: the saved-%rbp/return-address pair. Each function’s prologue pushes the caller’s %rbp and sets %rbp to the new frame. The result is a linked list: %rbp points at [saved %rbp | return addr], and the saved %rbp points at the previous frame’s pair, and so on. A walker just follows the chain, reading a return address out of each node.
Cheap and simple — but it costs a general-purpose register (%rbp can’t be used for anything else), so for years amd64 distros compiled everything with -fomit-frame-pointer to claw that register back. That single decision is why user-stack walks fail on older binaries: there’s no %rbp chain to follow.
ORC unwinding (how the x86_64 kernel does it)
The kernel can’t afford to lose %rbp, yet it still needs reliable stacks. The fix: an out-of-band table built at compile time. The kernel image ships two arrays — __start_orc_unwind_ip[] / __start_orc_unwind[] (declared extern at arch/x86/kernel/unwind_orc.c:30) — that, keyed by any instruction pointer, describe how to find the previous frame without a frame pointer: “at this IP, the stack pointer is at such-and-such offset, the return address lives there.” orc_find() (unwind_orc.c:209) does the per-IP lookup, and unwind_get_return_address() (unwind_orc.c:380) produces each frame. The common frame type it resolves is ORC_TYPE_CALL (the case ORC_TYPE_CALL in the unwind step, unwind_orc.c:611).
This is why kernel stacks “always work” while user stacks need frame pointers: the kernel carries its own unwind table; userspace binaries don’t (their equivalent, DWARF .eh_frame, is too expensive for the kernel to parse from a BPF context — more on that below).
Both methods produce the same result: the ordered trace->ip[] array of return addresses, which bpf_get_stackid hashes. The captured array lands in a struct perf_callchain_entry { u64 nr; u64 ip[]; } (include/linux/perf_event.h:59) — nr frames, then the IPs.
![Frame-pointer and ORC unwinding both produce the same trace->ip[] array](diagrams/day09_callstack_unwind.png)
One subtlety that haunts symbolization
Look again at what CALL pushes: the address of the instruction after the call. So every captured frame (except the leaf) is a return address that points into the middle of a function, one instruction past a call site — never at the function’s start. Hold that thought; it’s the root cause of the kallsyms “nearest-preceding-symbol” trick we hit later.
Meet BPF_MAP_TYPE_STACK_TRACE
A purpose-built map type. You don’t store key/value pairs in it directly — you call bpf_get_stackid(ctx, &stacks, flags) and the kernel:
- Walks the current stack (frame pointers or ORC, per the section above).
- Hashes the frame array into a 32-bit
stackid. - Stores the frames keyed by
stackid(deduplicated — same stack → same id). - Returns
stackidto your program.
You then use stackid as a key in a normal map (e.g., a hash map of stackid → count) to aggregate. The helper itself is BPF_CALL_3(bpf_get_stackid, ...) at kernel/bpf/stackmap.c:323; it deliberately returns unsymbolized frames — turning addresses into names is a userspace concern (we’ll see exactly why below).
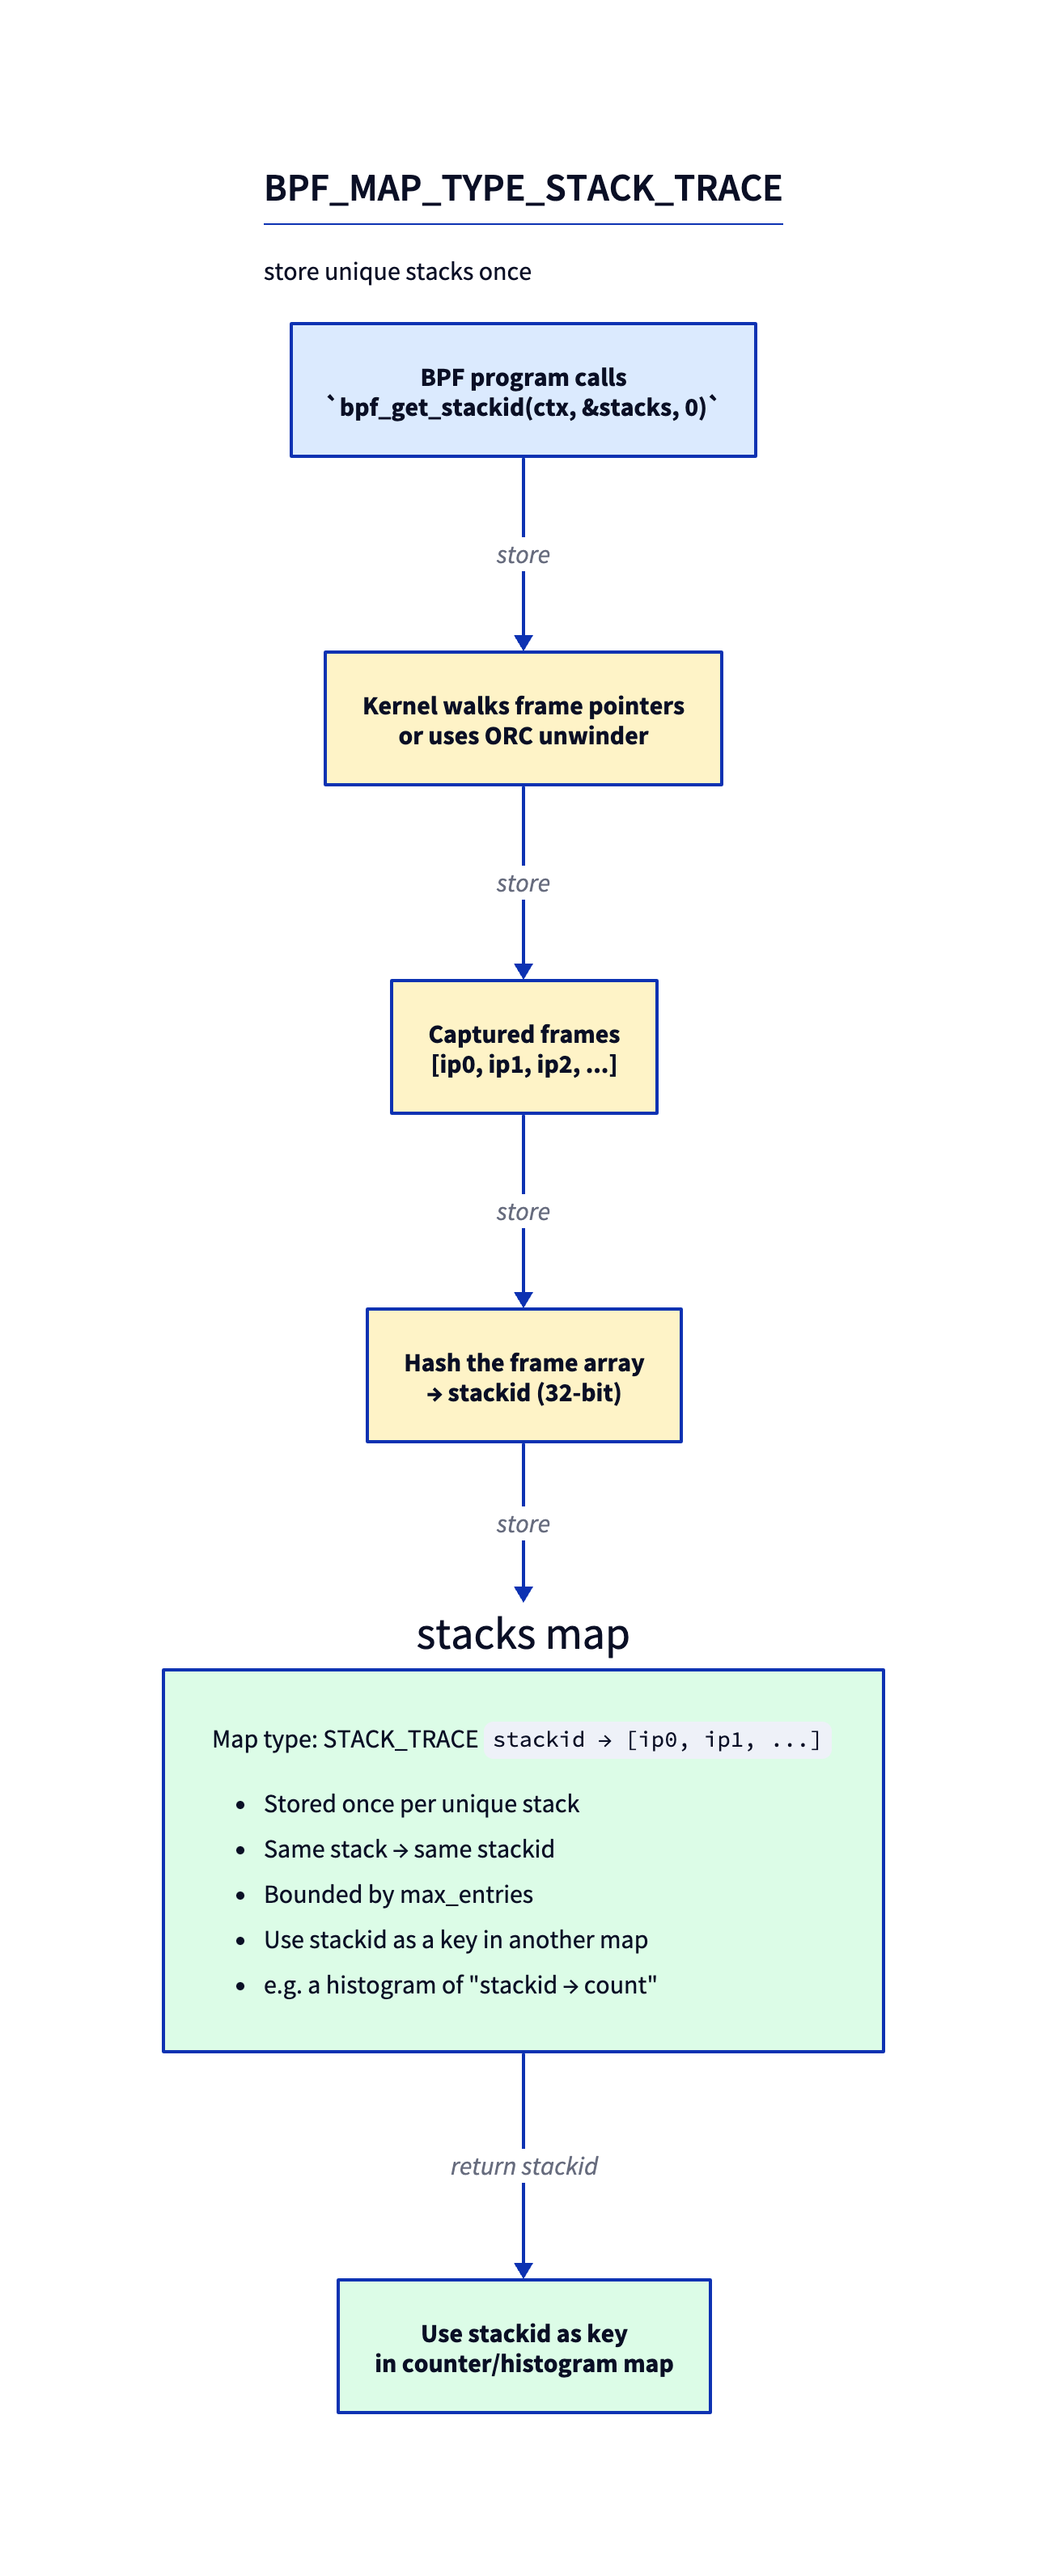
The dedup matters: if 10 million events all happen with the same stack, you store the frame array once and count it 10 million times against one stackid. Memory is bounded by the number of unique stacks, not events.
Kernel stack vs user stack
The flag argument to bpf_get_stackid (and its sibling bpf_get_stack) decides which stack you walk:
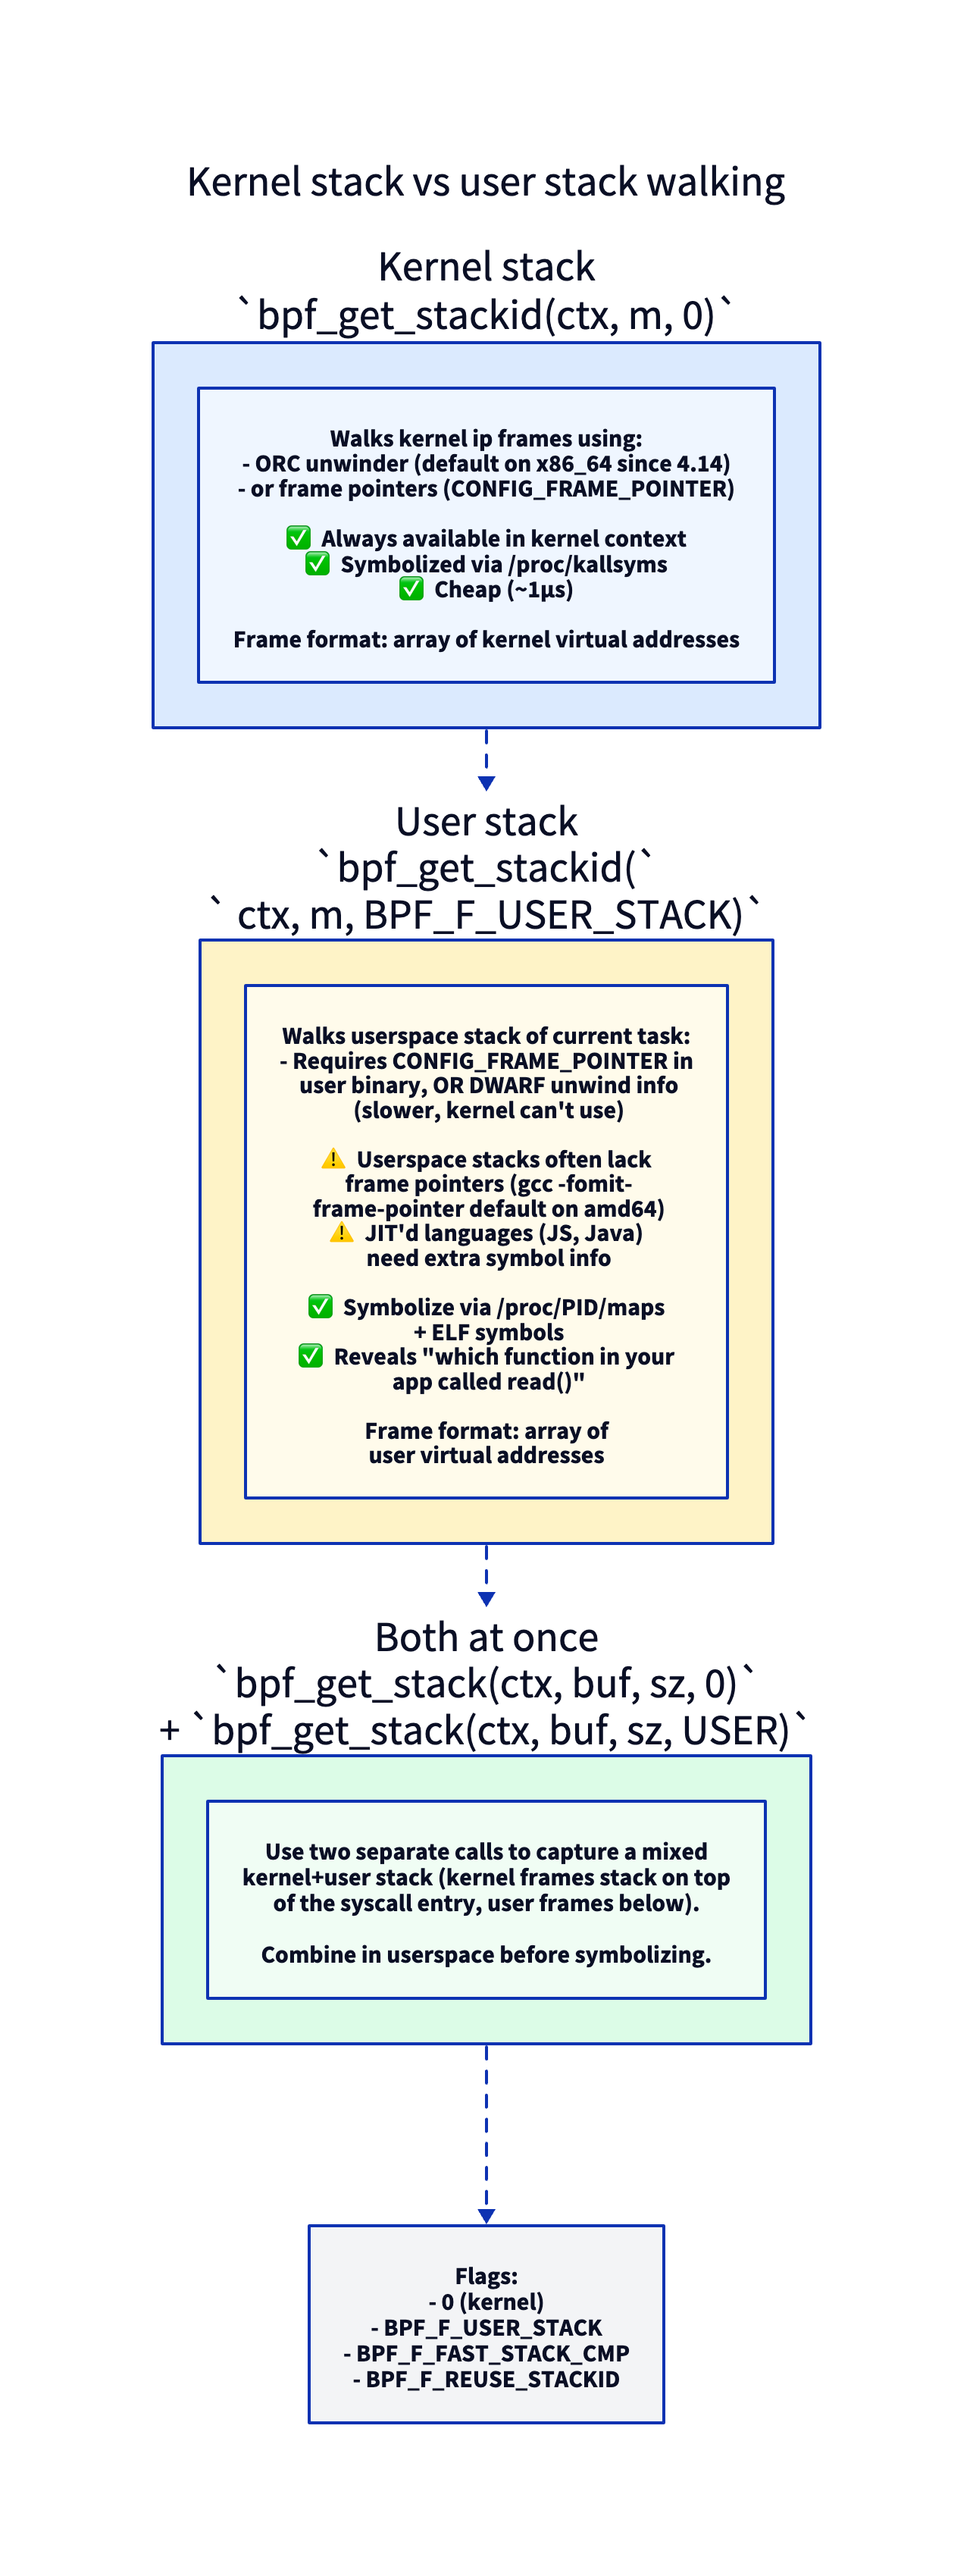
- Default (flag=0): kernel stack. Walked via the ORC unwinder on x86_64 (default since 4.14) or frame pointers — the two mechanisms from the section above. Always works in any tracing context, because the kernel ships its own ORC table.
BPF_F_USER_STACK: userspace stack of the current task. Works only if the user binary was compiled with frame pointers. The DWARF unwind info (.eh_frame) that would otherwise rescue a frame-pointer-omitted binary is too expensive for the kernel to parse from BPF context, so the kernel can’t unwind userspace from DWARF — no frame pointers, no user stack. Modern Linux distributions started building-fno-omit-frame-pointerby default starting with Fedora 38 in 2023, and Ubuntu 24.04 in 2024, to make this useful again.BPF_F_FAST_STACK_CMP: hash-only comparison (faster, no full frame walk for dedup).BPF_F_REUSE_STACKID: allow stackid reuse across capture sessions.
To get a combined kernel+user stack, you call bpf_get_stack twice (not bpf_get_stackid) — once with each flag — and combine in userspace before symbolizing.
There are no Dumb Questions
Q: How accurate are kernel stacks?
A: Very, in 99% of cases. The ORC unwinder is precise. Edge cases: in-flight kprobes that occur during function prologue/epilogue may produce off-by-one frames. Highly optimized leaf functions can be tail-called and not appear in the stack at all. For most tracing this is fine.
Q: Why doesn’t user stack walking “just work” like the kernel side?
A: Userspace binaries on amd64 have been compiled with
-fomit-frame-pointerfor years (default in distros until Fedora 38 in 2023 and Ubuntu 24.04 in 2024 reversed it). Without frame pointers, walking back through stack frames requires DWARF unwind info (.eh_frame) — which is expensive and the kernel can’t process. Modern distros are reversing course (Fedora, Ubuntu now ship frame-pointer-enabled libc and friends), but legacy binaries lack the metadata.Q: How do I symbolize JIT’d languages (Java, Node.js)?
A: They expose runtime symbol files.
perf-PID.mapis a text file in/tmpmapping JIT addresses to function names. JIT runtimes (HotSpot, V8) generate these. Your userspace symbolizer reads them alongside ELF tables.
What the syscall-entry frames actually are
The exercise below leans on a specific 5-frame kernel chain for cat /etc/passwd, and the flame graph later calls the wide base “the common syscall-entry frames.” On Day 7 you saw that the read tracepoint sits one layer up at syscall entry while fentry/vfs_read hooks the bottom — but not the rungs between those two points. Here’s the full ladder — you don’t need to re-derive the syscall mechanism, just see the rungs.
A read() does not jump straight into vfs_read. On x86_64 it traverses a fixed dispatch ladder:
- The hardware
SYSCALLinstruction lands at the assembly stubentry_SYSCALL_64. - That calls the C dispatcher
do_syscall_64(regs, nr)(arch/x86/entry/syscall_64.c:87). - Which dispatches through the syscall table to
__x64_sys_read— the arch wrapper thatSYSCALL_DEFINE3(read, ...)(fs/read_write.c:724) expands to. - Which calls the thin
ksys_read()(fs/read_write.c:706). - Which finally calls
vfs_read()(fs/read_write.c:554) — the leaf you’re tracing.
This is why every sample shares a wide common base in the flame graph: every read() on the box enters through the identical entry_SYSCALL_64 → do_syscall_64 prefix; only the leaf paths diverge. It also fixes the leaf ordering in a folded line: process (cat) at the base, then the entry frames, with vfs_read — the function you traced — on top.
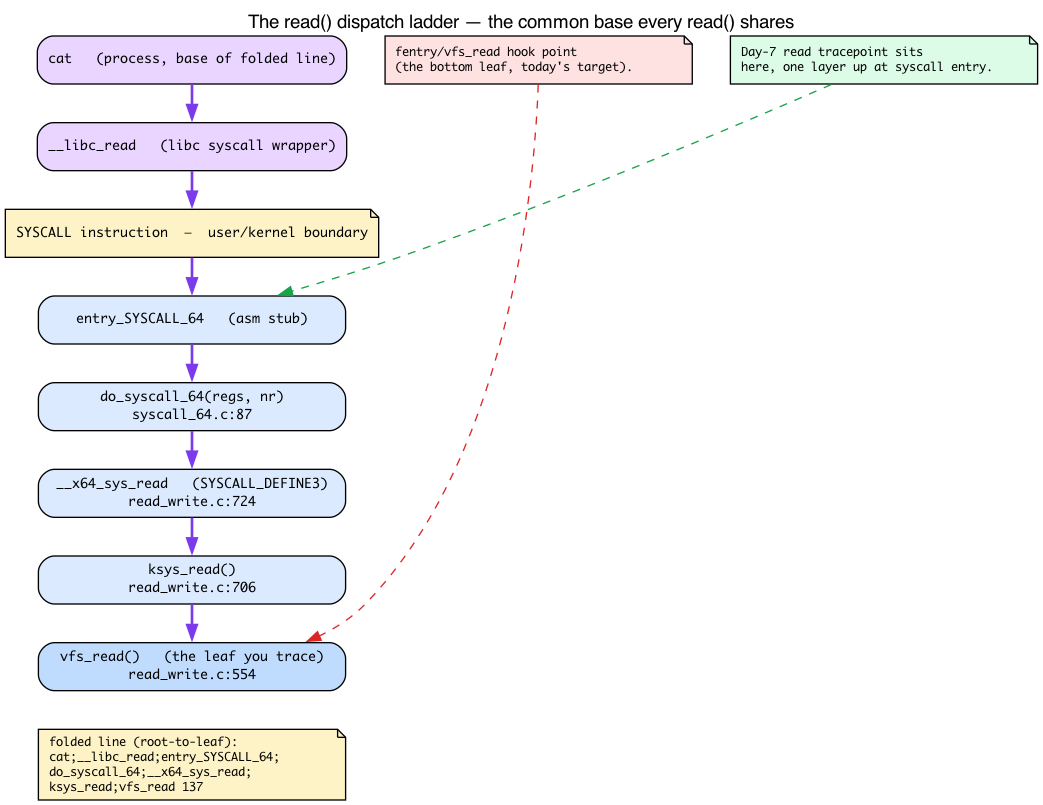
Sharpen your pencil
You write a tracer that captures kernel + user stacks for every
vfs_read. Your test workload iscat /etc/passwdfrom bash. Roughly how many uniquestackidvalues do you expect?.
.
.Answer: A small handful.
cat’s call toread()always traverses roughly the same userspace path (libcreadwrapper → syscall instruction). Bash’scatinvocation similarly goes through the same path. The kernel side is also stable:entry_SYSCALL_64→do_syscall_64→__x64_sys_read→ksys_read→vfs_read. Maybe 1–3 unique stacks total. Now run on a complex workload (Firefox loading a page) and you’ll see hundreds — that’s the dedup paying off.
How deep can a stack go? The hard 127-frame cap
Before you size the map, know the ceiling. When you create a BPF_MAP_TYPE_STACK_TRACE map, the kernel requires value_size / 8 (8 bytes per u64 frame) to be <= sysctl_perf_event_max_stack up front. So asking for 256 frames does not silently clamp — map creation is rejected with -EINVAL (stack_map_alloc, stackmap.c:113). value_size / 8 must be <= sysctl_perf_event_max_stack at creation time.
PERF_MAX_STACK_DEPTHis 127 by default (include/uapi/linux/perf_event.h:1285), andint sysctl_perf_event_max_stack = PERF_MAX_STACK_DEPTH;(kernel/events/callchain.c:23). The runtime knob is/proc/sys/kernel/perf_event_max_stack(registered atcallchain.c:306). It’s shared with the perf subsystem becausebpf_get_stackidreuses perf’s callchain machinery.stack_map_calculate_max_depth()(kernel/bpf/stackmap.c:53) computes the runtime depth fromvalue_size / elem_sizeand reconciles it with the sysctl:if (max_depth > curr_sysctl_max_stack) return curr_sysctl_max_stack;. This runtime clamp only matters when the sysctl is lowered after the map was created (or for theBPF_F_SKIP_FIELDadjustment) — not as a creation-time ceiling. The creation-time gate is separate:stack_map_allocoutright rejects a map whosevalue_size / 8 > sysctl_perf_event_max_stackwith-EINVAL(stackmap.c:113–114).
Practical consequence: the lab’s MAX_STACK_DEPTH = 64 is comfortably under the cap. Choosing 64 vs 127 trades memory-per-unique-stack against truncation risk on deep stacks. Going above 127 buys nothing unless you also raise the sysctl.
The end-to-end flame graph pipeline

Capture in BPF, aggregate by stackid, read in userspace, symbolize each frame, fold into the textual format flamegraph.pl expects:
thread_or_pid;fn1;fn2;fn3;fn4 1234
Then pipe through flamegraph.pl (Brendan Gregg’s tool) or upload to speedscope.app.
The lab
stacks.bpf.c
#include "vmlinux.h"
#include <bpf/bpf_helpers.h>
#include <bpf/bpf_tracing.h>

char LICENSE[] SEC("license") = "GPL";

#define MAX_STACK_DEPTH 64

struct {
    __uint(type, BPF_MAP_TYPE_STACK_TRACE);
    __uint(max_entries, 16384);
    __uint(key_size, sizeof(__u32));
    __uint(value_size, MAX_STACK_DEPTH * sizeof(__u64));
} stacks SEC(".maps");

struct {
    __uint(type, BPF_MAP_TYPE_HASH);
    __uint(max_entries, 16384);
    __type(key, __u64);     /* (kstack_id << 32) | ustack_id */
    __type(value, __u64);   /* count */
} counts SEC(".maps");

SEC("fentry/vfs_read")
int BPF_PROG(on_read)
{
    __s64 kid = bpf_get_stackid(ctx, &stacks, 0);
    __s64 uid = bpf_get_stackid(ctx, &stacks, BPF_F_USER_STACK);

    /* Negative return = failure to capture (returns a negative errno:
       -EFAULT/-EEXIST/-ENOMEM, e.g., user stack with no frame ptrs). */
    if (kid < 0 && uid < 0)
        return 0;

    __u64 key = ((__u64)(kid & 0xffffffff) << 32) | (uid & 0xffffffff);
    __u64 *c = bpf_map_lookup_elem(&counts, &key);
    if (c) {
        __sync_fetch_and_add(c, 1);
    } else {
        __u64 one = 1;
        bpf_map_update_elem(&counts, &key, &one, BPF_NOEXIST);
    }
    return 0;
}
What’s new (and what’s recycled)
- The attach is old news.
SEC("fentry/vfs_read")is the same BTF-typed entry trampoline onvfs_readyou used on Day 6, andBPF_PROG(on_read)is the argument-unpacking macro demystified on Day 7. Nothing new in how we attach —vfs_read(fs/read_write.c:554) is the identical target from the Day 6 lab. Today’s novelty is entirely inside the handler. - Two
bpf_get_stackidcalls — one kernel (flag 0), one user (BPF_F_USER_STACK). - Negative return checks. The helpers return a negative errno (-EFAULT/-EEXIST/-ENOMEM) on failure (e.g., user-stack walk hit a missing frame pointer, or the stack map slot was already taken by a different stack).
- Composite key: pack both stackids into one
u64so identical (kernel, user) pairs share a counter. This(kid << 32) | uidpacking is the only genuinely new twist here — two stackids collapsed into one hash-map key. - The counter logic is pure Day 2. Recall from Day 2: a hash-map lookup hands back an unlocked live pointer, so the concurrent increment must be
__sync_fetch_and_add; and theBPF_NOEXISTinsert can lose a racing increment (a cosmetic miss). Samecount.cpattern, same check question — no need to re-derive it.
stacks.c — userspace dumper + symbolizer
Outline (you can use blazesym or write a minimal kallsyms parser). The iteration loop is the same userspace bpf_map_get_next_key walk from Day 2 — one key per call, the loop lives in userspace:
/* every 5s, dump top stacks by count: */
while (!exiting) {
    sleep(5);

    /* iterate counts map */
    __u64 key = 0, next;
    __u64 val;
    int cnt_fd = bpf_map__fd(skel->maps.counts);
    int stk_fd = bpf_map__fd(skel->maps.stacks);

    while (bpf_map_get_next_key(cnt_fd, &key, &next) == 0) {
        bpf_map_lookup_elem(cnt_fd, &next, &val);
        __u32 kid = next >> 32, uid = next & 0xffffffff;

        __u64 kframes[64] = {0}, uframes[64] = {0};
        bpf_map_lookup_elem(stk_fd, &kid, kframes);
        bpf_map_lookup_elem(stk_fd, &uid, uframes);

        /* Print folded: stack;...; count */
        printf("[count=%llu]\n", val);
        for (int i = 0; i < 64 && kframes[i]; i++)
            printf("  K %llx\n", kframes[i]);
        for (int i = 0; i < 64 && uframes[i]; i++)
            printf("  U %llx\n", uframes[i]);
        printf("\n");

        key = next;
    }
}
For real symbolization, link against libblazesym (modern, fast) or write a kallsyms parser. We won’t write one today — Day 9 is about capturing the data; symbolization is plumbing. But you should understand what that plumbing does, because the next two sections walk it by hand.
Run it
make
sudo ./stacks &        # job %1; prints a dump every 5s
# Generate work, then wait for the next 5-second dump to see it:
find /usr -name "*.so" > /dev/null
cat /etc/passwd > /dev/null
sleep 5
Output is interval-driven — nothing prints until the next 5-second tick. When you’re done, stop the background dumper (otherwise it keeps printing as root forever):
kill %1 # or: sudo pkill stacks
You’ll see frames printed as raw hex (K <addr> / U <addr>). Those are the raw return addresses from trace->ip[] — exactly the values the section on call stacks promised. Resolving them by hand is fiddly, and the two halves (kernel vs user) work completely differently. Let’s do each by hand once; that’s the whole reason bpftool/libblazesym exist.
Symbolizing kernel frames: /proc/kallsyms
A running kernel has no ELF symbol table the way a binary on disk does — the image is loaded and relocated. Instead the kernel exposes its runtime symbol table at /proc/kallsyms: one line per symbol, address type name, e.g. ffffffff... T vfs_read. A userspace symbolizer turns a kernel return address into a name by looking it up here. Two gotchas:
kptr_restrictzeros the addresses for non-root. This sysctl governs visibility; at the default value1, an unprivileged reader sees every address as0000000000000000. Grep as a normal user and you find zeros. You must read it as root. (It’s a hardening measure: leaking kernel addresses defeats KASLR.)- kallsyms lists symbol start addresses, not ranges — and isn’t address-sorted on disk. Recall the subtlety from the call-stack section: a captured frame is a return address in the middle of a function, never at its start. So an exact match almost never succeeds. The fix is nearest-preceding-symbol: sort lexicographically (which equals numeric order for the fixed-width 16-hex-digit kernel addresses), then take the greatest symbol address
<=your frame address.
# ADDR is one of the K <addr> values, e.g. ffffffff9a0ea100
sudo sort /proc/kallsyms | awk -v a=ADDR '$1 <= a {s=$0} END {print s}'
# ffffffff9a0ea0e0 T vfs_read
The frame address (ffffffff9a0ea100) is greater than vfs_read’s start (ffffffff9a0ea0e0) and less than the next symbol’s start, so it resolves to vfs_read — a return address a few bytes inside it. This is precisely the lookup bpftool/libblazesym automate.
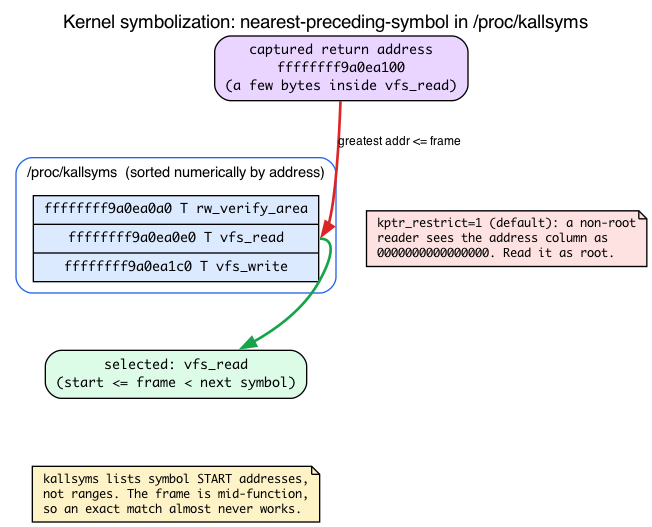
Symbolizing user frames: load bases and ASLR
Kernel frames live in one address space; user frames are runtime virtual addresses inside the traced process, and that’s where it gets harder. addr2line and a binary’s ELF symbol table speak in file offsets — the link-time addresses baked into the .so/executable. The captured frame is a runtime address. The two differ by the load base:
file_offset = runtime_addr - load_base
Why isn’t load_base just zero? Because Position-Independent Executables (PIE) and all shared libraries (libc, etc.) are mapped at a randomized base each run — that’s ASLR. To recover the file offset you must subtract the base, and the base is the lowest mapped address of that object’s executable segment, found in the left column of the matching line of /proc/PID/maps.
# A is a U <addr> runtime value; PID is the traced process.
# Find B = the base of the object that contains A:
sudo grep -i 'r-xp' /proc/PID/maps      # locate the segment whose range covers A; B is its start
addr2line -f -e /path/to/object $((A - B))
The base subtraction is mandatory for PIE executables and shared libraries. The one exception: a classic non-PIE ET_EXEC is linked at a fixed address (its main text base is effectively 0), so you pass the runtime address straight to addr2line — which is the carve-out you’ll see in tools. Two beginner traps produce ??:0: forgetting -e <object> (wrong object) and forgetting the subtraction (wrong base). This per-object bookkeeping across many mapped libraries is the bulk of what libblazesym/bpftool do for you.
(There’s a robustness escape hatch: BPF_F_USER_BUILD_ID (include/uapi/linux/bpf.h:6174) captures a build-id + offset instead of a bare address, so offline symbolization survives ASLR and even a different machine. We won’t use it today, but it’s why that mode exists.)
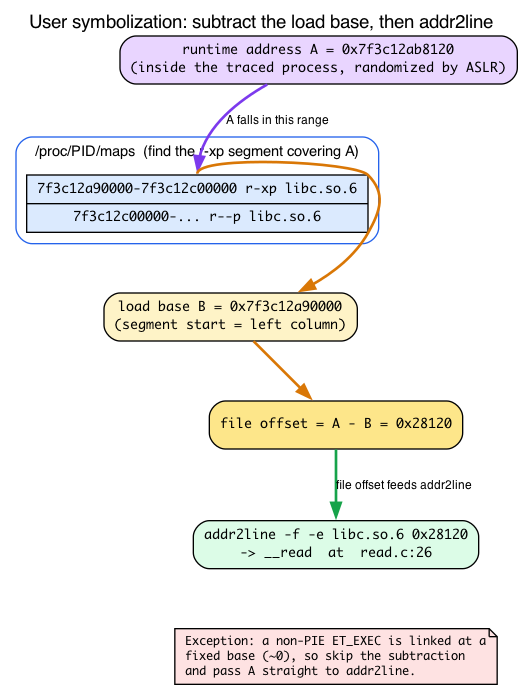
This hand-resolution — kallsyms nearest-preceding for kernel, base-subtract-then-addr2line for user — is exactly the plumbing libblazesym / bpftool automate, which is why we deferred symbolization in the lab.
Pipe to a flame graph
Get flamegraph.pl once (it isn’t packaged on any distro — grab it from Brendan Gregg’s repo):
git clone https://github.com/brendangregg/FlameGraph
export PATH="$PATH:$PWD/FlameGraph"
Then:
sudo ./stacks --folded > out.folded
flamegraph.pl < out.folded > out.svg
# Open out.svg in any browser. On a headless box, copy it to your laptop,
# or just drag out.folded onto https://speedscope.app (no local browser needed).
# firefox out.svg   # only if you actually have a desktop browser
--folded is required reader work — the lab’s stacks.c only prints the %llx debug dump above. You need to parse argv, symbolize each frame (using the kallsyms and addr2line mechanics you just learned), and emit one line per unique stack in root-to-leaf order (process at the base, leaf on top), with the count last. Building on the loop above, that’s roughly:
printf("%s", comm);                       /* process name at the base */
for (int i = u_n - 1; i >= 0; i--)        /* user frames, outermost first */
    printf(";%s", sym_user(uframes[i]));
for (int i = k_n - 1; i >= 0; i--)        /* then kernel frames */
    printf(";%s", sym_kernel(kframes[i]));
printf(" %llu\n", val);                   /* count */
A correct folded line for the cat /etc/passwd workload looks like this — the same kernel ladder from the Sharpen-your-pencil answer, leaf (vfs_read) on top:
cat;__libc_read;entry_SYSCALL_64;do_syscall_64;__x64_sys_read;ksys_read;vfs_read 137
In the resulting SVG: the wide base is the common process / syscall-entry frames shared by every sample, narrow towers are the divergent call paths, each frame’s width is proportional to its count, and vfs_read sits near the top of every tower (it’s the function you traced).
What to break, in order
Break 1 — Stack walk failure on BPF_F_USER_STACK
If your binary has frame-pointer-omitted libraries (most older distros), you’ll see uid < 0 for many calls — there’s no %rbp chain to follow and no DWARF the kernel can use, exactly as the unwinding section predicted. Workaround: trace fentry of a userspace-heavy function in a frame-pointer-enabled binary. Or, on Fedora/Ubuntu 24+, modern libc has frame pointers and user stacks resolve.
To debug, check bpf_get_stackid’s return value directly: the program already guards on uid < 0 (lines __s64 uid = ...; if (kid < 0 && uid < 0)), and that negative value is the errno explaining the failed user-stack walk. bpftool prog tracelog is empty by default here — this lab emits nothing to the trace pipe — so to use it you must add a printk on the failure path, e.g. in on_read:
if (uid < 0)
    bpf_printk("user-stack walk failed: uid=%lld\n", uid);
Then watch sudo bpftool prog tracelog (or sudo cat /sys/kernel/debug/tracing/trace_pipe) to see the negative errno fire when a frame-pointer-omitted library breaks the walk.
Break 2 — Forgetting MAX_STACK_DEPTH
Set value_size too small (16 * sizeof(__u64)). Stacks deeper than 16 frames get truncated. You’ll see plausible-looking but incomplete stacks. Default to 64 unless you have a reason to be smaller — and remember from the cap section that going above 127 buys nothing without raising perf_event_max_stack.
Break 3 — Use bpf_get_stack instead of bpf_get_stackid
__u64 frames[64];
int n = bpf_get_stack(ctx, frames, sizeof(frames), 0);
This copies frames directly into a buffer you provide (BPF_CALL_4(bpf_get_stack, ...) at kernel/bpf/stackmap.c:514) instead of going through the dedup map. Useful when you’re emitting one stack per event (e.g., to a ringbuf) rather than aggregating. Trade: more memory traffic, no dedup; but you have the frames immediately without a second map lookup.
Break 4 — Increase stack rate, fill the map
Trace a high-rate event like tcp_recvmsg on a busy server. With many unique stacks, you’ll fill max_entries=16384. When a new stack hashes to a slot already holding a different stack, bpf_get_stackid returns -EEXIST and the new stack is dropped — that’s the if (bucket && !(flags & BPF_F_REUSE_STACKID)) return -EEXIST; branch at stackmap.c:298 (build-id path) / :305 (normal path). So genuinely new stacks are silently lost. Pass BPF_F_REUSE_STACKID and the behavior flips: the occupied slot is overwritten instead (the xchg(&smap->buckets[id], new_bucket) at stackmap.c:317), so you keep the newest stack but lose the old one (and any counts keyed on the old stackid now point at the wrong frames).
Lesson: size stacks and counts to expected unique-stack cardinality. For most production servers, 16K–64K is fine. Profilers often go to 1M.
What to read in the kernel
kernel/bpf/stackmap.c— the implementation.stack_map_allocbuilds the map’s own structure (abuckets[]array plus a per-CPUpcpu_freelistof stack buffers — not the generichtab_map_alloc; seestruct bpf_stack_mapat:26), andbpf_get_stackid(:323) is the helper. Notestack_map_calculate_max_depth(:53) where the 127-cap clamp lives. Read the file once; ~800 lines.arch/x86/kernel/unwind_orc.c— the ORC unwinder x86_64 uses.orc_find(:209) andunwind_get_return_address(:380) are the heart of it. Don’t read deeply; just know it exists and is faster/more reliable than frame pointers.kernel/bpf/stackmap.c— searchbpf_get_stack(:514). The non-stackid version that copies frames directly.tools/lib/bpf/btf.candtools/perf/util/symbol.c— for inspiration on symbolization. The selftests don’t have a clean example.tools/testing/selftests/bpf/progs/stacktrace_map.c— minimal example of the pattern.
External reference (skim once): https://www.brendangregg.com/flamegraphs.html
Bullet Points
- A native call stack is a chain of return addresses pushed by
CALLinstructions. Unwinding recovers them leaf-first; that ordered list is the trace. (Distinct from the BPF program’s own R10 stack from Day 1/4.) - Two ways to unwind: frame pointers (
%rbplinked list, cheap but costs a register — why user stacks fail) and ORC (an out-of-band.orc_unwindtable the x86_64 kernel ships — why kernel stacks always work). BPF_MAP_TYPE_STACK_TRACEstores frame arrays keyed by hash; same stack → samestackid. Memory bounded by unique stacks.bpf_get_stackid(ctx, &stacks, flags)captures the current stack and returns a stackid. Use it as a key in another map for aggregation.BPF_F_USER_STACKwalks userspace — only works with frame pointers.- The syscall ladder
entry_SYSCALL_64 → do_syscall_64 → __x64_sys_read → ksys_read → vfs_readis the common base everyread()shares — the wide base of the flame graph. - 127-frame cap: the kernel clamps captured depth to
sysctl_perf_event_max_stack(defaultPERF_MAX_STACK_DEPTH = 127) regardless ofvalue_size. - Symbolization happens in userspace. Kernel frames:
/proc/kallsyms, root-only (kptr_restrict=1 zeros it), nearest-preceding-symbol (return addr is mid-function). User frames: subtract the load base from/proc/PID/maps(ASLR/PIE), thenaddr2line— except non-PIEET_EXEC. bpf_get_stack(no -id) copies frames directly to a buffer — preferred for per-event emission, not aggregation.- Flame graph format:
thread;fn1;fn2;fn3 countper line;flamegraph.plproduces interactive SVG.
Check question
Two CPUs simultaneously call bpf_get_stackid with identical stacks. Do they get the same stackid? Same map slot? Race?
Click to reveal answer
Answer: They get the same stackid (the hash of the frames is the same). They both target the same map slot. The kernel uses bucket-level locking inside the stack map — it compares the bucket with READ_ONCE(smap->buckets[id]) and installs with xchg(&smap->buckets[id], ...); one CPU’s insert wins and the other sees the existing entry and returns the same stackid without re-inserting. No race observable from BPF. The dedup is the whole point of this map type.
Tomorrow
Day 10: uprobes. Tracing functions in userspace binaries from BPF. We’ll attach to bash’s readline() and see every command typed.
Day 10 — Uprobes: tracing userspace from BPF
Today’s mission: trace a function in a userspace binary. Watch every command typed into bash by hooking
readline(). But first, understand the genuinely new machinery underneath: how an executable actually lives in memory, how the kernel patches a userspace instruction without corrupting it, and how it regains control when a function returns. Total time: ~110 minutes.
The other half of “what’s running on this machine”
Days 6–9 traced kernel functions. But your applications are mostly userspace — and many interesting events happen entirely in user code without touching syscalls (think: malloc, g_object_unref, PQexec, JIT compilation events).
Uprobes let BPF programs attach to userspace functions. The kernel patches the target binary’s executable pages with breakpoints; when any process executing that binary reaches the patched instruction, the trap fires and your BPF program runs.
It’s like kprobe — but the target is a function in /usr/bin/bash, /usr/lib/libssl.so.3, or your own myapp rather than vfs_read.
Here’s the thing the tutorials skip, though: tracing userspace code from the kernel is a genuinely different mechanism than the kernel-function patching you met earlier in the series. The closest kernel sibling is Day 7’s kprobe — the int3-trap path, not Day 1’s fentry (which patches a NOP→trampoline slot with no runtime trap). Three pieces of background make the difference, and the rest of today only makes sense once you have them:
- How an executable lives in memory — it isn’t copied into RAM; it’s
mmap’d from a file, and its pages are shared across every process running it. This is why one uprobe registration covers every bash on the system. - How the kernel patches a userspace instruction safely — it can’t just overwrite a shared, read-only, on-disk-backed page. It uses copy-on-write to get a private copy, writes a 1-byte
int3trap, and replays the displaced instruction out-of-line. - How the kernel regains control when a function returns — there’s no fixed instruction at a return site to patch, so it hijacks the return address. This is the whole trick behind uretprobes, which today’s lab depends on.
We’ll teach each as we hit the part of the lab that depends on it. Day 7’s kprobe used the same int3-trap primitive on kernel text in one shared address space; everything below is the userspace counterpart, and it is meaningfully different.
How an executable lives in memory: file-backed mmap, the page cache, and COW
Before we can patch a userspace instruction, we have to know where that instruction physically is. The intuition most people carry — “the program got loaded into RAM” — is wrong in a way that matters today.
A binary is not copied into RAM wholesale. When you run /usr/bin/bash, the loader does not slurp the file into memory. It mmap()s the file: it creates a file-backed mapping that says “this range of virtual addresses corresponds to these byte-offsets of this file.” The actual bytes are pulled in lazily, one page at a time, the first time the CPU touches them.
Where do those pages live? In the page cache — the kernel’s single, shared cache of file contents. A page of file data is keyed by (inode, file-offset): the inode identifies which file, the offset identifies which 4 KB chunk of it. (Recall the page from Day 1: physical RAM is handed out in PAGE_SIZE = 4 KB frames.) The crucial property:
Every process running the same binary maps the same physical pages. Two bash processes don’t each get their own copy of bash’s executable code. They both map the page-cache pages for (bash's inode, offset of .text), read-only and executable. One copy of the code in RAM, shared by all of them, plus the on-disk file backing it.
That shared page cache is exactly why a uprobe is system-wide. The breakpoint isn’t a property of a process — it’s a property of the inode. Because the probe is keyed to (bash-inode, readline's offset), the kernel walks every process (and every future mmap) that maps this inode and patches each one. It does not write once into the shared page-cache page to reach everybody — that would dirty a shared, file-backed page (exactly what the COW section below says it must avoid). The system-wide reach comes from the inode key plus the walk over all mappings, not from one shared write.
You can see the inode-identity in the kernel’s own data structure. A uprobe is identified by an inode pointer and a file offset — not a virtual address:
/* kernel/events/uprobes.c:62 — struct uprobe */
struct inode *inode;   /* the file the probe lives in (line ~69) */
loff_t        offset;  /* file-offset of the patched instruction (line ~74) */
And uprobe_register refuses a target that isn’t file-backed — there’d be no page cache to read the original instruction from:
/* kernel/events/uprobes.c:1402 */
/* copy_insn() uses read_mapping_page() or shmem_read_mapping_page() */
if (!inode->i_mapping->a_ops->read_folio &&
    !shmem_mapping(inode->i_mapping))
    return ERR_PTR(-EIO);
To remember the instruction it’s about to overwrite (so it can restore it on detach), the kernel reads the original byte straight out of the page cache, by offset:
/* kernel/events/uprobes.c:1058, inside __copy_insn() */
page = read_mapping_page(mapping, offset >> PAGE_SHIFT, filp);
offset >> PAGE_SHIFT is “which page of the file”; read_mapping_page pulls that page-cache page (__copy_insn at :1048, copy_insn at :1070).
Patching a shared page without corrupting it: copy-on-write
Now the problem. The page we want to patch is shared read-only across every process and backed by the on-disk file. If the kernel just wrote 0xCC into it, it would (a) hit every process at once with no control, and (b) risk dirtying a file-backed page. That’s not what we want — we want to patch one process’s view at a time.
The fix is copy-on-write (COW). COW is the trick that lets many mappings share one physical page until someone writes: at the moment of a write, the writer gets its own private writable copy of just that page, and everyone else keeps the original. The kernel forces that break deliberately before patching:
/* kernel/events/uprobes.c:518 — in uprobe_write() */
/*
 * When registering, we have to break COW to get an exclusive anonymous
 * page that we can safely modify. Use FOLL_WRITE to trigger a write
 * fault if required. ...
 */
if (is_register)
    gup_flags |= FOLL_WRITE | FOLL_SPLIT_PMD;   /* :526 */
It then verifies the page it got is a private anonymous folio before writing into it (the folio_test_anon check at :552). So the sequence per process is: break COW → the target process now has a private, writable, anonymous copy of that one page → write the int3 there. Other processes keep faulting on the clean shared page until they’re patched too.
This is what “COW protects other mappings” means, concretely. Day 7’s kprobe int3-poked kernel code: one address space, one copy, patched in place. Here the target is per-process userspace memory reached through a file-backed mapping, so the kernel must privately fork the page first. Genuinely different machinery.
The int3 trap and replaying the clobbered instruction
We’ve patched a byte. Two questions remain, and the second is the one every tutorial glosses over.
What byte, and what does it do? On x86_64 the breakpoint is a 1-byte instruction, 0xCC (int3), which raises the breakpoint exception:
/* arch/x86/include/asm/uprobes.h:20 */
#define UPROBE_SWBP_INSN      0xcc
#define UPROBE_SWBP_INSN_SIZE 1
set_swbp writes it; set_orig_insn restores it on detach — both go through the same uprobe_write_opcode / COW path above:
/* kernel/events/uprobes.c:612 */
int set_swbp(...)      { return uprobe_write_opcode(..., UPROBE_SWBP_INSN, true); }
/* kernel/events/uprobes.c:627 */
int set_orig_insn(...) { return uprobe_write_opcode(..., *(uprobe_opcode_t *)&auprobe->insn, false); }
When a thread executes that byte, the CPU traps into the kernel’s int3 exception entry (DEFINE_IDTENTRY_RAW(exc_int3) at arch/x86/kernel/traps.c:1004), which notifies the uprobe layer (uprobe_pre_sstep_notifier at kernel/events/uprobes.c:2871). The dispatcher handle_swbp (uprobes.c:2712) looks up the active uprobe by faulting address (find_active_uprobe_rcu, :2724) and runs your BPF program via handler_chain (:2549, the consumer’s handler is invoked at :2549–2566). The trap builds a pt_regs snapshot of the user registers — the same pt_regs you read with PT_REGS_PARM* on Day 7 — and hands it to your program.
Now the puzzle nobody explains. The original instruction is gone — you overwrote its first byte with 0xCC. After your BPF program runs, how does the thread execute the instruction it was supposed to, and continue?
The answer is execute-out-of-line (XOL). The kernel never removes the int3 during tracing; instead it keeps the saved original instruction and replays it elsewhere:
- At first hit, the kernel allocates a per-process executable scratch page — the
xol_area(struct xol_areaatkernel/events/uprobes.c:109). - It copies the saved original instruction (arch-fixed-up if needed) into a slot there (
xol_get_insn_slotat:1871; the bytes live inarch_uprobe.ixol[],arch/x86/include/asm/uprobes.h:33). - It points the user instruction pointer at that slot, single-steps that one instruction, then the arch post-XOL handler relocates the IP back into the original code stream —
default_post_xol_opappliesregs->ip += utask->vaddr - utask->xol_vaddr(arch/x86/kernel/uprobes.c:1240), landing right after the original instruction.
The 0xCC byte stays patched in the shared/COW page the whole time. So one uprobe hit costs: trap into the kernel (~50 ns) + your BPF program’s time + a single-step of the displaced instruction. Detach reverses everything — set_orig_insn writes the saved original byte back over the int3.
Why doesn’t this corrupt other threads? Because the int3 is never removed while tracing. Threads serialize through the trap; each one single-steps its own copy of the instruction in its own xol slot. No thread ever sees a half-patched instruction.
Tie it back to Day 7’s kprobe: same int3-trap primitive — overwrite the first byte, trap into the kernel, run your program. The difference is recovery: a kprobe single-steps the original instruction in place; a uprobe replays it out-of-line in a per-process XOL slot because the target is shared, file-backed userspace memory. (Day 1’s fentry is a different mechanism — a NOP→trampoline patch with no runtime trap.)
There are no Dumb Questions
Q: Does my uprobe affect other processes running the same binary?
A: Yes — by design. The breakpoint is per-binary-inode, not per-process (that’s the whole point of the page-cache section above: the patch is keyed to the inode, and every process maps the same inode’s pages). If you uprobe
/usr/bin/bash:readline, every running bash and every future bash gets the breakpoint until you detach. This is what lets you do system-wide observability without restarting workloads.Q: What if the target process exits while I’m attached?
A: Nothing breaks. The uprobe remains registered against the inode. New invocations get hooked. Old processes that exited just disappear. The uprobe lives until you detach (close the link FD).
Q: Can I uprobe a function in a JIT-compiled language (e.g., Java methods, V8 functions)?
A: Not with regular uprobes — those addresses don’t exist at attach time; they’re generated at runtime. The runtime would need to expose USDT probes (we’ll see those below) or generate
perf-PID.mapfiles for symbolization. For Java, the JVM can be configured to emit USDT events; tools like async-profiler use this.
Catching a return: return-address hijack and the trampoline
Everything above describes an entry uprobe: trap on a fixed instruction. But today’s lab hooks the return of readline() — because the line the user typed is readline’s return value, not an argument. And a return is a problem: there is no single fixed instruction at the return site to patch. A function can be called from a hundred places and ret to a hundred different addresses.
The kernel solves this with return-address hijacking. When the entry breakpoint fires for a function you’ve uretprobed, the kernel:
- Reads the real return address off the user stack.
- Saves it on a per-task stack of pending returns.
- Overwrites the stack’s return-address slot with the address of a kernel-installed userspace trampoline (
prepare_uretprobeatkernel/events/uprobes.c:2252; trampoline address fromuprobe_get_trampoline_vaddrat:2223).
When the function later runs its normal ret, control lands on the trampoline. On the pinned v7.1 kernel, for a native 64-bit process (the lab traces native x86_64 bash) the trampoline is not a breakpoint — arch_uretprobe_trampoline() (arch/x86/kernel/uprobes.c:349) hands back a short syscall sequence for user_64bit_mode(regs):
/* arch/x86/kernel/uprobes.c:320–343 — uretprobe_trampoline_entry */
push %rax
push %rcx
push %r11
mov  $__NR_uretprobe, %rax
syscall
/* uretprobe_syscall_check: pop %r11; pop %rcx; ret; int3 */
So when readline returns into the trampoline, it executes the uretprobe(2) syscall rather than trapping on an int3. SYSCALL_DEFINE0(uretprobe) (uprobes.c:372) validates the caller IP, then calls uprobe_handle_trampoline(regs) (uprobes.c:401; generic side at kernel/events/uprobes.c:2635) — that’s where your uretprobe consumers run and the real return address is restored.
The older int3 trampoline is still in the tree, but it’s now the fallback for 32-bit/compat processes (the asm even notes “the compat process still uses standard breakpoint”; the trailing int3 after ret is just a guard). On that path, handle_swbp recognizes the trampoline address specially:
/* kernel/events/uprobes.c:2718, in handle_swbp() — compat/fallback path */
if (bp_vaddr == uprobe_get_trampoline_vaddr())
    return uprobe_handle_trampoline(regs);
At that point your uretprobe BPF program runs, PT_REGS_RC holds the return value (for readline, the malloc’d char * the user typed), and the kernel restores the saved real return address so the caller resumes none the wiser.
Because calls nest, the kernel keeps a per-task LIFO stack of pending returns — utask->return_instances (walked at uprobes.c:2019, :2062; pushed at :2307). Each hijacked frame pushes one entry; each return pops the matching one in last-in-first-out order. That’s why a uretprobe fires correctly through deep recursion and many stack frames.
This is also why the lab declares the return value as the “first parameter” (more below): at the return trap there are no argument registers left to read — the arguments are long gone — only the return register survives. It’s the exact analogue of the kretprobe PT_REGS_RC you met on Days 6–7.
Where to attach: ELF anatomy
Your target binary is an ELF file. To attach by name, libbpf has to turn binary:symbol into the file offset the kernel registers against the inode. That resolution runs through the binary’s symbol tables — and you need to know there are two of them, because today’s Break 2 depends on the difference.
An ELF file can carry two symbol tables:
.symtab— the full symbol table: every function, including local/static helpers. This is whatstripdeletes to shrink a binary. A stripped/bin/bashhas an empty.symtab..dynsym— the dynamic symbol table: only the symbols needed for dynamic linking (a shared library’s exported functions, a binary’s imported symbols). It survives stripping, because the dynamic loader needs it at runtime to wire up shared libraries.
libbpf searches .dynsym first, then .symtab — and the source spells out exactly why that order, and why a missing section is normal rather than an error:
/* tools/lib/bpf/elf.c:278 */
int i, sh_types[2] = { SHT_DYNSYM, SHT_SYMTAB };
/* ...:306 — comment:
 * Search SHT_DYNSYM, SHT_SYMTAB for symbol. This search order is used because
 * if a binary is stripped, it may only have SHT_DYNSYM, and a fully-statically
 * linked binary may not have SHT_DYNSYM, so absence of a section should not be
 * reported as a warning/error.
 */
So the common path is just: write SEC("uprobe//path/to/binary:symbol_name"). libbpf opens the ELF (bpf_program__attach_uprobe at tools/lib/bpf/libbpf.c:12966 → elf_find_func_offset_from_file at :12817 → elf_find_func_offset at elf.c:277), finds the symbol, and computes its file offset from the symbol’s value and the ELF program-header layout. What the kernel ultimately registers is (inode, offset) — the offset must be page-alignable and within the file size (uprobe_register checks at kernel/events/uprobes.c:1407–1413).
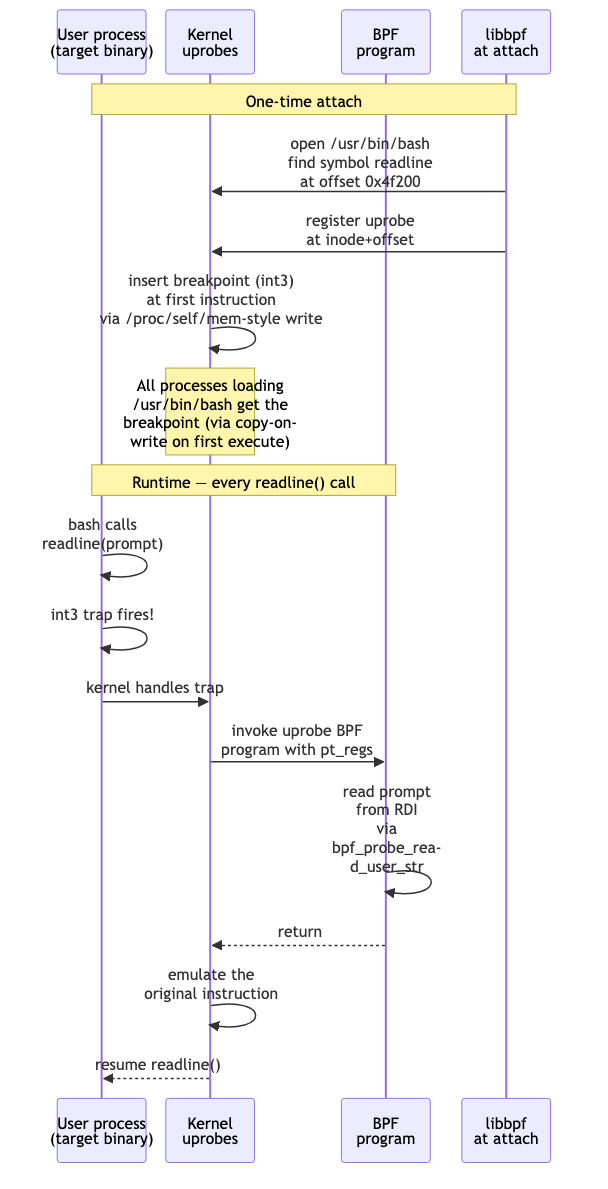
A subtlety worth holding onto for Break 2: the symbol’s recorded value is a virtual address, and the file offset libbpf needs are not always identical. For the common executable code segment they usually coincide, which is why the nm -D value can be handed to the kernel directly below. When a symbol exists in neither table (a private static in a stripped binary), you fall back to supplying the file offset yourself:
SEC("uprobe//usr/bin/stripped_app:0x1234")
Tools map onto the tables directly: nm -D / objdump -T read .dynsym; objdump -t reads .symtab (empty on a stripped /bin/bash); objdump -d disassembles so you can eyeball an offset when no symbol exists at all.
Argument access in uprobes
This is prerequisite knowledge you already have. Recall from Day 7: for a trap-based probe the ctx is a struct pt_regs * register snapshot, and BPF_KPROBE/BPF_KRETPROBE expand PT_REGS_PARM1..6 to the System V AMD64 argument registers (rdi, rsi, rdx, rcx, r8, r9), with PT_REGS_RC = rax for the return value (the macros live in tools/lib/bpf/bpf_tracing.h; Day 7 verified PT_REGS_PARM1 maps to di).
The only uprobe-specific twist: these macros work unchanged for userspace targets, because the int3 trap snapshots the user registers into the very same pt_regs shape. So: same as kprobes — args in rdi…r9, return in rax.
For string arguments, you need bpf_probe_read_user_str (not _kernel):
char buf[64];
bpf_probe_read_user_str(buf, sizeof(buf), (void *)PT_REGS_PARM1(ctx));
The “_user” variant tells the kernel “this address is in userspace; use copy_from_user semantics, not direct deref.” Misusing _kernel on a user pointer doesn’t crash: the kernel-nofault helper checks the address range first and rejects a userspace pointer up front (on x86, copy_from_kernel_nofault_allowed returns false for addr < TASK_SIZE_MAX, so strncpy_from_kernel_nofault returns -ERANGE — an address-range rejection, not an actual page fault), and bpf_probe_read_kernel_str then zeroes the destination buffer on the negative return.
USDT: probes built into binaries
What if your application wants to be observable? Some major libraries (libc, libpthread, postgres, mysql, openssh) ship with USDT probes — user-space statically defined tracing. These are nop instructions placed by the developer at points of interest, accompanied by ELF metadata describing the arguments.
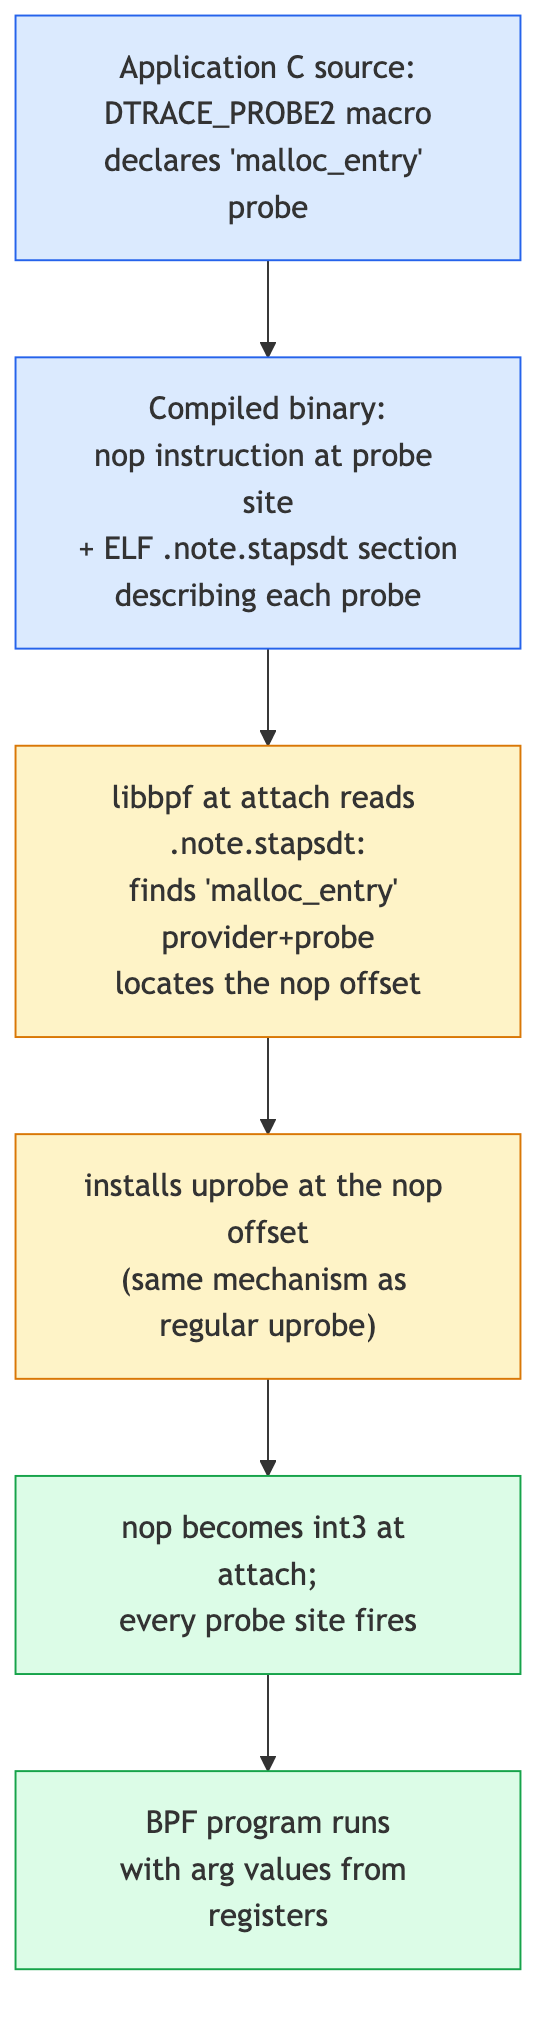
You attach with SEC("usdt//path:provider:probe"). libbpf reads the .note.stapsdt ELF section, finds the matching provider+probe, locates the nop offset, and installs a regular uprobe there.
Discover USDTs with:
sudo bpftrace -l 'usdt:/usr/lib/x86_64-linux-gnu/libc.so.6:*'
libc’s USDTs include lll_lock_wait, lll_lock_wait_private, setjmp, longjmp. Postgres has query__start, query__done. They’re a stable contract from the application.
Sharpen your pencil
Bash is a single-process per terminal session. You uprobe
readlineand observe nothing — but you’re definitely typing in another terminal. What’s wrong?.
.
.Answer: likely one of: (a) bash version mismatch — the bash on disk and the bash running might differ if you’re inside a shell started before a system upgrade. Restart your shell. (b) bash’s
readlinemay be statically linked or inlibreadline.so.8rather than the bash binary itself —nm /usr/bin/bash | grep readlineto confirm. If empty, attach to libreadline instead. (c) PATH issue —which bashgives one path; the running shell may have started from a different one (e.g.,/bin/bashsymlink resolution).
The lab
bashspy.h — the shared event record
#ifndef PRACTICAL_EBPF_BASHSPY_H
#define PRACTICAL_EBPF_BASHSPY_H

#define MAX_LINE 256

struct event {
    unsigned int pid;
    char comm[16];
    char line[MAX_LINE];
};

#endif
bashspy.bpf.c
The output channel is a ringbuf — recall it from Day 1: a kernel→userspace MPSC channel where you reserve a slot, fill it, and submit (zero-copy), and a single userspace consumer drains it via a callback. Nothing uprobe-specific; just the same pattern.
#include "vmlinux.h"
#include <bpf/bpf_helpers.h>
#include <bpf/bpf_tracing.h>

#include "bashspy.h"

char LICENSE[] SEC("license") = "GPL";

struct {
    __uint(type, BPF_MAP_TYPE_RINGBUF);
    __uint(max_entries, 256 * 1024);
} rb SEC(".maps");

/* Track the prompt arg per TID so we can read the result on return.
 * For readline, the *return value* is what the user typed —
 * a malloc'd char* the caller frees.
 */

SEC("uretprobe//bin/bash:readline")
int BPF_KRETPROBE(on_readline_ret, const char *line)
{
    if (!line) return 0;

    struct event *e = bpf_ringbuf_reserve(&rb, sizeof(*e), 0);
    if (!e) return 0;

    e->pid = bpf_get_current_pid_tgid() >> 32;
    bpf_get_current_comm(&e->comm, sizeof(e->comm));
    bpf_probe_read_user_str(&e->line, sizeof(e->line), line);

    bpf_ringbuf_submit(e, 0);
    return 0;
}
What’s new
SEC("uretprobe//bin/bash:readline")— uretprobe (return) on bash’s readline. The kernel will hijackreadline’s return address on entry and regain control at the trampoline, as the return section described. Adjust the path to your bash (which bash).BPF_KRETPROBE(on_readline_ret, const char *line)— for uretprobe, the first declared parameter after the function name is the return value, not an argument. (This is exactly why: at the return trap onlyPT_REGS_RC/raxsurvives — the argument registers are long gone.) Same as kretprobe.bpf_probe_read_user_str— user, not kernel. The pointer is in user memory.(const char *)cast in the parameter declaration — the macro will treat the return value as that type for size determination.
bashspy.c — userspace consumer
static int handle(void *ctx, void *data, size_t sz) {
    struct event *e = data;
    printf("[bash %u (%s)] %s\n", e->pid, e->comm, e->line);
    return 0;
}
Run
make
sudo ./bashspy &

# In another terminal, start a bash and type:
bash
echo hello
ls /tmp
Expected:
[bash 4001 (bash)] echo hello
[bash 4001 (bash)] ls /tmp
Don’t worry if your run doesn’t match this block line-for-line. The probe is system-wide, so you’ll also see the bash line you typed to launch the inner shell (the outer shell’s readline fired under a different PID), plus anything typed in any other interactive bash on the box. The PID will differ from 4001 — it’s arbitrary. And only interactive, readline-edited lines appear: commands fed via a script or a pipe never touch readline, so they won’t show up. Extra or missing lines here are normal, not a sign of a broken attach.
When you’re done, stop the spy and leave the test shell: run sudo kill %1 (or sudo pkill -f bashspy) in the first terminal to detach the uprobe, and exit the bash you spawned in the second terminal. Leaving bashspy running keeps the int3 breakpoint patched into every bash on the system — and an orphaned root daemon hanging around.
You’re now spying on every command typed into every bash on the system. For your own systems, treat this as a powerful debugging tool. For other people’s systems, this is the kind of thing that requires authorization.
What to break, in order
Break 1 — Path mismatch
SEC("uprobe//bin/bash:readline")
If your bash is at /usr/bin/bash (not /bin/bash), libbpf fails to attach:
libbpf: prog 'on_readline_ret': failed to attach: -ENOENT
The path has to resolve to the right inode — remember, the uprobe is registered against (inode, offset), so a wrong path means a wrong (or nonexistent) inode and the registration never happens. Fix: which bash and use the full path.
Break 2 — Stripped binary, missing symbol
Try a symbol that doesn’t exist in the table:
SEC("uprobe//bin/bash:internal_static_helper")
Resolution fails — libbpf can’t find internal_static_helper in .dynsym or .symtab. The job libbpf normally does for you is: search both symbol tables (dynsym first), look up the name, compute the file offset. When the name is gone (the binary is stripped, or the symbol is a private static that was never in .dynsym), you supply the offset yourself.
To see the fallback work, pick a symbol that does exist and grab its offset. /bin/bash is usually stripped of its .symtab, so objdump -t is empty — use the dynamic symbol table (.dynsym, which survives stripping) instead:
nm -D /bin/bash | grep -w readline
# 0000000000105e20 T readline
(objdump -T /bin/bash | grep -w readline shows the same thing — both read .dynsym.) That recorded value is a virtual address; for bash’s code segment it coincides with the file offset, so you can hand it to the kernel directly:
SEC("uprobe//bin/bash:0x105e20")
libbpf could have resolved readline by name — the offset form is exactly what you fall back to when the name isn’t available. (This 0x105e20 is bash-version-specific; always re-read it with nm -D for your binary rather than copying it verbatim.)
Break 3 — Use kernel-side _kernel_str on a user pointer
bpf_probe_read_kernel_str(&e->line, sizeof(e->line), line); /* WRONG */
The helper returns negative and the destination is zeroed. On x86 the kernel-nofault path doesn’t even fault: copy_from_kernel_nofault_allowed rejects a userspace address by range (addr < TASK_SIZE_MAX), so strncpy_from_kernel_nofault returns -ERANGE and bpf_probe_read_kernel_str zeroes the buffer. Always _user for uprobe-derived pointers.
Break 4 — Convert uretprobe to uprobe
SEC("uprobe//bin/bash:readline")
int BPF_KPROBE(on_call, const char *prompt)
{
    /* prompt is the *argument* — what bash is asking */
}
Now you’re at entry, not return — a single int3 on readline’s first instruction, no return-address hijack. So you see prompt strings ("$ ", "PS1", etc.) read from rdi/PT_REGS_PARM1 instead of typed lines. To get the typed line, you need to be at return, where the function gives back its result in rax. That’s what uretprobe is for.
Break 5 — Multi-args with mixed types
SEC("uprobe//usr/lib/libssl.so.3:SSL_write")
int BPF_KPROBE(on_ssl_write, void *ssl, const void *buf, int num)
{
    char preview[32] = {0};
    bpf_probe_read_user(preview, sizeof(preview) - 1, buf);
    bpf_printk("SSL_write %d bytes: %s", num, preview);
    return 0;
}
You’re now reading plaintext that’s about to be encrypted — ssl from rdi, buf from rsi, num from rdx, exactly the System V ordering from Day 7. (Don’t deploy this on someone else’s system.) Note: the libssl path varies by distro and even by process. Find the library actually loaded by your target with cat /proc/<pid>/maps | grep -i ssl — commonly /usr/lib/x86_64-linux-gnu/libssl.so.3 on Debian/Ubuntu, /usr/lib/libssl.so.3 on Arch, /usr/lib64/libssl.so.3 on Fedora/RHEL — since a process may also bundle its own OpenSSL. Update the SEC string to match the path you find. (Because libssl.so.3 is a shared library, its .dynsym exports SSL_write even when stripped — no offset fallback needed.)
What to read in the kernel
kernel/events/uprobes.c— overview. The functionuprobe_registeris the entry point. Notefind_uprobe_rcuandset_swbp/set_orig_insnfor the breakpoint patching mechanics.tools/lib/bpf/libbpf.c— searchbpf_program__attach_uprobe. This is where libbpf opens the ELF, resolves symbols, and registers the uprobe via the kernel’sperf_event_open.tools/testing/selftests/bpf/progs/uprobe_multi.c— multi-uprobe (next day’s topic) examples.Documentation/trace/uprobetracer.rst— the kernel’s doc on uprobes from a tracing perspective.tools/lib/bpf/usdt.c— USDT support in libbpf. The.note.stapsdtparser is here.
External: Brendan Gregg’s USE method posts and bpftrace examples for uprobe usage patterns.
Bullet Points
- An executable isn’t copied into RAM — it’s
mmap’d from a file, and its pages live once in the page cache, keyed by (inode, file-offset) and shared read-only/exec across every process running it. - A uprobe is identified by
(inode, offset), not a virtual address. That’s why it’s system-wide: the kernel walks every running and future process that maps the inode and patches each — no app changes, no restarts. - Patching a userspace instruction uses copy-on-write. The kernel breaks COW to get a private writable page, then writes a 1-byte
int3(0xCC) — it never dirties the shared/on-disk page. - The clobbered instruction is replayed out-of-line (XOL). The
int3stays patched; each thread single-steps its own saved copy in its own xol slot, then resumes after the original. - Uretprobes hijack the return address. On entry the kernel saves the real return address on a per-task LIFO stack and redirects the return to a trampoline
int3; at the return trapPT_REGS_RCholds the result. SEC("uprobe//path:symbol")for entry;SEC("uretprobe//...")for return.BPF_KPROBE/BPF_KRETPROBEmacros work for uprobes too — samept_regsctx, args inrdi…r9, return inrax(Day 7).- String args use
bpf_probe_read_user_str(not_kernel). - Two ELF symbol tables:
.symtab(full, removed bystrip) and.dynsym(dynamic, survives stripping). libbpf searches dynsym→symtab; when a symbol’s in neither, fall back to a literal file offset (nm -D/objdump -d). - USDT probes are nops + ELF metadata, intentionally placed by app authors. Attached via
SEC("usdt//path:provider:probe").
Check question
Why is bpf_probe_read_user_str necessary instead of just dereferencing the userspace string pointer directly?
Click to reveal answer
Answer: Two reasons. (1) Memory safety: the user pointer might be invalid (NULL, freed, mid-tearing of the calling process); direct deref would oops the BPF program. bpf_probe_read_user_str uses copy_from_user semantics that fault-handle gracefully, returning -EFAULT if the memory isn’t accessible. (2) Address-space awareness: uprobes fire in process context with the user’s mm active, but the BPF runtime treats userspace memory as “untrusted” and requires the explicit helper that knows it’s reading from the user page tables. The Verifier rejects raw deref of pointers from pt_regs for the same reason.
Tomorrow
Day 11: multi-{u,k}probe — efficient attach to many functions at once. The newer batch-attach mechanism that scales to thousands of probes without thousands of perf_event_open syscalls.
Day 11 — Multi-probe: attach to many functions in one syscall
Today’s mission: trace every filesystem syscall (read, write, open, close, fsync, …) with one BPF program attached to all of them at once. Along the way, learn the third attach mechanism the kernel has — fprobe — that makes batch-attaching a thousand functions cheap, how a glob like
vfs_*becomes a sorted array of addresses, and how one program tells its N probes apart. Total time: ~95 minutes.
The problem with one-by-one
Yesterday’s uprobes attach one function at a time. That works for a handful of probes. But what if you want to trace every syscall? Every function in the VFS layer? Every TCP entry point?
In the old model, you’d loop in userspace:
for (int i = 0; i < N; i++) {
    bpf_program__attach_kprobe(prog, false, names[i]);  /* one syscall each */
}
For N=200, that’s 200 perf_event_open syscalls, 200 kernel kprobe objects, 200 BPF links. Startup takes seconds. Memory grows linearly. Detach is similarly slow.
Multi-probe (added in kernel 5.18, commit 0dcac272540 for kprobe.multi) is the modern fix.
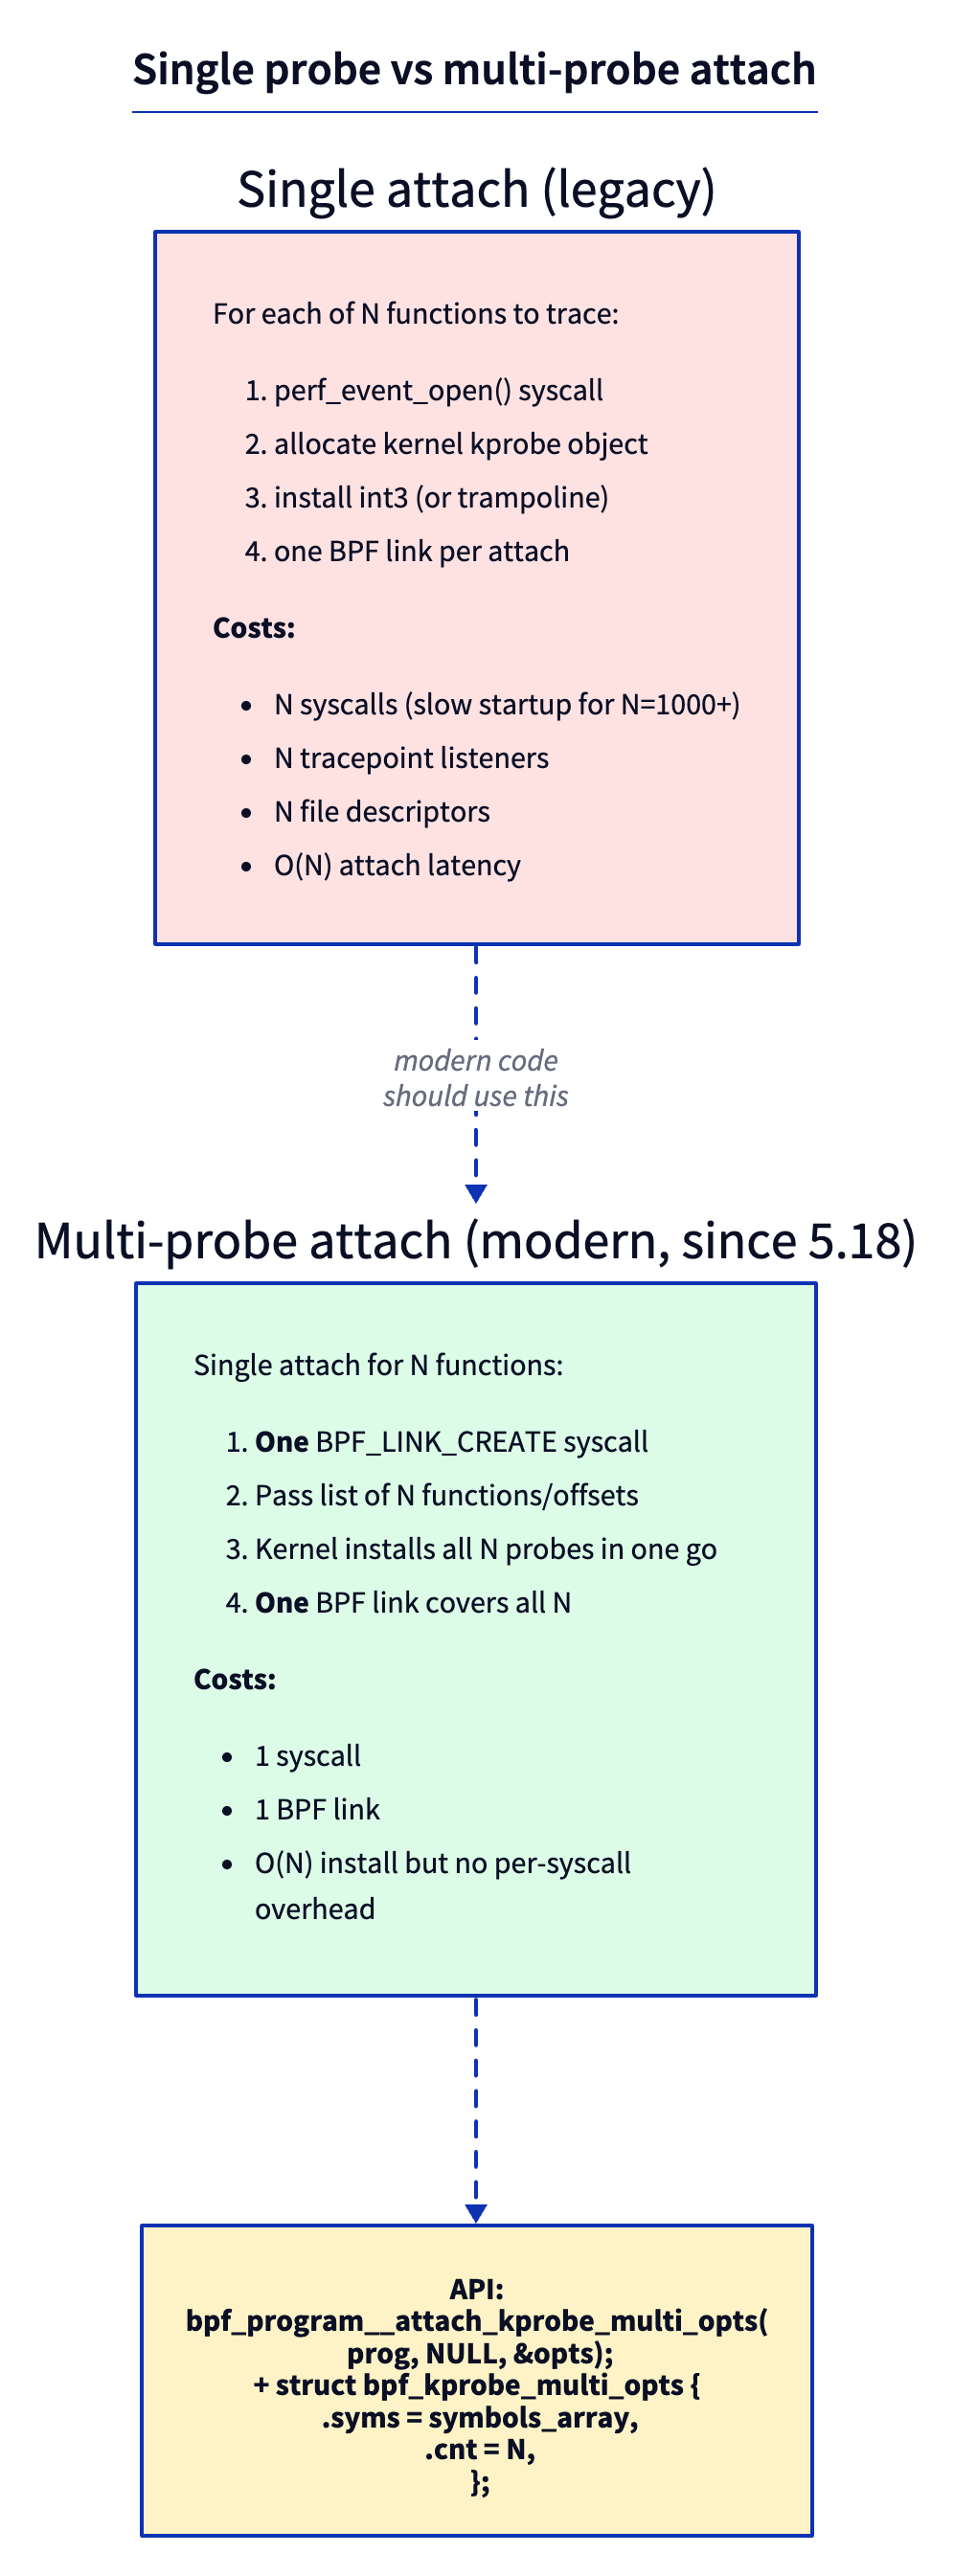
One syscall, one BPF link, N probes installed in one kernel-side batch.
But “one kernel-side batch” is doing a lot of work in that sentence, and the whole performance story of this chapter rests on how the batch is installed and run. Day 1 introduced fentry’s trampoline path and contrasted it with the older kprobe int3 trap; Day 6 added fexit. Today there’s a third attach mechanism, and it’s the one kprobe.multi rides on. Let’s name it before we lean on it.
What “fprobe-backed” actually means
Recall the two attach mechanisms Day 1 introduced (with fexit added in Day 6):
- kprobe patches the target instruction with an
int3software breakpoint. When the CPU hits it, it traps — a relatively expensive exception that vectors into the kprobe handler, which eventually calls your BPF program. One breakpoint per function. - fentry/fexit (Days 1 and 6) use ftrace’s 5-byte NOP patch-site that every function carries at its entry, and route through a per-target BPF trampoline — a small chunk of generated code wired to one function. No trap; execution flows straight through. Cheaper per call, but one trampoline per attach target.
kprobe.multi is built on a third thing, also ftrace-based, called an fprobe.
The intuition first. Imagine you want a breakpoint on a thousand functions. The kprobe way is a thousand independent text-pokes — a thousand int3 bytes written into a thousand call sites, a thousand kernel objects to track. The fprobe way is one client that says to ftrace: “here is a sorted array of a thousand addresses; call me when execution reaches any of them.” ftrace already maintains the machinery to multiplex many call sites onto shared handler code (it’s how ftrace function tracing itself works). An fprobe is one customer of that machinery registered against a whole array at once.
Concretely, an fprobe is a single small struct:
/* include/linux/fprobe.h:62 */
struct fprobe {
    unsigned long       nmissed;          /* counter for missed events */
    unsigned int        flags;
    size_t              entry_data_size;
    fprobe_entry_cb     entry_handler;    /* called on function entry */
    fprobe_exit_cb      exit_handler;     /* called on function return */
    struct fprobe_hlist *hlist_array;     /* hash of the IPs this fprobe covers */
};
One struct fprobe, one entry_handler, an hlist_array of the addresses it covers. That’s why N functions install in one batch instead of N separate int3 patches.
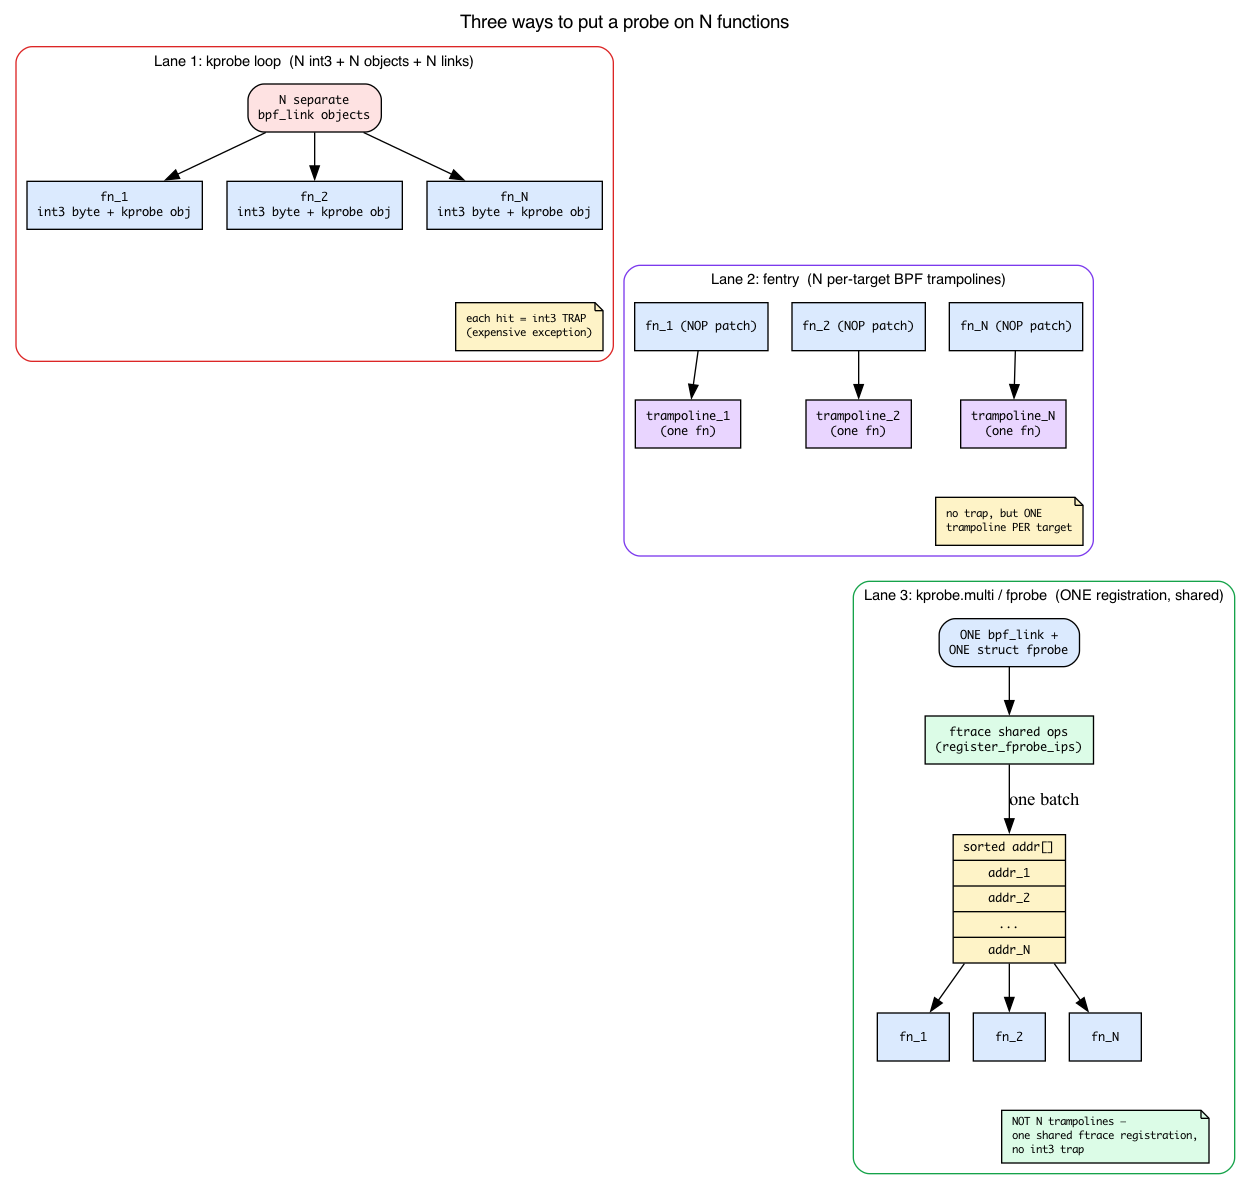
fprobe is not fentry’s trampoline
It is tempting to assume fprobe reuses the per-target BPF trampoline Day 1 described. It does not, and the distinction matters. fprobe hangs off ftrace’s shared graph/ops machinery. You can see the fork in the source:
/* kernel/trace/fprobe.c:982 — register_fprobe_ips() */
if (fprobe_is_ftrace(fp))
    ret = fprobe_ftrace_add_ips(addrs, num);
else
    ret = fprobe_graph_add_ips(addrs, num);
Depending on whether the probe needs a return/exit handler, registration routes to ftrace’s ftrace_ops path or its function-graph (fgraph) path. Neither is a per-function BPF trampoline. The honest one-sentence statement is:
fprobe is ftrace-based like fentry — so it avoids the
int3trap — but it isftrace_ops/fgraph, not a per-function BPF trampoline.
That distinction doesn’t weaken the performance argument; it sharpens it. Here is the real reason kprobe.multi beats a one-by-one kprobe loop, on both axes:
- Install is one ftrace operation over a sorted address array, not N separate
int3text-pokes. The kernel registers a single fprobe covering the wholeaddrs[]array (register_fprobe_ips(&link->fp, addrs, cnt)). - At runtime there is no
int3trap. Execution reaches the shared ftrace handler directly — the exact same reason fentry beats kprobe in Day 1.
The ceiling, and the hard requirement
A single multi-attach is capped. The kernel defines:
/* kernel/trace/bpf_trace.c:44 */
#define MAX_KPROBE_MULTI_CNT (1U << 20)   /* ~1,048,576 */
and rejects anything larger up front in bpf_kprobe_multi_link_attach:
/* kernel/trace/bpf_trace.c — inside bpf_kprobe_multi_link_attach */
if (!cnt)
    return -EINVAL;
if (cnt > MAX_KPROBE_MULTI_CNT)
    return -E2BIG;
So the “1000 functions” number in this chapter has a real ceiling of ~1M addresses; over that you get -E2BIG. (And zero matches gets -EINVAL — hold that thought for Break 4.)
Finally, the whole mechanism is gated on a config option. kprobe.multi requires CONFIG_FPROBE=y. Without it, the entire attach entry point compiles down to a stub:
/* kernel/trace/bpf_trace.c:2890 — the #else /* !CONFIG_FPROBE */ branch */
int bpf_kprobe_multi_link_attach(const union bpf_attr *attr, struct bpf_prog *prog)
{
    return -EOPNOTSUPP;
}
That’s why, without CONFIG_FPROBE, attach fails outright with -EOPNOTSUPP rather than silently degrading to a slow loop. (The full prerequisite check is in the Run section below.)
From glob to addresses: who does what
SEC("kprobe.multi/vfs_*") hides a two-stage pipeline that is easy to blur into one step. The honest split is the opposite of the tempting guess: for a glob, userspace (libbpf) does both the glob expansion and the name→address resolution; the kernel just receives a ready-made array of addresses and registers it. Let’s walk both sides.
Userspace side (libbpf). Day 9 already taught you /proc/kallsyms: kptr_restrict zeroes the addresses for non-root, the file is not address-sorted, and you find a symbol by scanning for the nearest preceding entry. (We use exactly that fact for the lookup_ksym sketch later.) But for a SEC("kprobe.multi/glob") attach, libbpf may not need /proc/kallsyms at all — it depends on what tracefs exposes. The precedence is:
/* tools/lib/bpf/libbpf.c — inside bpf_program__attach_kprobe_multi_opts */
if (has_available_filter_functions_addrs())
    err = libbpf_available_kprobes_parse(&res);   /* modern: addr+name pairs */
else
    err = libbpf_available_kallsyms_parse(&res);   /* fallback: names + kallsyms */
On a modern kernel, tracefs exposes available_filter_functions_addrs — a file listing each instrumentable function as an address + name pair. libbpf_available_kprobes_parse reads addresses straight out of it, globs the names, and never opens /proc/kallsyms (this devbox has that file). On older kernels lacking it, libbpf falls back to libbpf_available_kallsyms_parse, which globs the names from available_filter_functions and then calls libbpf_kallsyms_parse (which fopens /proc/kallsyms) to turn those names into addresses. Either way the result is the same: libbpf produces a resolved res.addrs array in userspace. Using available_filter_functions (rather than raw kallsyms) for the name set matters: it already excludes notrace and inlined functions you could never attach to, so the glob can’t hand back a name that’s doomed to fail.
Kernel side. libbpf sets lopts.kprobe_multi.addrs = addrs and syms = NULL, so the kernel takes the address branch. It validates that exactly one of the two is set, then just copies the array in and moves on:
/* kernel/trace/bpf_trace.c — inside bpf_kprobe_multi_link_attach */
if (!!uaddrs == !!usyms)
    return -EINVAL;            /* exactly one of addrs[] or syms[] */
...
if (uaddrs) {                  /* glob path: addresses already resolved */
    if (copy_from_user(addrs, uaddrs, size))
        return -EFAULT;
} else {                       /* explicit names path: resolve in-kernel */
    err = copy_user_syms(&us, usyms, cnt);
    sort_r(us.syms, cnt, ...);
    err = ftrace_lookup_symbols(us.syms, cnt, addrs);
}
For a glob the kernel never sees names: it copy_from_users the address array and goes straight to register_fprobe_ips. The in-kernel name→address resolution (copy_user_syms → sort_r → ftrace_lookup_symbols) is the other branch — taken only when the caller passes an explicit opts.syms[] list or a single exact (wildcard-free) name. That path is where the chapter’s single-O(N)-pass-over-kallsyms story actually lives; see Break 1.
The single-pass detail (the usyms branch only). It is easy to assume ftrace_lookup_symbols is N independent log-N lookups into kallsyms. It is actually a single O(N) pass:
/* kernel/trace/ftrace.c:9262 — ftrace_lookup_symbols doc block */
/* ... kallsyms_on_each_symbol() with binary search into the sorted input
 * array.
 * Returns: 0 if all provided symbols are found, -ESRCH otherwise.
 */
The kernel walks kallsyms once (kallsyms_on_each_symbol), and for each symbol it sees, does a bsearch into your already-sorted name array. That’s why the names get sorted first: so the single pass can binary-search them. One sweep over kallsyms, not N sweeps. And if even one name doesn’t resolve, the whole attach fails with -ESRCH. Again, this only runs for the explicit-names path, not for a glob.
So the failure modes split by path:
- Glob, zero matches (
vfs_xyz_nope*expands to nothing): caught in userspace —libbpf_available_kprobes_parse/libbpf_available_kallsyms_parsereturn-ENOENTwhenres.cnt == 0, before any syscall. The kernel’sif (!cnt) return -EINVALnever runs (it only fires if a caller explicitly passescnt == 0through the opts API). This is Break 4. - Explicit names, one doesn’t resolve: the kernel’s
ftrace_lookup_symbolsreturns-ESRCH. Only theusymsbranch can hit this.
How to know which probe fired
When 50 functions all run the same BPF program, you need a way to tell them apart. The ctx (the saved registers) has the same shape for every target, so it can’t distinguish them — the only thing that differs is which function’s entry you’re sitting at. That’s what bpf_get_func_ip(ctx) gives you, and it’s worth understanding where that IP actually comes from, because it’s the load-bearing dispatch primitive for the whole chapter.
Where the IP comes from. When a target fires, fprobe calls the entry handler with the fentry_ip — the instrumented call site. The kprobe.multi handler converts that to the actual function entry address and stashes it in the per-invocation run context:
/* kernel/trace/bpf_trace.c:2592 — kprobe_multi_link_handler */
err = kprobe_multi_link_prog_run(link, ftrace_get_entry_ip(fentry_ip),
                                 fregs, false, data);
/* kernel/trace/bpf_trace.c:2319 — ftrace_get_entry_ip() */
unsigned long ip = ftrace_get_symaddr(fentry_ip);
return ip ? : fentry_ip;       /* resolved symbol address, or the call site */
So by the time your program runs, the resolved function entry address is already sitting in the run context.
bpf_get_func_ip is not one helper. The verifier swaps in a program-type-specific implementation depending on what kind of probe you are. For kprobe.multi it resolves to bpf_get_func_ip_kprobe_multi:
/* kernel/trace/bpf_trace.c:1080 */
BPF_CALL_1(bpf_get_func_ip_kprobe_multi, struct pt_regs *, regs)
{
return bpf_kprobe_multi_entry_ip(current->bpf_ctx);
}
It just reads the entry IP that the handler already stashed in current->bpf_ctx. The selection happens in the verifier when it sees is_kprobe_multi(prog):
/* kernel/trace/bpf_trace.c:1327 */
case BPF_FUNC_get_func_ip:
if (is_kprobe_multi(prog))
return &bpf_get_func_ip_proto_kprobe_multi;
That’s why the helper is cheap: it’s a context read, not a symbol lookup at runtime. The expensive part (resolving the address) happened once, in the handler.
You typically use the returned IP as a key in a hash map: IP → count, or IP → behavior. Strip out bpf_get_func_ip (Break 3) and every one of the N probes increments the same counter, because nothing else in the program distinguishes them — attribution is gone.
One link owns all N attachments
Day 1 introduced bpf_link (BPF_LINK_CREATE wires a program to an attach point); Day 10 showed that a probe lives until you close the link’s FD. Nothing new to teach there — just one new point worth a sentence.
The same single link object covers all N functions:
/* kernel/trace/bpf_trace.c:2291 */
struct bpf_kprobe_multi_link {
struct bpf_link link;
struct fprobe fp; /* the one fprobe covering all N */
unsigned long *addrs; /* the N resolved addresses */
u64 *cookies;
u32 cnt; /* N */
...
};
/* kernel/trace/bpf_trace.c:2828 */
bpf_link_init(&link->link, BPF_LINK_TYPE_KPROBE_MULTI, ...);
One struct bpf_kprobe_multi_link, holding one struct fprobe, the addrs/cookies arrays, and the count. Closing its one FD detaches all N — versus the N separate links the one-by-one loop creates. That’s the whole “detach is one operation” claim, made concrete.
What the VFS layer is (and why vfs_* is the right glob)
The lab globs vfs_*. Day 6 first used vfs_read as an example target and Day 7 reused it, but no chapter has said what the VFS is — and you shouldn’t have to take “glob vfs_* to catch all filesystem activity” on faith.
The Virtual File System is the kernel’s filesystem-agnostic layer. Every read(), write(), open(), close() syscall funnels through a vfs_* entry point — vfs_read (fs/read_write.c:554), vfs_write (fs/read_write.c:668), vfs_open (fs/open.c:1074), and friends — before the kernel dispatches to the concrete filesystem driver (ext4, xfs, btrfs, …) that actually backs the file. The VFS is the common chokepoint; the concrete FS is what sits below it.
That single fact is why hooking vfs_* with one glob is the right aggregation point: it captures all filesystem activity in one place, no matter which filesystem each file lives on. You don’t need VFS internals beyond this — the companion linux-net book and general kernel background go deeper; here you only need to know vfs_* are the shared filesystem entry points.
There are no Dumb Questions
Q: Is multi-kprobe just syntactic sugar over a loop?
A: Functionally similar; operationally very different. The kernel-side install path is shared (one fprobe registered via ftrace against a list of addresses), the BPF link is a single object, and there’s no
int3trap at runtime. For 1000 functions, multi-kprobe attaches in ~10 ms; the loop version takes seconds.Q: Can I use multi-probe with a wildcard pattern?
A: Yes. libbpf supports glob patterns in
attach_kprobe_multi_opts.syms.tcp_*matches every TCP function. Internally libbpf reads tracefsavailable_filter_functions_addrs(oravailable_filter_functionsplus/proc/kallsymson older kernels) and resolves the glob to addresses in userspace, then hands the kernel a ready-made address array — the kernel justcopy_from_users it and registers the fprobe. (The in-kernel name→address resolution only runs when you pass an explicitsyms[]list instead of a glob.)Q: Does multi-probe exist for fentry?
A: No — there’s no
fentry.multi/fexit.multi. fentry/fexit build one trampoline per attach target, with no batched multi-attach variant in libbpf or the kernel. If you need to hook many functions at once with low per-call overhead, usekprobe.multi(which is fprobe-backed and very cheap) and read the return value via the kprobe ctx.Q: Multi-uprobe?
A: Yes — added in 6.6.
SEC("uprobe.multi/..."). Same idea for userspace targets.
The lab
multi.bpf.c
This listing is included from the file the lab build and CI compile:
#include “vmlinux.h” #include <bpf/bpf_helpers.h> #include <bpf/bpf_tracing.h>
char LICENSE[] SEC(“license”) = “GPL”;
struct { __uint(type, BPF_MAP_TYPE_HASH); __uint(max_entries, 4096); __type(key, __u64); /* function ip / __type(value, __u64); / count */ } hits SEC(“.maps”);
SEC(“kprobe.multi/vfs_*”) int BPF_KPROBE(on_any_vfs) { __u64 ip = bpf_get_func_ip(ctx); __u64 *c = bpf_map_lookup_elem(&hits, &ip); if (c) { __sync_fetch_and_add(c, 1); } else { __u64 one = 1; bpf_map_update_elem(&hits, &ip, &one, BPF_NOEXIST); } return 0; }
SEC("kprobe.multi/vfs_*") — the suffix after kprobe.multi/ is a glob. libbpf expands it (via tracefs available_filter_functions, as we saw) into maybe 50 function names starting with vfs_, the kernel resolves those to addresses, and bpf_get_func_ip(ctx) returns the entry IP of whichever one fired — the key the hash map aggregates on.
multi.c — userspace
struct multi_bpf *skel = multi_bpf__open_and_load();
multi_bpf__attach(skel);
while (!exiting) {
sleep(2);
/* iterate hits map; resolve ip via /proc/kallsyms */
int fd = bpf_map__fd(skel->maps.hits);
__u64 key = 0, next, val;
while (bpf_map_get_next_key(fd, &key, &next) == 0) {
bpf_map_lookup_elem(fd, &next, &val);
printf("%-30s %llu\n", lookup_ksym(next), val);
key = next;
}
}
lookup_ksym(addr) is a sketch, not supplied code — it’s a few-line function you write that scans /proc/kallsyms for the closest symbol at or below addr: parse each addr type name line, keep the entry with the largest address <= addr. (This is exactly the nearest-preceding-symbol scan Day 9 taught — and note it reads /proc/kallsyms, the symbolization file, not the available_filter_functions file the glob used.) Without it the program won’t link. To skip writing a symbolizer, print the raw IP with %llx instead and pipe each value through grep <hex> /proc/kallsyms by hand. Note /proc/kallsyms only exposes real addresses to root (kptr_restrict zeroes them otherwise), so run the binary with sudo.
Run
Prerequisite:
kprobe.multiis fprobe-backed, so the kernel must be built withCONFIG_FPROBE=y(kernel >= 5.18), plusCONFIG_DEBUG_INFO_BTF=yfor thevmlinux.hinclude. Check withgrep -E 'CONFIG_FPROBE|CONFIG_DEBUG_INFO_BTF' /boot/config-$(uname -r)(orzgrepon/proc/config.gz). WithoutCONFIG_FPROBEthe attach fails outright —bpf_kprobe_multi_link_attachis the-EOPNOTSUPPstub we saw above.
make
sudo ./multi &
# Generate work in another terminal:
find /etc -type f | xargs cat > /dev/null
Expected (assuming you wrote the lookup_ksym sketch above — otherwise the left column is raw hex IPs):
vfs_read 12453
vfs_open 2914
vfs_statx 1822
vfs_getattr_nosec 2914
...
Row order is arbitrary: the userspace loop walks the map with bpf_map_get_next_key, which returns keys in hash order, not ranked by count — so your rows may appear shuffled (the counts above aren’t sorted either). Only the per-function counts matter; pipe through sort -k2 -rn if you want them ranked.
You attached to ~50 functions in one syscall, watched all of them, and aggregated by function — without writing 50 separate handlers.
Same lesson as a one-liner
If you’d rather not assemble the C glue (in particular the lookup_ksym symbolizer), bpftrace gives you the whole lesson in one copy-pasteable program. The vfs_* glob is expanded and attached via kprobe.multi — the same path as SEC("kprobe.multi/vfs_*") in multi.bpf.c — and the func builtin plays the role of bpf_get_func_ip, telling you which of the vfs_* functions fired:
# Terminal 1 — one program, many functions, attributed by func():
sudo bpftrace -e 'kprobe:vfs_* { @[func] = count(); } interval:s:5 { exit(); }'
# Terminal 2 — generate VFS load:
find /etc -type f | xargs cat > /dev/null
Expected (counts vary run to run; the highest-traffic VFS paths dominate, and bpftrace prints @-maps sorted ascending by value):
Attached 78 probes
@[vfs_write]: 524
@[vfs_fstatat]: 1744
@[vfs_statx]: 2823
@[vfs_open]: 4719
@[vfs_fstat]: 4897
@[vfs_getattr_nosec]: 7742
@[vfs_read]: 20960
bpftrace resolves the names directly via func, so this version sidesteps the lookup_ksym glue entirely.
What to break, in order
Break 1 — Specific list instead of glob
SEC("kprobe.multi")
int BPF_KPROBE(p) { ... }
In userspace:
LIBBPF_OPTS(bpf_kprobe_multi_opts, opts);
const char *syms[] = {"vfs_read", "vfs_write", "vfs_open"};
opts.syms = syms;
opts.cnt = 3;
bpf_program__attach_kprobe_multi_opts(skel->progs.p, NULL, &opts);
This gives you precise control over which functions to attach. Use when a glob would over-match. (libbpf still feeds these names through copy_user_syms → sort_r → ftrace_lookup_symbols on the kernel side — the same resolution path, you’ve just skipped the glob expansion.)
Break 2 — Mixing offsets
const __u64 addrs[] = {0xffffffff812a4000, ...};
opts.addrs = addrs; /* numeric addresses */
opts.cnt = N;
You can pass raw kernel addresses too. Useful when symbols are aliased or you have addresses from another source (perf, kallsyms parsed yourself). With opts.addrs the kernel skips name resolution entirely — it just copy_from_user(addrs, uaddrs) into the link’s array and goes straight to register_fprobe_ips. No ftrace_lookup_symbols step.
Break 3 — Forget bpf_get_func_ip
Without it, every probe just increments the same counter — you lose per-function attribution. Run, then realize you can’t tell which vfs_* was called. The reason is exactly what the dispatch section showed: the ctx (pt_regs) is identical in shape across all N targets, so the entry IP is the only thing distinguishing one invocation from another. Lesson: always identify the source when one program serves many probes.
Break 4 — Multi-probe on a function that doesn’t exist
SEC("kprobe.multi/this_function_does_not_exist*")
Glob expands to zero matches. libbpf fails attach with -ENOENT (the kernel side would reject cnt == 0 with -EINVAL; libbpf surfaces the empty resolution as -ENOENT). Friendly: silent acceptance with zero matches would mask bugs.
What to read in the kernel
kernel/trace/bpf_trace.c— searchbpf_kprobe_multi_link_attach. The function that handles the new link type.kernel/bpf/syscall.c— searchBPF_TRACE_KPROBE_MULTI. The syscall dispatch.tools/lib/bpf/libbpf.c— searchbpf_program__attach_kprobe_multi_opts. The userspace API.tools/testing/selftests/bpf/progs/kprobe_multi.c— official test/examples.
Bullet Points
- Multi-probe attaches one BPF program to many functions in a single syscall (~10ms for 1000 vs seconds for one-by-one).
- It’s fprobe-backed: one
struct fproberegistered via ftrace against a sortedaddr[]array (register_fprobe_ips). fprobe is ftrace-based like fentry — so noint3trap — but it’sftrace_ops/fgraph, not a per-function BPF trampoline. Cheap to install (one ftrace op, not N text-pokes) and cheap at runtime (no trap). Capped atMAX_KPROBE_MULTI_CNT = 1<<20;CONFIG_FPROBE=yrequired or attach returns-EOPNOTSUPP. - Glob → addresses, resolved in userspace. For a glob, libbpf does both the expansion and the name→address resolution: it reads tracefs
available_filter_functions_addrs(oravailable_filter_functions+/proc/kallsymson older kernels), produces an address array, and the kernel justcopy_from_users it and registers the fprobe — no in-kernel name resolution. Thesort_rnames +ftrace_lookup_symbolssingle O(N) pass over kallsyms (bsearch into the sorted input) runs only for an explicitsyms[]list or an exact wildcard-free name. SEC("kprobe.multi/glob")for glob attach; or pass an explicit list viabpf_kprobe_multi_opts.syms, or raw addresses via.addrs(which skips name resolution).bpf_get_func_ip(ctx)lets the program know which function fired. It’s a per-program-type helper (bpf_get_func_ip_kprobe_multi) that just reads the entry IP the handler stashed incurrent->bpf_ctx— cheap, no runtime symbol lookup. The IP is the only discriminator; without it, all N probes increment one counter.- One
bpf_link(struct bpf_kprobe_multi_link, holding onefpand theaddrs/cookies/cnt) owns all N attachments; closing its FD detaches all N. - The VFS is the kernel’s filesystem-agnostic layer; every read/write/open/close syscall funnels through a
vfs_*entry before dispatching to the concrete FS — which is whyvfs_*is the right one-glob aggregation point. - Variants:
kprobe.multi,kretprobe.multi,uprobe.multi(6.6+). There is nofentry.multi/fexit.multi.
Check question
You attach kprobe.multi/tcp_* and observe bpf_get_func_ip returning some IPs that don’t match what cat /proc/kallsyms | grep tcp_ shows. What might cause this?
Click to reveal answer
Answer: bpf_get_func_ip returns the resolved function entry address — the handler ran ftrace_get_entry_ip(fentry_ip) (which is ftrace_get_symaddr(fentry_ip) ?: fentry_ip) and stashed it in current->bpf_ctx, and the helper just reads it back. That entry address is exactly what you’d compare against a symbol start in /proc/kallsyms — but: (a) KASLR can shift symbols across boots, so resolve at the same boot you traced in. (b) Some functions have aliases — multiple symbols at the same IP — so the IP may match a different name than you grepped for. (c) On older kernels bpf_get_func_ip returned the trampoline call site, off by a few bytes from the symbol. Use bpf_get_func_ip consistently for all comparisons rather than mixing it with kallsyms-derived addresses.
Tomorrow
Day 12: sleepable BPF programs. The constraint that’s been quietly limiting you (no helpers that fault) and how to relax it.
Day 12 — Sleepable BPF: programs that can fault
Today’s mission: trace
openatand read the path string from userspace memory — something a normal BPF program literally cannot do. Along the way, learn what a page fault actually is (demand paging, minor vs major faults), what it means for kernel code to “sleep,” which contexts forbid sleeping and which allow it, and the real synchronization mechanism that protects sleepable programs (it is not SRCU — the kernel changed, and a lot of docs are stale). Total time: ~100 minutes.
The constraint you’ve been living under
Every BPF program you’ve written so far runs in atomic context. The kernel can’t schedule the CPU away mid-execution; the BPF program must run start-to-finish without yielding. This is what makes BPF so cheap (no context switches, no scheduling) and what gates all the other guarantees.
You met the consequences of that on earlier days without us naming the cause. On Day 2 the hash map’s bucket lock had to be a raw spinlock specifically “because BPF programs run in atomic contexts where you cannot take a sleeping lock.” On Day 5 the Verifier insisted your program terminate in bounded time because it runs where preemption and IRQs may be off. Today we finally turn that constraint over and look underneath it — and then we lift it.
A direct consequence of atomic context: any helper that might page-fault is forbidden. Hitting an unmapped userspace page would require resolving the fault — which can require scheduling the thread away, which atomic context can’t do.
Helpers in the forbidden list: bpf_copy_from_user (and its task variant bpf_copy_from_user_task). Before sleepable BPF existed, the answer was “you can’t do that from BPF.”
Sleepable BPF programs lift the restriction.
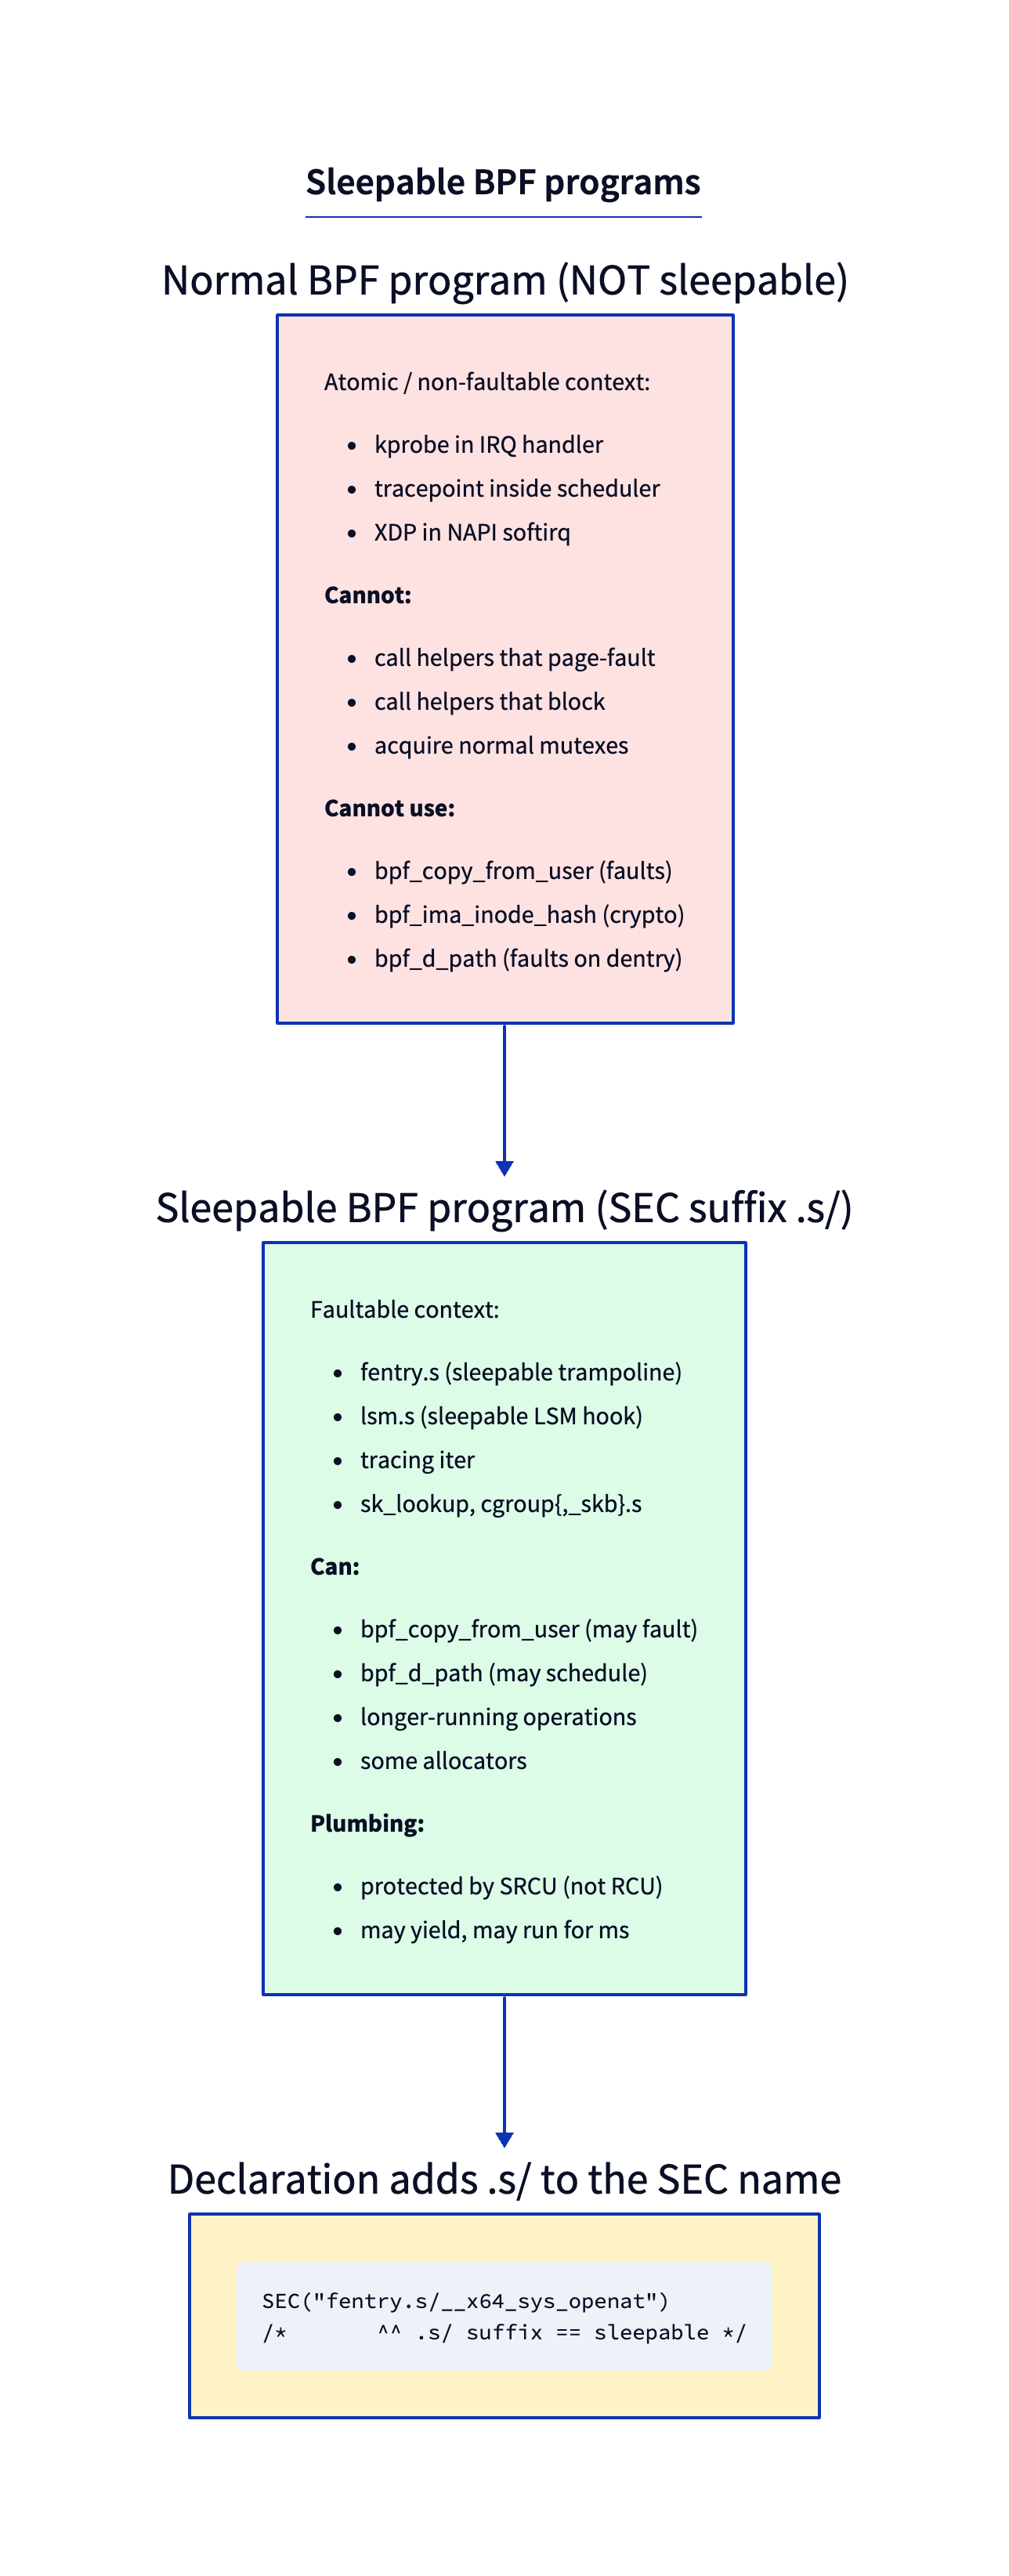
First, what does “sleep” even mean in the kernel?
The word “sleep” is doing a lot of load-bearing work today, and it does not mean “wait for a timer” or “delay.” In kernel terms, to sleep is to voluntarily block: the current thread is put on a wait queue, the scheduler picks some other runnable task and switches to it, and the original thread resumes later when whatever it was waiting for is ready. The CPU is not spinning — it goes and does useful work for someone else in the meantime.
The kernel even has a built-in annotation for “this function may block”:
/* include/linux/kernel.h:79 — might_sleep() is an annotation, not an action */
/* might_sleep - annotation for functions that can sleep */
# define might_sleep() \
do { __might_sleep(__FILE__, __LINE__); might_resched(); } while (0)
might_sleep() (include/linux/kernel.h:90, with __might_sleep declared at :74) is a debugging tripwire: drop it into a function, and if that function is ever called from a context where sleeping is illegal, the kernel screams. Hold that thought — we’ll see the sleepable BPF trampoline call its faulting cousin might_fault() in a minute.
Faultable vs non-faultable contexts
So why can’t every kernel code path sleep? Because in some contexts there is no task to safely block, and blocking would deadlock or stall the CPU:
- Interrupt handlers and softirqs. A softirq — the deferred-interrupt context where packet-processing program types like XDP run — is not a schedulable entity. There’s no “thread” the scheduler can park and resume — so it cannot sleep. This is exactly why XDP can never be made sleepable.
- Code holding a spinlock, or with preemption explicitly disabled. Sleeping here would either deadlock (another CPU spinning forever on the lock you’re holding) or strand the CPU.
These are non-faultable / atomic contexts. Everything you’ve attached to so far — kprobes, XDP, tc, raw tracepoints — lives here.
- Ordinary process/thread context with preemption allowed is faultable. Syscall entry, most LSM hooks (Linux Security Module callbacks), BPF iterators. Here the current thread is a real schedulable task: it can be descheduled and resumed. So a major fault — or any helper that might sleep — is safe.
That last set is precisely the set of attach points that can be made sleepable. Keep the picture simple: sleepable-eligible = faultable = “there’s a real thread here we can safely put to sleep and wake up later.”
One subtlety worth a single sentence: even a sleepable BPF program runs under
migrate_disable(), not full preemption — so it may sleep, but it stays pinned to the CPU it started on (so per-CPU map access stays correct). You’ll see that in the trampoline code below.
What “sleepable” actually means
The program is allowed to be in contexts where the kernel can schedule the current thread away. That means:
- It runs from a faultable code path (typically a syscall entry, an LSM hook, or an iterator).
- It can call helpers that may page-fault.
- It can take longer (microseconds — or, on a real fault, milliseconds — rather than nanoseconds) without breaking timing assumptions.
- It’s protected by a different RCU variant — RCU Tasks Trace — that allows readers to sleep. (Older write-ups call it SRCU. That’s wrong for modern kernels; we fix it properly below.)
You opt in with the .s/ suffix on the SEC name:
SEC("fentry.s/__x64_sys_openat") /* sleepable fentry */
SEC("lsm.s/file_open") /* sleepable LSM hook */
SEC("iter.s/task") /* sleepable iterator */
The Verifier tracks per-program sleepability. A sleepable program gets access to the wider helper set; a non-sleepable program calling a sleepable-only helper is rejected.
What a page fault actually IS
Before we can talk about why bpf_copy_from_user might sleep, you need to know what a page fault is and why a perfectly valid pointer can point at memory that isn’t there. This is the concept the whole chapter rests on, so we’ll build it from the ground up.
Demand paging: a valid pointer with no physical page behind it
When a process allocates memory — malloc, a growing stack, a freshly mmap’d region — the kernel records a VMA (virtual memory area): “addresses X through Y are legally yours.” But it does not immediately go find physical RAM to back every one of those addresses. That would be wasteful — most programs touch only a fraction of what they reserve. Instead the kernel waits until the program actually touches an address, and only then finds a physical page for it. This laziness is called demand paging.
The consequence is the thing that surprises everyone the first time: a pointer can be valid — it lands inside a mapped VMA, the kernel agrees you’re allowed to read it — and yet have no resident physical page behind it right now. “Valid address” and “address backed by RAM” are two different questions.
How does the hardware tell the difference? Through the page table. The CPU’s MMU translates every virtual address to a physical one by walking page-table entries (PTEs). If the PTE for an address says “not present,” the MMU can’t complete the translation and raises a page fault — a CPU trap into the kernel’s fault handler.
The handler’s decision, and minor vs major faults
The fault handler’s first job is to decide: is this a legal access into a real VMA, or a bug?
- Illegal (the address isn’t in any VMA — a wild pointer): deliver SIGSEGV. This is the segfault you know.
- Legal (inside a VMA, just not yet backed): fix it up — allocate a page, zero-fill it, copy-on-write it, or read it back from disk/swap — then install the PTE and let the faulting instruction re-run as if nothing happened.
When the access is legal, there are two very different costs, and the distinction is the entire reason sleepable BPF exists:
- Minor fault — the data is already in RAM; the kernel just needs to install a PTE pointing at it. This happens for a shared page, the shared zero page, or a page-cache hit (the file’s bytes are already cached). Fast, and the thread never blocks.
- Major fault — the page must be fetched from disk or swap. That’s I/O, which takes essentially forever in CPU terms. The faulting thread is descheduled (put to sleep) until the I/O completes, then woken and resumed. This is the case that requires a sleepable context.
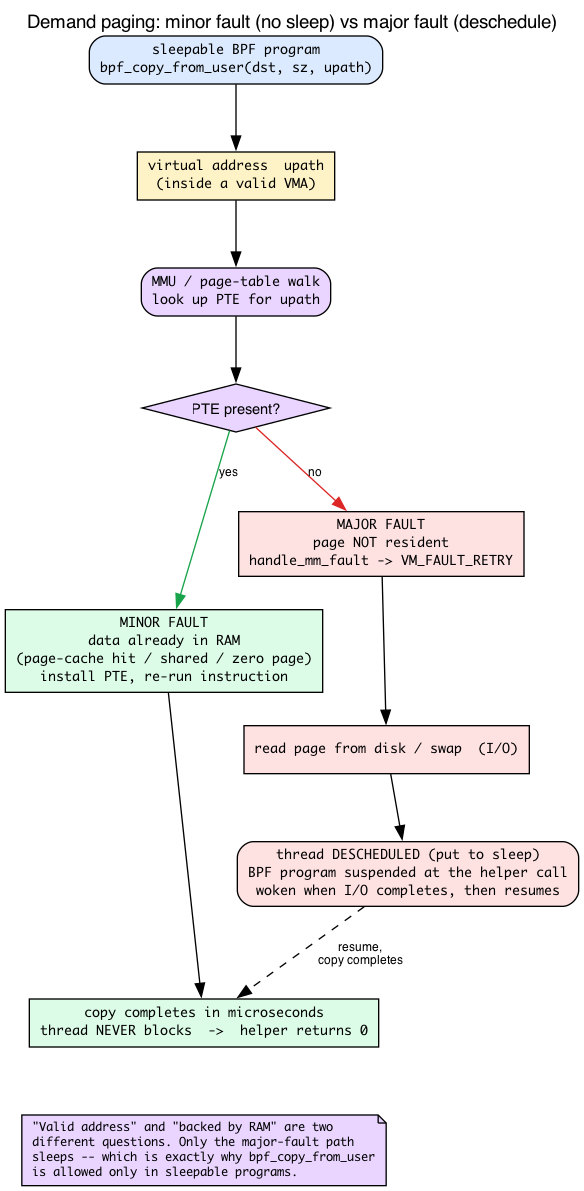
On x86, the userspace fault entry is do_user_addr_fault (arch/x86/mm/fault.c:1207). Read two lines in it and the minor/major split jumps out: if (fault & VM_FAULT_MAJOR) (fault.c:1343) is the disk/swap branch, and if (unlikely(fault & VM_FAULT_RETRY)) (fault.c:1408) is the “we had to drop the mmap lock and may block” branch. Both route through the core resolver handle_mm_fault (mm/memory.c:6699). VM_FAULT_RETRY — the “we had to drop the lock and may block” signal — is returned by deeper fault helpers such as vmf_can_call_fault (mm/memory.c:3800) and __vmf_anon_prepare (mm/memory.c:3827) and propagated out through handle_mm_fault.
Tying it to the helper
Here’s why this matters for us. bpf_copy_from_user is, underneath, an ordinary copy_from_user:
/* kernel/bpf/helpers.c:659 — bpf_copy_from_user body */
int ret = copy_from_user(dst, user_ptr, size);
if (unlikely(ret)) {
memset(dst, 0, size); /* on failure, zero the dst... */
ret = -EFAULT; /* ...and report EFAULT */
}
copy_from_user touches the user address — and if the page isn’t present, it goes through the exact do_user_addr_fault → handle_mm_fault machinery above. If that’s a minor fault, the copy completes in microseconds and nobody sleeps. If it’s a major fault, the thread blocks until the page is read in. A non-sleepable program cannot be allowed anywhere near that second path, which is why the helper is gated. The helper even advertises the risk to the Verifier:
/* kernel/bpf/helpers.c:675 — the per-helper flag the Verifier checks */
.might_sleep = true,
Why a sleepable program is safe to detach: RCU Tasks Trace (not SRCU)
There’s one more piece. If a sleepable BPF program can sit suspended in the middle of a major fault for milliseconds, how does the kernel safely free that program when you detach it? It must guarantee no invocation is still in flight before it reclaims the program’s memory — otherwise it’d be freeing code that’s mid-execution.
You already know the shape of this answer from Day 2’s RCU section: readers run inside a read-side critical section, writers wait for a grace period (until all in-flight readers finish), and freeing is deferred so memory can’t vanish under a reader. That’s the same idea here — only the flavor of RCU is different, because classic RCU readers are not allowed to sleep (a sleeping reader would pin the grace period forever and starve writers). A sleepable BPF program obviously can sleep, so classic RCU won’t do.
The variant designed for exactly this is RCU Tasks Trace (a.k.a. tasks-trace RCU). Its read-side critical sections may block, and its writer-side grace period waits until every CPU has passed through a point where no tasks-trace reader is active.
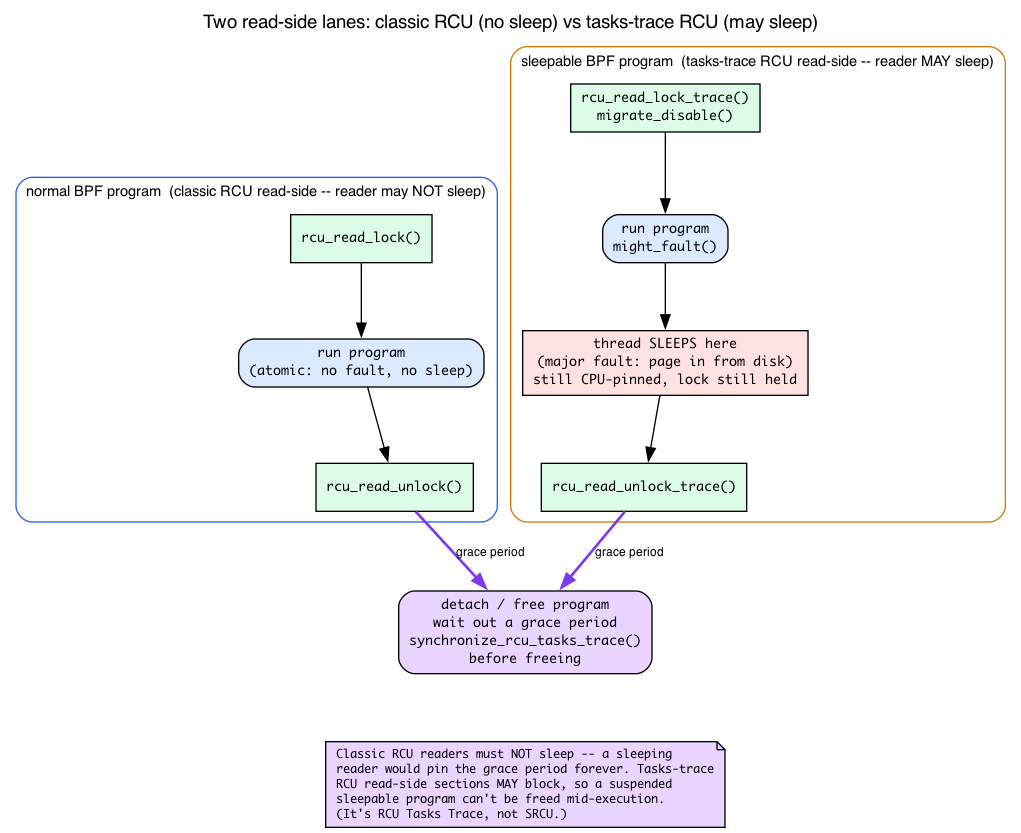
You can see it in the trampoline. The wrapper that runs a sleepable program does not take an SRCU lock — it takes the tasks-trace read lock and disables migration (so it stays CPU-pinned even while it can fault):
/* kernel/bpf/trampoline.c:1250 — __bpf_prog_enter_sleepable() */
rcu_read_lock_trace();
migrate_disable();
might_fault(); /* "I might take a fault / sleep here" */
The recursion-aware pair __bpf_prog_enter_sleepable_recur / __bpf_prog_exit_sleepable_recur (trampoline.c:1221–:1247) bracket the program with rcu_read_lock_trace() / rcu_read_unlock_trace() the same way. And the kernel spells out the contrast in a comment — sleepable uses trace RCU, normal uses classic RCU:
/* kernel/bpf/trampoline.c:518 */
/* rcu_read_lock_trace to protect sleepable bpf progs
* rcu_read_lock to protect normal bpf progs
*/
On detach, the kernel waits out a tasks-trace grace period before freeing — synchronize_rcu_tasks_trace() is the call, named explicitly in the syscall-side comment (kernel/bpf/syscall.c:157: “For sleepable BPF programs, synchronize_rcu_tasks_trace() should be used to wait for the completions of these programs”), with the fentry trampoline image freed after a tasks-trace grace period via call_rcu_tasks_trace (kernel/bpf/trampoline.c:562), which then chains call_rcu_tasks to drain the trampoline asm and normal progs. So the intuition you’d expect — “wait for a grace period before freeing so no in-flight invocation is mid-execution” — is exactly right. Only the RCU flavor name matters: it’s RCU Tasks Trace, not SRCU.
There are no Dumb Questions
Q: Why isn’t every BPF program sleepable by default?
A: Cost and reach. Non-sleepable programs use cheap classic RCU (~ns to enter/exit) and can attach to any context including IRQ handlers and softirqs. Sleepable programs use RCU Tasks Trace (more cost) and can only attach to faultable contexts (essentially syscall entries, LSM hooks, certain trampolines). Most tracers don’t need to fault, so non-sleepable is the right default.
Q: Can I make my XDP program sleepable?
A: No. XDP runs in softirq context — a non-faultable context by design (a softirq isn’t a schedulable thread, so there’s nothing to put to sleep). There’s no
SEC("xdp.s/..."). If you need to do something faulting in response to a packet, send the metadata to userspace and do the work there.Q: My fentry program needs to read a userspace string. Without sleepable, what are my options?
A: Use
bpf_probe_read_user_strinstead — it doesn’t fault on missing pages, it just returns-EFAULT. You get the data when the page happens to be in memory, and silently miss when not. For most observability use cases that’s acceptable. For correctness-critical reads, use sleepable.
The lab
openat_path.bpf.c
The producer and consumer share the event layout through one header:
#ifndef PRACTICAL_EBPF_OPENAT_PATH_H #define PRACTICAL_EBPF_OPENAT_PATH_H
struct event { unsigned int pid; char comm[16]; char path[256]; };
#endif
and the sleepable program is included from the source the lab build and CI
compile (__user is defined away for the BPF target — it is a sparse
annotation vmlinux.h does not carry):
#include “vmlinux.h” #include <bpf/bpf_helpers.h> #include <bpf/bpf_tracing.h> #include <bpf/bpf_core_read.h>
#include “openat_path.h”
/* vmlinux.h does not carry the __user sparse annotation. Define it away so
- the syscall-argument pointer keeps its documentary __user tag and still
- compiles under -target bpf. */ #ifndef __user #define __user #endif
char LICENSE[] SEC(“license”) = “GPL”;
struct { __uint(type, BPF_MAP_TYPE_RINGBUF); __uint(max_entries, 256 * 1024); } rb SEC(“.maps”);
/* Sleepable fentry — the ‘.s/’ suffix gives access to bpf_copy_from_user. */ SEC(“fentry.s/__x64_sys_openat”) int BPF_PROG(on_openat, struct pt_regs *regs) { struct event *e; const char __user *upath; long ret;
/* The syscall wrapper passes pt_regs; PARM2 is the path string. */
upath = (const char __user *)PT_REGS_PARM2_CORE_SYSCALL(regs);
if (!upath)
return 0;
e = bpf_ringbuf_reserve(&rb, sizeof(*e), 0);
if (!e)
return 0;
e->pid = bpf_get_current_pid_tgid() >> 32;
bpf_get_current_comm(&e->comm, sizeof(e->comm));
/* This is the magic — only allowed in sleepable programs: */
ret = bpf_copy_from_user(e->path, sizeof(e->path) - 1, upath);
if (ret < 0)
e->path[0] = 0; /* couldn't read; emit empty */
bpf_ringbuf_submit(e, 0);
return 0;
}
Why the syscall hook takes a single struct pt_regs *
There’s a snag worth pausing on. On Day 7 you learned that an fentry program on an ordinary kernel function gets the function’s arguments as typed kernel objects — BPF_PROG(on_x, struct file *f, int flags) just works, because the BTF signature says so. You also met pt_regs there as a saved register snapshot (for kprobes), and saw that each program type has its own ctx layout. So why, for __x64_sys_openat, are we suddenly back to a raw struct pt_regs * and a PARM2 macro instead of typed args?
Because a modern x86-64 syscall doesn’t have the signature you’d expect. SYSCALL_DEFINE4(openat, ...) (confirmed at fs/open.c:1381, where the 2nd logical arg filename is indeed const char __user *) expands into a thin wrapper:
long __x64_sys_openat(const struct pt_regs *regs);
The wrapper’s job is to pull the individual syscall arguments out of the saved register frame and hand them to the real worker (__do_sys_openat). So at the fentry attach point, __x64_sys_openat’s BTF signature genuinely has exactly one argument: a struct pt_regs * — not the four logical openat args. You can’t write BPF_PROG(on_openat, int dfd, const char *path, ...); the type information simply isn’t there. You take regs and decode it yourself.
PT_REGS_PARM2_CORE_SYSCALL(regs) is the accessor for “the 2nd syscall argument” under this wrapper convention. The _CORE_ variant is CO-RE-aware — it reads the right register field through BPF_CORE_READ, so it relocates correctly across kernels and arches (tools/lib/bpf/bpf_tracing.h:545; the plain PT_REGS_PARM2_SYSCALL at :544 is a direct field read). openat(dfd, path, flags, mode) → PARM2 is path. On other arches the wrapper prefix changes (__arm64_sys_openat), which is exactly why you want the CO-RE form.
Back to the program — what’s new
SEC("fentry.s/__x64_sys_openat")— the.s/makes it sleepable.__x64_sys_openatis the kernel’s system-call entry on x86-64. As just explained, it receives a singlestruct pt_regs *(the wrapper unpacks the logical args from the trap frame). On other arches the prefix differs (__arm64_sys_openat).PT_REGS_PARM2_CORE_SYSCALL(regs)— the CO-RE-aware macro that reads the second syscall argument across architectures. The path string is the second argument toopenat(dirfd, path, flags, mode)(after dirfd).bpf_copy_from_user— the helper that may fault. Returns 0 on success, negative errno on failure. Only callable from sleepable programs — try it from a non-sleepable program and the Verifier rejects withsleepable helper bpf_copy_from_user#148 in <context>, where<context>names the non-sleepable context it found. (Func id 148 is fixed in the UAPI:FN(copy_from_user, 148, ...)atinclude/uapi/linux/bpf.h:6053.)
openat_path.c — userspace
Reuses the exact ringbuf consumer skeleton from Day 01 (the handle callback plus the ring_buffer__poll loop in main). Only the print line changes — it pulls pid, comm, and path off the event so the output matches the Run section below:
static int handle(void *ctx, void *data, size_t sz) {
struct event *e = data;
printf("PID %u (%s) opened %s\n", e->pid, e->comm, e->path);
return 0;
}
Run
make
sudo ./openat_path &
# In another terminal:
ls /etc
cat /etc/passwd
Expected:
PID 4001 (ls) opened /etc
PID 4002 (cat) opened /etc/passwd
You read userspace memory from the kernel, possibly faulting if the page wasn’t resident, all without crashing.
One honest caveat: on a normal box the path string the caller just constructed is already page-resident (the syscall’s caller literally just wrote those bytes — a guaranteed minor fault at worst, usually no fault), so every bpf_copy_from_user returns 0 and no sleep is actually taken here. What sleepability buys you is the guarantee that if the page were missing — the major-fault case from the demand-paging section — the helper would safely sleep and page it in, whereas a non-sleepable program could not call the helper at all. To actually witness the fault path you would have to evict the page (e.g. madvise(MADV_DONTNEED) on the buffer) before the syscall. Printing ret from the consumer makes success-vs--EFAULT visible if you want to confirm.
What to break, in order
Break 1 — Drop the .s/ suffix
SEC("fentry/__x64_sys_openat")
Verifier rejects:
sleepable helper bpf_copy_from_user#148 in <context>
(<context> is filled in with the non-sleepable context the Verifier found — e.g., the program type or attach point.) This is the exact verbose(env, "sleepable helper %s#%d in %s\n", ...) string at kernel/bpf/verifier.c:10331, emitted from the if (fn->might_sleep && !in_sleepable_context(env)) check at :10330. Lesson: .s/ is what unlocks the sleepable helpers. Without it, the call is forbidden at verification time.
Break 2 — Try bpf_copy_from_user in an XDP program
SEC("xdp")
int xdp_prog(struct xdp_md *ctx) {
char buf[16];
bpf_copy_from_user(buf, sizeof(buf), (void *)0x12345678);
return XDP_PASS;
}
Same rejection — helper not allowed. XDP can’t be made sleepable; it runs in softirq context, which (as we established) isn’t a schedulable thread and so is fundamentally non-faultable.
Break 3 — Emit large amounts to ringbuf
A sleepable fentry on __x64_sys_openat fires on every open(). On a busy system that’s thousands per second. Run on a heavy workload (find /usr | xargs cat > /dev/null) and the consumer can’t keep up — some records get dropped.
But you can’t see those drops with the obvious command. A ringbuf is a stream, not a key/value store — it has no iteration and no built-in per-map drop counter — so bpftool map dump simply can’t dump it:
sudo bpftool map dump name rb
It prints a useless Found 0 elements line and exits non-zero (exit 244 on bpftool v7.7.0; some builds instead produce no output at all — either way you learn nothing about drops). Real drop visibility needs an explicit counter you add yourself: a __u64 in a separate BPF_MAP_TYPE_ARRAY, incremented whenever bpf_ringbuf_reserve() returns NULL, then read with bpftool map dump name <counter_map>. You build exactly that in Day 13.
Break 4 — Use bpf_probe_read_user_str instead
bpf_probe_read_user_str(e->path, sizeof(e->path), upath);
This works in non-sleepable programs too. It doesn’t fault — it returns -EFAULT if the page isn’t resident. For tracing, the silent miss is usually acceptable; you trade a few dropped events for not needing sleepable.
When do you actually need sleepable? When dropping the event isn’t acceptable (security policy, audit logs), or when you need a helper that only exists in sleepable form (bpf_copy_from_user, bpf_copy_from_user_task).
A helper worth distinguishing from these: bpf_d_path (resolves a struct path to a string). It is not sleepable-only — its proto carries no .might_sleep flag. Instead it’s gated purely by a BTF allowlist: the .allowed callback (bpf_d_path_allowed in kernel/trace/bpf_trace.c:947, wired at bpf_d_path_proto’s .allowed field, :970) only permits it when you’re attached to one of a fixed set of functions (security_file_open, vfs_getattr, filp_close, dentry_open, …, in the btf_allowlist_d_path set), or from a BPF iterator. So if bpf_d_path is rejected, the fix isn’t .s/ — it’s attaching to an allowlisted function.
Contrast this with bpf_ima_inode_hash / bpf_ima_file_hash, which are gated by both mechanisms at once: their protos carry .might_sleep = true (kernel/bpf/bpf_lsm.c:181 and :200) and a .allowed allowlist callback (bpf_ima_inode_hash_allowed, :187). So they require a sleepable program (rejected by the same .might_sleep gate that rejects bpf_copy_from_user) and an allowlisted attach target. Only bpf_d_path is the clean “allowlist-but-not-sleepable” example.
What to read in the kernel
kernel/bpf/trampoline.c— search__bpf_prog_enter_sleepable(:1250). The wrapper that takes the tasks-trace RCU read-side lock (rcu_read_lock_trace()),migrate_disable()s, and callsmight_fault()around a sleepable program invocation. The comment at:518lays out trace-RCU-vs-classic-RCU explicitly.kernel/bpf/verifier.c— searchin_sleepable_context(:10253). How the Verifier decides which helpers a program may call; the.might_sleepgate is at:10330.kernel/bpf/helpers.c—bpf_copy_from_userbody (:659) and its.might_sleep = trueproto flag (:675).Documentation/RCU/Design/Requirements/Requirements.rstplus the Tasks RCU material — the relevant design notes are the Tasks-Trace RCU sections (the load-bearing code is__bpf_prog_enter_sleepableintrampoline.c). Ignore older “SRCU protects sleepable BPF” claims; that’s stale.tools/testing/selftests/bpf/progs/lsm.c— sleepable LSM example (seeSEC("lsm.s/bprm_committed_creds")at:111).include/linux/bpf.h— searchstruct bpf_progand find thesleepable:1flag bit (:1794).
Bullet Points
- A page fault is a CPU trap taken when the MMU finds a “not present” PTE. Userspace memory is demand-paged: a pointer can be valid (inside a VMA) yet have no resident page. The handler does minor faults (page already in RAM → install PTE, no sleep) and major faults (read from disk/swap → thread descheduled). Major faults are the reason sleepable BPF exists.
- “Sleep” in the kernel = block/deschedule, not delay. Forbidden in non-faultable/atomic contexts (IRQ, softirq/XDP, spinlock held, preemption off); allowed in faultable contexts (syscall entry, most LSM hooks, iterators).
- Sleepable BPF programs can run in faultable contexts and call helpers that page-fault or schedule. Opt in via the
.s/suffix (SEC("fentry.s/..."),SEC("lsm.s/...")). - Sleepable programs can use helpers marked
.might_sleep:bpf_copy_from_user/bpf_copy_from_user_task(and the IMA hashersbpf_ima_inode_hash/bpf_ima_file_hash, which additionally require an attach-target allowlist). (bpf_d_pathis not sleepable-only — it’s gated purely by a BTF allowlist of attach targets, with no.might_sleepflag.) - Cost & protection: sleepable progs run under an RCU Tasks Trace read-side (
rcu_read_lock_trace) plusmigrate_disable()— slightly more expensive than classic RCU, but it permits sleeping. Detach waits a tasks-trace grace period (synchronize_rcu_tasks_trace) before freeing. (Not SRCU — that’s an outdated name.) - Limit: only attach types that run in faultable contexts can be sleepable — fentry on syscalls, LSM hooks, iterators. Not XDP, softirq, or IRQ handlers.
- Modern x86-64 syscall hooks take a single
struct pt_regs *(theSYSCALL_DEFINEnwrapper convention), so you decode args withPT_REGS_PARM*_CORE_SYSCALL, not typedBPF_PROGparams. - For tracing reads where occasional misses are OK, prefer
bpf_probe_read_user_strin a non-sleepable program — cheaper and doesn’t require sleepable plumbing.
Check question
You write a sleepable fentry program that calls bpf_copy_from_user to read a 4 KB buffer. The user pointer is valid but the page isn’t currently in memory. What happens to the BPF program’s execution timeline?
Click to reveal answer
Answer: The helper’s copy_from_user touches the user address, the MMU finds the PTE not present, and the kernel takes a fault. Because the page must be fetched (a major fault), the current thread is descheduled while the page is paged in from disk/swap. The BPF program is suspended at the helper call — still inside its tasks-trace RCU read-side critical section (rcu_read_lock_trace), still migrate_disable()d to its CPU. When the page becomes available, the thread resumes, the copy completes, the helper returns. From the BPF program’s perspective, the helper call took ~ms (instead of ~ns) but otherwise behaved normally. From the kernel’s perspective, the sleepable program correctly held its tasks-trace read-side lock across the schedule, and the grace-period machinery (synchronize_rcu_tasks_trace on detach) guarantees the program can’t be freed while it’s parked here.
Tomorrow
Day 13: ringbuf at scale. What happens when your tracer is faster than its consumer. Drop counters, force-wakeup, and bpf_dynptr for variable-size events. Last day of Phase 2.
Day 13 — Ringbuf at scale: drops, back-pressure, dynptr
Today’s mission: instrument a high-rate tracer to see when it’s losing events, then fix the loss with sizing, filtering, and
bpf_dynptr. Along the way you’ll finally see whybpf_ringbuf_reservereturns NULL, how a sleeping consumer gets woken, and what abpf_dynptractually is. End of Phase 2. Total time: ~110 minutes.
When ringbuf isn’t free
Day 1 you wrote a low-rate tracer and ringbuf “just worked.” You called bpf_ringbuf_reserve to grab a slot, filled it, and bpf_ringbuf_submit’d it; userspace polled with ring_buffer__poll. That’s the whole MPSC (multi-producer, single-consumer) contract, and at a few hundred events per second you never saw it strain.
Today you’ll trace something high-rate — every vfs_read on a busy server — and watch ringbuf push back.
Ringbuf has no infinite queue. By default (the lab’s configuration, with no BPF_F_RB_OVERWRITE flag), when producers outpace the consumer bpf_ringbuf_reserve returns NULL and your event is dropped silently — unless you instrument for it. That sentence is the whole chapter, but it hides a mechanism nobody showed you on Day 1: what does “outpace” mean, concretely, and why does a fixed buffer have no choice but to fail the reservation? That’s the first thing we’ll fix.
The circular buffer: two positions chasing each other
Here’s the model Day 1 let you skip. A BPF ringbuf is one fixed, power-of-two-sized region of bytes — you pick the size at map creation (max_entries, which for ringbuf means bytes, not entries). It never grows. The kernel tracks exactly two numbers about it, and both only ever increase:
producer_pos— a running byte count of everything that has ever been reserved. The next record starts here.consumer_pos— a running byte count of everything userspace has finished draining.
Both live in struct bpf_ringbuf (kernel/bpf/ringbuf.c:28). They’re monotonic — they never wrap back to zero — and the kernel maps a byte offset into the physical ring with a single mask: offset & rb->mask, where mask = size - 1 (that’s why the size must be a power of two). So the two counters race forward forever, and the gap between them is what matters:
Unconsumed bytes =
producer_pos − consumer_pos. Free space = ring size − (producer_pos − consumer_pos).
When the consumer keeps up, consumer_pos chases producer_pos closely and there’s lots of free space. When the consumer falls behind, the gap widens until it equals the whole ring — and now there is nowhere to put the next record.
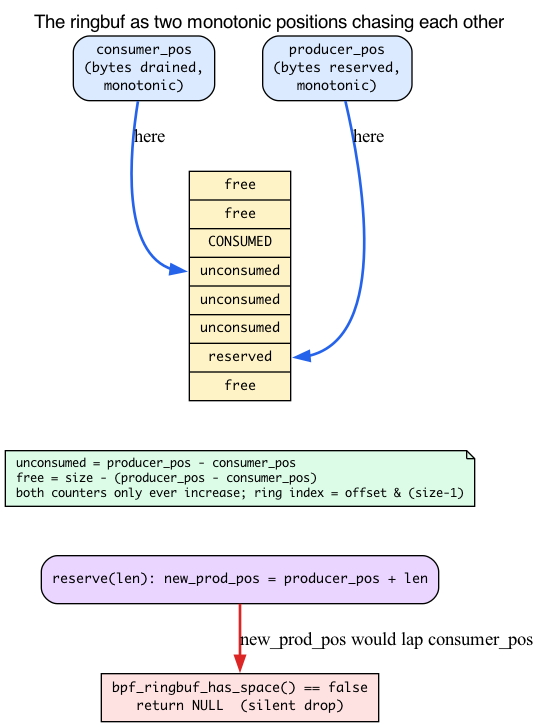
What reserve actually does
Open __bpf_ringbuf_reserve (kernel/bpf/ringbuf.c:463). Several checks can hand you back NULL; here they are in the order the kernel runs them:
1. Reject an absurd record size. The very first line rejects anything past an outer sanity ceiling:
/* kernel/bpf/ringbuf.c:469 */
if (unlikely(size > RINGBUF_MAX_RECORD_SZ))
return NULL;
RINGBUF_MAX_RECORD_SZ is UINT_MAX/4 (ringbuf.c:26) — about 1 GiB. You’ll never hit this with a sane event; it’s just an outer bound.
2. Round the request up, then reject anything bigger than the ring. Your event isn’t stored bare — each record carries an 8-byte header (BPF_RINGBUF_HDR_SZ = 8, include/uapi/linux/bpf.h:6275), and the total is rounded to 8. The rounded length is then checked against the ring’s own size:
/* kernel/bpf/ringbuf.c:472 */
len = round_up(size + BPF_RINGBUF_HDR_SZ, 8);
if (len > ringbuf_total_data_sz(rb)) /* :473 — the realistic oversize path */
return NULL;
So a tidy 32-byte struct event doesn’t cost 32 bytes — it costs round_up(32 + 8, 8) = 40 bytes of ring. (The struct is { __u32 pid; __u64 dur; char comm[16]; }; the __u64 forces 8-byte alignment, so sizeof is 32, not the 28-byte field sum.) This matters more than it looks: our demo ring is a deliberately tiny 64 KiB, so it holds only ~1,600 of these records before it’s full. At hundreds of thousands of reads per second, that’s a few milliseconds of slack. And note the :473 check: a single record larger than the whole ring is rejected right here — that’s the realistic oversize path, long before the 1 GiB ceiling.
3. Take the ring’s lock. raw_res_spin_lock_irqsave can itself fail and return NULL (ringbuf.c:478) — a rare path, but a NULL exit nonetheless.
4. Check for space — and this is your drop. The kernel computes new_prod_pos = prod_pos + len and asks whether that would collide with the not-yet-consumed region:
/* kernel/bpf/ringbuf.c:494 */
if (!bpf_ringbuf_has_space(rb, new_prod_pos, cons_pos, pend_pos)) {
raw_res_spin_unlock_irqrestore(&rb->spinlock, flags);
return NULL;
}
That return NULL is the silent drop. By default — no BPF_F_RB_OVERWRITE flag, which is what our lab uses — there is no eviction, no blocking, no “make room”: if advancing producer_pos by len would overrun where the consumer still has unread data, reserve simply fails. (v7.1 does add an opt-in overwrite mode that evicts the oldest records instead — we’ll come back to it in the Dumb Questions box; the lab never sets the flag.) On success it stamps the record’s header length with the BUSY bit (hdr->len = size | BPF_RINGBUF_BUSY_BIT, ringbuf.c:529) — the per-record “reserved but not yet submitted” marker you met on Day 1 — and hands you the slot.
Why a bigger ring doesn’t save you
Now you can answer the question we raised earlier: if drops happen, why isn’t the fix just “bigger ring”?
Because the ring size only sets the maximum gap the producer can open before reserve starts failing. A bigger ring buys more slack — more milliseconds the consumer can lag before the gap saturates. But if the producer is permanently faster than the consumer, the gap grows until it pins at “full” and stays there, no matter how big the ring is. Size buys you a longer runway for bursts; it buys you nothing against a sustained rate mismatch. The real fix for sustained pressure is to produce fewer events (filter in BPF) or smaller summaries (aggregate in BPF) — which is exactly the lab below.
Drop visibility
Default behavior: drops are silent. Your tracer just emits fewer events than it observed. Production tracers always count drops.
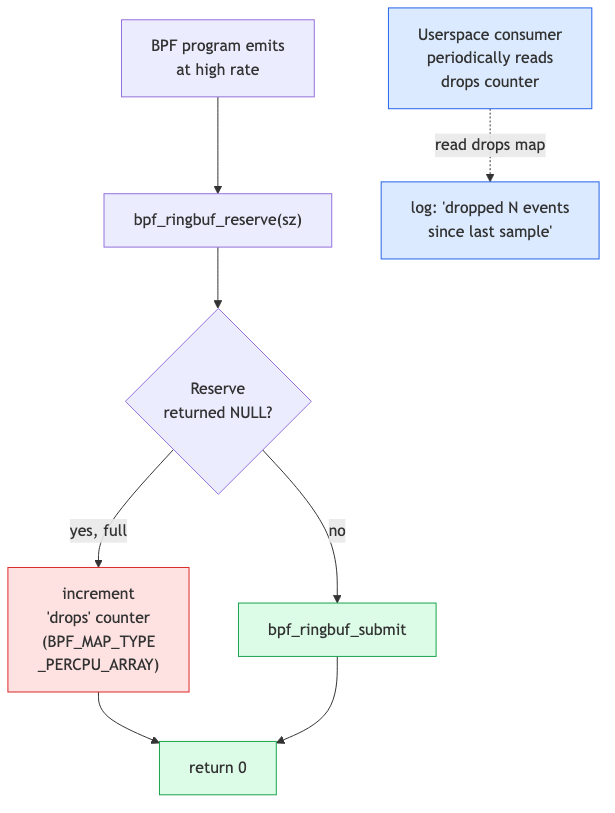
The pattern: a separate per-CPU array map for drop counts. Increment it whenever bpf_ringbuf_reserve returns NULL. Userspace samples the map periodically and logs. The drops map below is a BPF_MAP_TYPE_PERCPU_ARRAY — recall from Day 2 why per-CPU memory means inc_drops() needs no atomic (each CPU bumps its own private copy) and why sample_drops() must read an array of one __u64 per CPU and sum vals[i] across every CPU to get the real total.
How userspace sleeps, and how a producer wakes it
It’s tempting to assume the kernel wakes the consumer whenever the ring crosses some fill threshold. The real rule is simpler — and it’s the reason high-rate tracing stays cheap. Let’s build it from the bottom.
The consumer is asleep in epoll_wait
ring_buffer__poll(rb, timeout) — the loop you’ve used since Day 1 — is epoll_wait under the hood. The ringbuf file descriptor implements the kernel’s .map_poll operation (ringbuf_map_poll_kern, wired in at kernel/bpf/ringbuf.c:383). When your consumer thread polls, that function registers the thread on the ring’s wait queue and reports whether there’s data:
/* kernel/bpf/ringbuf.c:342 */
poll_wait(filp, &rb_map->rb->waitq, pts);
if (ringbuf_avail_data_sz(rb_map->rb))
return EPOLLIN | EPOLLRDNORM; /* :345 — only if unconsumed data exists */
return 0;
So with no unconsumed data, epoll_wait returns nothing to do and blocks the consumer thread on rb->waitq — zero CPU burned until something wakes it. That waitq is a wait_queue_head_t right at the top of struct bpf_ringbuf (ringbuf.c:28).
The producer wakes it through irq_work
When a producer submits a record, the kernel may need to wake that sleeping thread. It does not call the scheduler directly from submit — because submit can run in NMI or hard-IRQ context (a kprobe on a function called from an interrupt handler, say), where touching the scheduler is illegal. Instead it queues an irq_work: a tiny deferred callback that runs in a safe context. That callback is bpf_ringbuf_notify:
/* kernel/bpf/ringbuf.c:154 */
static void bpf_ringbuf_notify(struct irq_work *work)
{
struct bpf_ringbuf *rb = container_of(work, struct bpf_ringbuf, work);
wake_up_all(&rb->waitq); /* unblocks epoll_wait */
}
It’s hooked up once at ring creation (init_irq_work(&rb->work, bpf_ringbuf_notify), ringbuf.c:183). wake_up_all is what makes the consumer’s epoll_wait return.
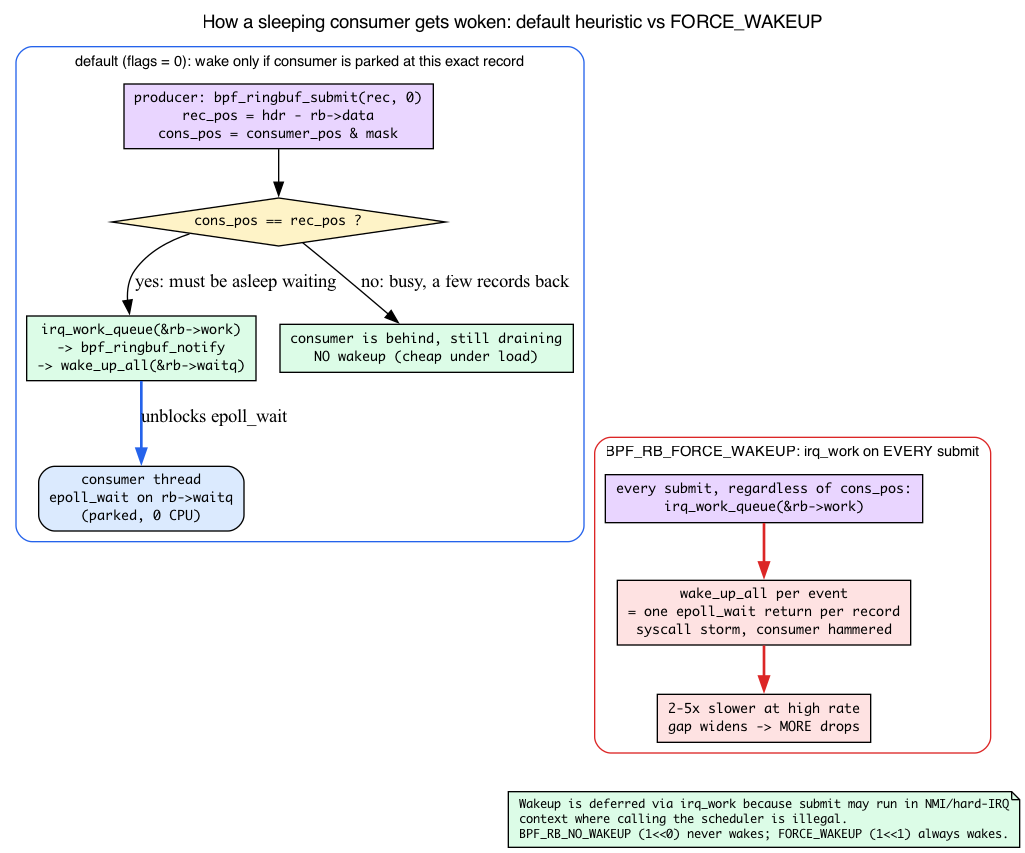
The real default heuristic: “did the consumer catch all the way up to me?”
Here’s the actual decision, in bpf_ringbuf_commit (the shared body of submit/discard):
/* kernel/bpf/ringbuf.c:578 */
rec_pos = (void *)hdr - (void *)rb->data;
cons_pos = smp_load_acquire(&rb->consumer_pos) & rb->mask;
if (flags & BPF_RB_FORCE_WAKEUP)
irq_work_queue(&rb->work); /* :581 */
else if (cons_pos == rec_pos && !(flags & BPF_RB_NO_WAKEUP))
irq_work_queue(&rb->work); /* :583 */
Read the else if carefully. The default wakes only when cons_pos == rec_pos — i.e. the consumer has drained all the way up to the exact record we just wrote. The intuition: if the consumer is sitting precisely at this record, it must be asleep waiting for it, so wake it. But if cons_pos is behind rec_pos — meaning there’s already unconsumed data ahead of the consumer — then the consumer is still busy draining and will reach this record on its own next pass. No wakeup needed.
This is the whole reason the default is cheap under load: a busy consumer is almost never parked at exactly the newest record. Under high rate it’s always a few records behind, so almost every submit skips the irq_work entirely. The wakeups happen only when the ring drains to empty and the consumer truly goes to sleep — which is exactly when you want a wakeup.
The two flags, and what they cost
bpf_ringbuf_submit(rec, flags) takes one of:
0(default) — thecons_pos == rec_posheuristic above. Right for almost everything.BPF_RB_NO_WAKEUP(= 1ULL << 0,include/uapi/linux/bpf.h:6258) — never queue a wakeup, even if the consumer is asleep at this record. Only safe when you know another event (or a later forced one) will follow soon to wake the consumer — otherwise it sleeps until your poll timeout fires. Use it to batch a known burst and wake once at the end.BPF_RB_FORCE_WAKEUP(= 1ULL << 1,:6259) — unconditionally queue theirq_workon every submit. Under high rate that’s a wakeup — and effectively a consumer-side syscall return — per event. That’s the 2–5× degradation Break 4 demonstrates.
Pass any other bit and the call is rejected — bpf_ringbuf_output checks if (flags & ~(BPF_RB_NO_WAKEUP | BPF_RB_FORCE_WAKEUP)) return -EINVAL; (ringbuf.c:619). Override the default only with cause.
bpf_dynptr: variable-size events
A subtle constraint of bpf_ringbuf_reserve(rb, sz, 0) is that sz must be constant at compile time. That isn’t a stylistic rule — it’s baked into the helper’s prototype. The size argument is typed ARG_CONST_ALLOC_SIZE_OR_ZERO (kernel/bpf/ringbuf.c:555), which tells the Verifier “this must be a compile-time constant.” The Verifier needs that constant to prove every write you do lands inside the reserved slot. A runtime-computed size gives it nothing to bound against, so it refuses the program.
So if your event size depends on, say, the bytes actually read, you have three legacy options:
- Reserve the worst-case max size; waste tail bytes when the event is smaller.
- Use
bpf_ringbuf_output(always copies bytes; skip the reserve/submit pattern). - Cap your max event size small.
In 2022 the kernel added bpf_dynptr (ring-buffer dynptr support landed in 5.19) — a runtime-sized buffer the Verifier tracks via a special pointer type with bounds. To use it correctly you need to know what it actually is.
A dynptr is a (pointer, size) capability the Verifier tracks for you
A bpf_dynptr is not a raw pointer. On the kernel side it’s a small descriptor, struct bpf_dynptr_kern (include/linux/bpf.h:1406):
struct bpf_dynptr_kern {
void *data; /* base of the region */
u32 size; /* low 24 bits = length; bits 28-30 = type (DYNPTR_TYPE_SHIFT=28); bits 24-27 reserved; bit 31 = read-only */
u32 offset; /* current offset within the region */
} __aligned(8);
The Verifier treats this as a single opaque object you may only touch through helpers — you never dereference it directly. That indirection is the whole trick: because every access goes through a helper, a runtime-chosen size can be made safe at call time. When you call bpf_dynptr_write(&ptr, off, src, len, 0), the helper checks off + len against the tracked size right then — so the Verifier doesn’t need the compile-time constant that plain reserve demands. The bounds check moved from load time to a runtime guard the helper performs on every write.
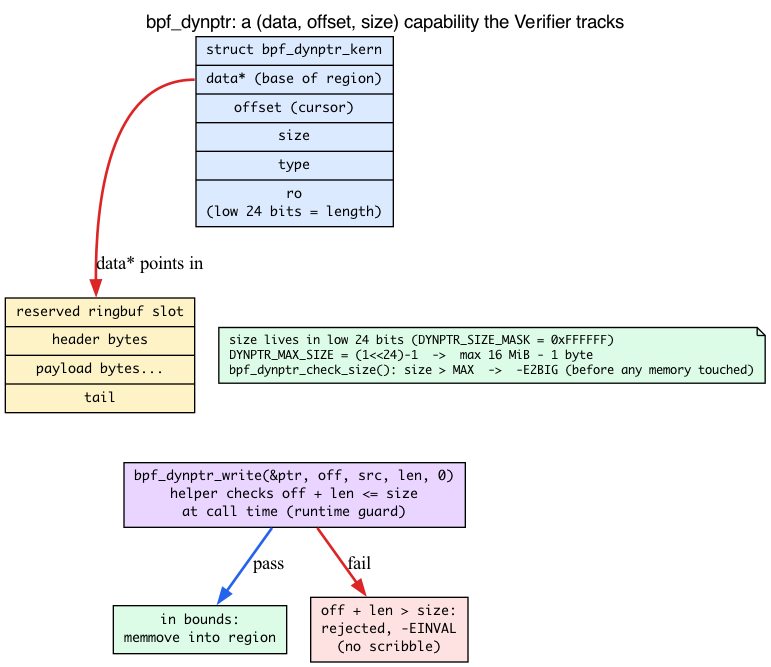
It is not a blank check: the 16 MiB ceiling
Because the length lives in only the low 24 bits of that size word (DYNPTR_SIZE_MASK = 0xFFFFFF, kernel/bpf/helpers.c:1765; extracted by __bpf_dynptr_size, :1788/:1796), the largest region a dynptr can describe is (1 << 24) − 1 = 16 MiB minus one byte (DYNPTR_MAX_SIZE = (1UL << 24) - 1, helpers.c:1763). Ask for more and the reservation fails before any memory is touched:
/* kernel/bpf/helpers.c:1823 */
int bpf_dynptr_check_size(u64 size)
{
return size > DYNPTR_MAX_SIZE ? -E2BIG : 0;
}
So a dynptr is a bounded capability, not an unlimited one.
Lifecycle: same reserve/release discipline as plain reserve
struct bpf_dynptr ptr;
bpf_ringbuf_reserve_dynptr(&rb, sz, 0, &ptr);
bpf_dynptr_write(&ptr, 0, &header, sizeof(header), 0);
bpf_dynptr_write(&ptr, sizeof(header), payload, payload_len, 0);
bpf_ringbuf_submit_dynptr(&ptr, 0);
bpf_ringbuf_reserve_dynptr (kernel/bpf/ringbuf.c:670) reserves a slot the same way plain reserve does, then on success calls bpf_dynptr_init(ptr, sample, BPF_DYNPTR_TYPE_RINGBUF, 0, size) (ringbuf.c:696; the init helper is helpers.c:1847) so the dynptr now is a typed handle over the reserved ring slot. From there the discipline is identical to Day 1’s reserve/submit: you must follow with exactly one bpf_ringbuf_submit_dynptr or bpf_ringbuf_discard_dynptr. A reserved-but-never-released slot is poison — its header still carries the BUSY bit, which (recall the pending-position scan in reserve) wedges the ring’s ability to reclaim space.
One detail that makes the failure path read correctly: when reserve fails, the helper returns a negative error and nulls the dynptr — bpf_dynptr_set_null(ptr) (ringbuf.c:678/:684/:692), which memsets the whole descriptor to zero (helpers.c:1856). A nulled dynptr has data == NULL, so any subsequent bpf_dynptr_write through it is rejected too. That’s why Break 3 can safely call discard on the failure path without checking — and why a write through a failed reservation can never scribble somewhere bad.
bpf_dynptr_write itself is a plain in-kernel memmove into the tracked region (__bpf_dynptr_write, helpers.c:1952; the helper entry is :1994). It does not read user memory — that’s the Day 12 distinction Break 3 leans on. The Verifier statically tracks the dynptr’s bounds and the helper enforces them per call, so out-of-bounds writes are rejected. Performance is identical to direct reserve.
There are no Dumb Questions
Q: Does ringbuf drop the new event or the oldest event when full?
A: With the default ringbuf (no
BPF_F_RB_OVERWRITE) — which is what our lab uses — it drops the new one:bpf_ringbuf_reservesimply fails,bpf_ringbuf_has_space()says no, and__bpf_ringbuf_reservereturns NULL. The unconsumed span is never overwritten. v7.1 adds an opt-in overwrite mode (BPF_F_RB_OVERWRITE,1U<<19): therebpf_ringbuf_has_space()returns true even when full and__bpf_ringbuf_reservewalksoverwrite_pospast the oldest records to make room — i.e. it evicts the oldest unconsumed data instead. Our demo never sets the flag, so it gets the default drop-the-new behavior.Q: Should I size ringbuf to the worst-case rate?
A: No. Worst-case is unbounded. Size it to handle a few seconds of typical-rate burst (256 KiB — 4 MiB is common). Under sustained high rate, you’ll drop. The fix at that point isn’t a bigger ringbuf (see “Why a bigger ring doesn’t save you” above) — it’s filtering more aggressively in BPF, or aggregating in BPF and emitting summaries.
Q: Why is event size limited to constant in plain reserve?
A: Because the Verifier needs to bound the access pattern statically —
reserve’s size argument is literally typedARG_CONST_ALLOC_SIZE_OR_ZERO. Without a known size, it can’t prove your writes stay within the reserved slot.bpf_dynptris the new mechanism specifically designed to track runtime size at the type level and check each write against it at call time.
The lab
dropviz.bpf.c
The program is the Day 6 entry/exit latency pattern — a starts hash keyed by TID, written at fentry and read at fexit to compute a duration — reused here only as a convenient way to generate a high event rate. (Recall from Day 6 the TID-keyed start-timestamp map and its recursion/collision caveats; we don’t need them today.)
The producer and consumer share the event layout through one header:
#ifndef PRACTICAL_EBPF_DROPVIZ_H #define PRACTICAL_EBPF_DROPVIZ_H
struct event { unsigned int pid; unsigned long long dur; char comm[16]; };
#endif
and the program is included from the compiled source:
#include “vmlinux.h” #include <bpf/bpf_helpers.h> #include <bpf/bpf_tracing.h>
#include “dropviz.h”
char LICENSE[] SEC(“license”) = “GPL”;
struct { __uint(type, BPF_MAP_TYPE_RINGBUF); __uint(max_entries, 64 * 1024); /* deliberately small to demo drops */ } rb SEC(“.maps”);
struct { __uint(type, BPF_MAP_TYPE_PERCPU_ARRAY); __uint(max_entries, 1); __type(key, __u32); __type(value, __u64); } drops SEC(“.maps”);
struct { __uint(type, BPF_MAP_TYPE_HASH); __uint(max_entries, 4096); __type(key, __u64); __type(value, __u64); } starts SEC(“.maps”);
static __always_inline void inc_drops(void) { __u32 z = 0; __u64 *c = bpf_map_lookup_elem(&drops, &z); if (c) (*c)++; }
SEC(“fentry/vfs_read”) int BPF_PROG(on_in, struct file *f, char *buf, size_t n, loff_t *pos) { __u64 tid = bpf_get_current_pid_tgid() & 0xffffffff; __u64 ts = bpf_ktime_get_ns();
(void)f;
(void)buf;
(void)n;
(void)pos;
bpf_map_update_elem(&starts, &tid, &ts, BPF_ANY);
return 0;
}
SEC(“fexit/vfs_read”) int BPF_PROG(on_out, struct file *f, char *buf, size_t n, loff_t *pos, ssize_t ret) { __u64 id = bpf_get_current_pid_tgid(); __u64 tid = id & 0xffffffff; __u64 *ts = bpf_map_lookup_elem(&starts, &tid); __u64 dur; struct event *e;
(void)f;
(void)buf;
(void)n;
(void)pos;
(void)ret;
if (!ts)
return 0;
dur = bpf_ktime_get_ns() - *ts;
bpf_map_delete_elem(&starts, &tid);
/* Filter to keep rate sane (comment out to demonstrate drops). */
if (dur < 5000)
return 0; /* skip < 5µs */
e = bpf_ringbuf_reserve(&rb, sizeof(*e), 0);
if (!e) {
inc_drops();
return 0;
}
e->pid = id >> 32;
e->dur = dur;
bpf_get_current_comm(&e->comm, sizeof(e->comm));
bpf_ringbuf_submit(e, 0);
return 0;
}
Notice inc_drops() increments without any atomic — that’s the per-CPU array doing its Day 2 job: each CPU touches its own copy, so there’s nothing to race over.
dropviz.c — userspace + drop monitor
The loader lives in the repository’s ebpf/labs/day13 directory; the build
generates dropviz.skel.h (the typed accessors for skel->maps.rb,
skel->maps.drops, etc.) from dropviz.bpf.o. The listing below is included
from the source compiled by make dropviz and CI:
#include <errno.h> #include <signal.h> #include <stdio.h> #include <string.h> #include <time.h>
#include <bpf/bpf.h> #include <bpf/libbpf.h>
#include “dropviz.h” #include “dropviz.skel.h”
static volatile sig_atomic_t exiting;
static void handle_signal(int signal_number) { (void)signal_number; exiting = 1; }
static int install_signal_handlers(void) { const struct sigaction action = { .sa_handler = handle_signal, };
if (sigaction(SIGINT, &action, NULL) != 0 ||
sigaction(SIGTERM, &action, NULL) != 0) {
fprintf(stderr, "failed to install signal handlers: %s\n",
strerror(errno));
return -errno;
}
return 0;
}
static int handle_event(void *ctx, void *data, size_t size) { const struct event *e = data;
(void)ctx;
if (size != sizeof(*e)) {
fprintf(stderr, "unexpected ringbuf record size: %zu\n", size);
return 0;
}
printf("%-16.*s pid=%-7u dur=%llu ns\n", (int)sizeof(e->comm), e->comm,
e->pid, e->dur);
return 0;
}
/* Sample the per-CPU drops counter and sum across CPUs. */ static void sample_drops(int fd) { int ncpu = libbpf_num_possible_cpus(); __u64 total = 0; __u32 key = 0;
if (ncpu <= 0)
return;
__u64 vals[ncpu];
if (bpf_map_lookup_elem(fd, &key, vals) != 0)
return;
for (int i = 0; i < ncpu; i++)
total += vals[i];
fprintf(stderr, "[total drops: %llu]\n", total);
}
int main(void) { struct dropviz_bpf *skel = NULL; struct ring_buffer *ringbuf = NULL; struct timespec last, now; int drops_fd; int err;
setvbuf(stdout, NULL, _IOLBF, 0);
err = install_signal_handlers();
if (err)
return 1;
skel = dropviz_bpf__open_and_load();
if (!skel) {
fprintf(stderr, "failed to open and load dropviz BPF skeleton\n");
return 1;
}
err = dropviz_bpf__attach(skel);
if (err) {
fprintf(stderr, "failed to attach dropviz BPF programs: %s\n",
strerror(-err));
goto cleanup;
}
ringbuf = ring_buffer__new(bpf_map__fd(skel->maps.rb), handle_event,
NULL, NULL);
err = libbpf_get_error(ringbuf);
if (err) {
ringbuf = NULL;
fprintf(stderr, "failed to create ringbuf consumer: %s\n",
strerror(-err));
goto cleanup;
}
drops_fd = bpf_map__fd(skel->maps.drops);
puts("Tracing vfs_read latency; sampling drops every ~1s. "
"press Ctrl-C to stop.");
clock_gettime(CLOCK_MONOTONIC, &last);
while (!exiting) {
err = ring_buffer__poll(ringbuf, 100); /* 100 ms timeout */
if (err == -EINTR) {
err = 0;
continue;
}
if (err < 0) {
fprintf(stderr, "ringbuf poll failed: %s\n", strerror(-err));
goto cleanup;
}
clock_gettime(CLOCK_MONOTONIC, &now);
if (now.tv_sec - last.tv_sec >= 1) { /* ~1s tick */
sample_drops(drops_fd);
last = now;
}
}
err = 0;
cleanup: ring_buffer__free(ringbuf); dropviz_bpf__destroy(skel); return err != 0; }
The sample_drops reader is the per-CPU read-out from Day 2 in the flesh: bpf_map_lookup_elem on a per-CPU map copies out one __u64 per CPU into vals[], and the loop sums them into the logical total. ring_buffer__poll is the epoll_wait we dissected above — when the ring is empty this thread sleeps on the ring’s waitq for up to 100 ms, burning no CPU, until a submit’s irq_work wakes it.
Run with deliberate pressure
First, disable the 5µs filter for this demo only: the dur in on_out is wall time across vfs_read, and /dev/zero reads with bs=512 complete in well under 1µs, so the if (dur < 5000) return 0; line filters out ~99.9% of events before they ever reach bpf_ringbuf_reserve — leaving the drop counter stuck at [total drops: 0]. To make the flood reach the ringbuf, comment out the if (dur < 5000) return 0; line (or simply drop the threshold to 0) and rebuild. Avoid rewriting it as if (dur < 0): dur is __u64, so an unsigned < 0 compare is always false — the optimizer deletes it and the compiler may warn -Wtype-limits, which only confuses the point. (We put the filter back as a fix below.)
make
sudo ./dropviz &
# Generate massive read pressure: ~500k reads/sec straight through vfs_read
dd if=/dev/zero of=/dev/null bs=512 count=10000000 &
Watch (representative — exact numbers vary with CPU and consumer speed):
[total drops: 0]
[total drops: 0]
[total drops: 1452]
[total drops: 4031]
[total drops: 7821]
If you see [total drops: 0] forever, the filter is eating everything — confirm you actually lowered the threshold and rebuilt. Drops appear because hundreds of thousands of fast reads/sec push producer_pos forward far faster than the single-threaded poll loop can advance consumer_pos, so the gap pins at the full 64 KiB and bpf_ringbuf_has_space() starts returning false.
Let it run ~10s to watch drops accumulate, then stop both background jobs:
kill %2 2>/dev/null # the dd job
sudo pkill dropviz # the tracer — it polls forever, so Ctrl-C won't reach a backgrounded job
The dd job reads ~5 GB and would eventually exit on its own, but dropviz runs an indefinite poll loop and must be killed explicitly. Now fix:
- Increase ringbuf size to 4 MiB (
64 * 1024 * 64). Drops should stop or shrink. (This widens the gap the producer can open before saturation — good against bursts, not against a permanent rate mismatch.) - Raise the filter threshold — change the 5µs cutoff (
dur < 5000) to 100µs (dur < 100000) so more events are filtered out in BPF before they ever reach the ringbuf. (This lowers the production rate — the real fix.) - Slow down the consumer’s per-event work in your handler. (Print less, so
consumer_posadvances faster.)
Each adjustment you can verify by re-running the workload and watching the drops counter.
What to break, in order
Break 1 — Don’t increment the drop counter
Comment out inc_drops(). Run heavy. You’ll see fewer events than expected — but no signal indicating events are missing. This is how production tracers go silently wrong. Always count drops.
Break 2 — Use bpf_ringbuf_output instead
struct event ev = { ... fill in ... };
long ret = bpf_ringbuf_output(&rb, &ev, sizeof(ev), 0);
if (ret < 0) inc_drops();
Functionally similar; uses copy semantics instead of reserve/submit. About 10% slower per event (it does the reserve, then a memcpy of your stack struct into the slot, then the commit — versus you filling the slot in place). Useful when the event lives on the BPF stack and you don’t want to keep two pointers (the local + the reserved one).
Break 3 — Variable-size with dynptr
Two things make the naive version wrong, and both matter:
- Capture at
fexit, notfentry. At entry the read hasn’t happened yet, so the user bufferbufis not populated — there is nothing to copy. (This is why the lab’s hooks are split the Day 6 way.) bpf_dynptr_writedoes a plain kernelmemmove; it does not read user memory. Passing thechar __user *bufdirectly assrccopies garbage, and the Verifier rejects a raw user pointer where it expects kernel-residentARG_PTR_TO_MEM. You must first stage the user bytes into a bounded kernel stack temp withbpf_probe_read_user— recall from Day 12 why a__userpointer can’t be dereferenced directly and must be copied in (it lives in another address space and may fault).
SEC("fexit/vfs_read")
int BPF_PROG(on_out_dyn, struct file *f, char *buf, size_t n, loff_t *pos, ssize_t ret)
{
if (ret <= 0) return 0;
/* cap to a compile-time constant so the Verifier can bound the copy */
__u32 to_emit = ret > 64 ? 64 : ret;
char tmp[64];
if (bpf_probe_read_user(tmp, to_emit, buf) < 0)
return 0;
struct bpf_dynptr ptr;
if (bpf_ringbuf_reserve_dynptr(&rb, sizeof(struct event) + to_emit, 0, &ptr) < 0) {
inc_drops();
bpf_ringbuf_discard_dynptr(&ptr, 0); /* every reserve needs a submit OR discard */
return 0;
}
struct event hdr = {};
hdr.pid = bpf_get_current_pid_tgid() >> 32;
bpf_get_current_comm(&hdr.comm, sizeof(hdr.comm));
bpf_dynptr_write(&ptr, 0, &hdr, sizeof(hdr), 0);
bpf_dynptr_write(&ptr, sizeof(hdr), tmp, to_emit, 0); /* kernel src, in-bounds */
bpf_ringbuf_submit_dynptr(&ptr, 0);
return 0;
}
The to_emit = ret > 64 ? 64 : ret cap is what lets the Verifier prove the bpf_probe_read_user and the second bpf_dynptr_write stay within tmp[64]. The discard on the failure path is safe even though the reservation failed — recall that a failed bpf_ringbuf_reserve_dynptr nulls the dynptr (bpf_dynptr_set_null), so there’s nothing live to corrupt. Now event size depends on the actual bytes read. Try replacing your reserve-and-submit pattern with this for a tracer that captures variable-length data.
Break 4 — Force-wakeup spam
bpf_ringbuf_submit(e, BPF_RB_FORCE_WAKEUP);
On every event, regardless of what’s pending. Rebuild, run heavy. Watch CPU usage of the userspace process — every forced submit queues the irq_work that calls wake_up_all, returning the consumer’s epoll_wait once per event. With the default cons_pos == rec_pos heuristic disabled, a busy consumer that would normally never be woken under load is now woken on every single record — performance degrades 2–5× for high-rate workloads. Reset to 0.
What to read in the kernel
kernel/bpf/ringbuf.c— the whole file is ~700 lines. Read top to bottom. Notestruct bpf_ringbuf(:28) with itsproducer_pos/consumer_pos/pending_pos,__bpf_ringbuf_reserve(:463) and thebpf_ringbuf_has_spaceNULL path (:494),bpf_ringbuf_commitand the wakeup logic aroundBPF_RB_FORCE_WAKEUP(:578–:583), andbpf_ringbuf_notify→wake_up_all(:158).include/uapi/linux/bpf.h— searchBPF_RB_FORCE_WAKEUP/BPF_RB_NO_WAKEUP(:6258–:6259) and theBPF_RINGBUF_*flags (:6273–:6275).kernel/bpf/helpers.c— the dynamic-pointer bounds-tracking implementation. Readbpf_dynptr_init(:1847),bpf_dynptr_check_size(:1823), and the_write/_readhelpers (__bpf_dynptr_writeat:1952).struct bpf_dynptr_kernis ininclude/linux/bpf.h:1406.tools/testing/selftests/bpf/progs/test_ringbuf.candtest_ringbuf_multi.c— examples of the patterns we covered.
Bullet Points
- A ringbuf is a fixed power-of-two byte ring with two monotonic counters:
producer_pos(reserved) andconsumer_pos(drained). Free space = size − (producer_pos − consumer_pos). - Each record costs
round_up(size + 8, 8)bytes (8-byte header). Reserve returns NULL when the size exceeds ~1 GiB (RINGBUF_MAX_RECORD_SZ) or, the common case, whenbpf_ringbuf_has_space()says the new record would overrun the unconsumed span. That NULL is the silent drop. - By default ringbuf drops the new event when full (no eviction); v7.1’s opt-in
BPF_F_RB_OVERWRITEmode instead evicts the oldest records. Either way, a bigger ring only widens the burst the gap can absorb — it does nothing against a sustained producer/consumer rate mismatch. Filter or aggregate in BPF instead. - Always count drops in a per-CPU array (Day 2: no atomic needed; sum across CPUs in userspace).
- The consumer sleeps in
epoll_waiton the ring’swaitq(.map_poll), burning zero CPU. A producer wakes it via anirq_workrunningwake_up_all(deferred because submit can run in IRQ/NMI context). - The default wakeup heuristic is
cons_pos == rec_pos— wake only when the consumer has caught all the way up to this record (so it must be asleep waiting). A busy consumer is rarely there, which is why the default is cheap under load. BPF_RB_FORCE_WAKEUP(1<<1) wakes on every event — a syscall storm under load (2–5× slower).BPF_RB_NO_WAKEUP(1<<0) never wakes. Any other flag bit →-EINVAL.bpf_dynptrfor variable-size events; same throughput as direct reserve. Plain reserve’s size isARG_CONST_ALLOC_SIZE_OR_ZERO(must be constant); a dynptr moves the bounds check to a per-write runtime guard.- A dynptr is a
(data, offset, size)capability (struct bpf_dynptr_kern); the Verifier tracks it as opaque and the helpers checkoffset+lenagainstsizeon every access. Size lives in the low 24 bits → max 16 MiB − 1 (-E2BIGabove that). A failed reserve nulls the dynptr, so its failure path is safe.
Check question
Your tracer is dropping events under load. You bump the ringbuf from 64 KiB to 16 MiB and the drops briefly go away, then come right back at the same sustained rate. Separately, a teammate suggests adding BPF_RB_FORCE_WAKEUP to “make sure userspace keeps up.” Explain, in terms of producer_pos/consumer_pos and the wakeup heuristic, why the bigger ring didn’t fix the sustained drops and why FORCE_WAKEUP would make things worse, not better.
Click to reveal answer
Answer: The ring size only sets the maximum gap producer_pos − consumer_pos before bpf_ringbuf_has_space() starts failing reservations. A bigger ring buys a longer runway, so a burst drains its backlog and drops stop for a moment — but if the producer is permanently faster than the consumer, the gap grows back until it pins at the full ring size and reserve fails again. Free space is size − (producer_pos − consumer_pos); when the rate mismatch is sustained, that term goes to zero regardless of size. The real fix is to lower the production rate (filter/aggregate in BPF) or speed up the consumer.
BPF_RB_FORCE_WAKEUP makes it worse because the default heuristic only queues a wakeup when cons_pos == rec_pos — i.e. when the consumer is actually asleep waiting for this exact record. Under sustained load the consumer is never there (it’s always behind), so the default issues almost no wakeups and lets the consumer drain in bulk. FORCE_WAKEUP queues the irq_work → wake_up_all on every submit, returning the consumer’s epoll_wait once per event. That’s a syscall-per-event storm that slows the consumer down, widening the gap and causing more drops, not fewer.
End of Phase 2
You now have:
- Latency tracing with fentry/fexit and the entry/exit map pattern (Day 6).
- Argument access for every program type — fentry, kprobe, raw tracepoint, tp_btf (Day 7).
- Tracepoint discovery and the tp_btf vs raw decision (Day 8).
- Stack traces and the path to flame graphs (Day 9).
- Userspace tracing via uprobes and USDT (Day 10).
- Multi-probe attach for tracing many functions at once (Day 11).
- Sleepable BPF for helpers that fault (Day 12).
- Ringbuf scaling, the producer/consumer position model, drop visibility, the wakeup path, and dynptr (Day 13).
That’s enough to write production observability tools competitive with bpftrace’s tracers. Phase 3 (Days 14–19) shifts to networking: XDP, tc, tcx, AF_XDP, and cgroup/sockops.
When ready, signal me to continue.
Day 14 — XDP: count every packet on an interface
Today’s mission: count packets per protocol on a network interface, faster than the kernel can allocate sk_buffs. Along the way, learn the four things 13 days of tracing never taught you: what a packet actually looks like as bytes, why a 2-byte field needs
bpf_htonsand a 1-byte field doesn’t, howdata/data_endand a bounds compare make a packet read legal, and what avethpair plus a network namespace really are. Total time: ~110 minutes.
Phase 3 starts here. Days 14–19 are about networking BPF. You’ll see XDP, tc, tcx, AF_XDP, cgroup, sockops. By Day 19 you’ll be able to write the kind of packet-path BPF that powers Cilium and similar projects.
XDP, the earliest hook in the kernel
Yesterday’s tracing programs ran when something interesting happened to a function that already existed. XDP is different: XDP runs the moment a packet arrives at the NIC, before the kernel allocates an sk_buff, before any iptables, routing, or socket lookup happens.

Where exactly is “the moment a packet arrives”?
You’ve spent 13 days hooking functions. XDP isn’t a function you hook — it’s a callout the driver makes, at a very specific point, and that point is the whole reason XDP is fast. Here’s the one-paragraph refresher (the companion linux-net book, Day 1, teaches all of this in full — NIC RX descriptor rings, DMA, and the cost of an sk_buff — so we won’t re-derive it here):
When a NIC has received frames, it raises an interrupt; the driver then polls a batch of frames off its RX descriptor ring in softirq context — this batched-poll mechanism is called NAPI. By the time the driver’s poll routine runs, the NIC’s DMA engine has already written the frame bytes into a page in RAM. XDP runs inside that poll, handed a pointer to that raw DMA’d frame buffer, before an sk_buff is ever allocated. That’s the entire value proposition: you get to look at (and drop, or redirect) the packet while it’s still just bytes in a page, skipping the cost of building the kernel’s heavyweight packet container.
That allocation is not free. Building an sk_buff runs on the order of a few hundred nanoseconds on a modern x86 (the descriptor alone is ~230 bytes from a dedicated slab cache, plus a separate data-buffer allocation); routing/lookup/etc. add hundreds more. XDP runs before all of it. (Recall the two-allocation sk_buff model — descriptor cache plus data buffer — from linux-net Day 1; here we only care that XDP skips that cost.) XDP runs in the driver’s NAPI poll, called with a pointer to the raw frame, returns an action constant, and that’s it.
You can see the exact callout the driver makes: it’s the inline bpf_prog_run_xdp at include/net/xdp.h:689. Today we’ll attach to a veth device, and veth invokes XDP through that same inline (drivers/net/veth.c:657 and :819) that a physical NIC driver uses — which is precisely why veth is a faithful XDP test bed.
Throughput numbers in the literature: 10 Mpps per core trivially, 100+ Mpps with hardware offload (offloaded XDP on supporting NICs) — both workload- and NIC-dependent. Your single-core software cap is around the line rate of a 10 Gbps link with small packets.
A packet is just bytes: the Ethernet and IPv4 layout
Before we touch struct xdp_md, stop and look at what the driver actually handed us: a flat buffer of bytes. No structs, no fields — just byte 0, byte 1, byte 2, and so on. ctx->data points at byte 0. Everything the program does today is interpreting those bytes by laying header structs over them.
For an ordinary IPv4 packet the first bytes look like this:
[ Ethernet header : 14 bytes ][ IP header : ≥20 bytes ][ L4 (TCP/UDP/ICMP) ... ]
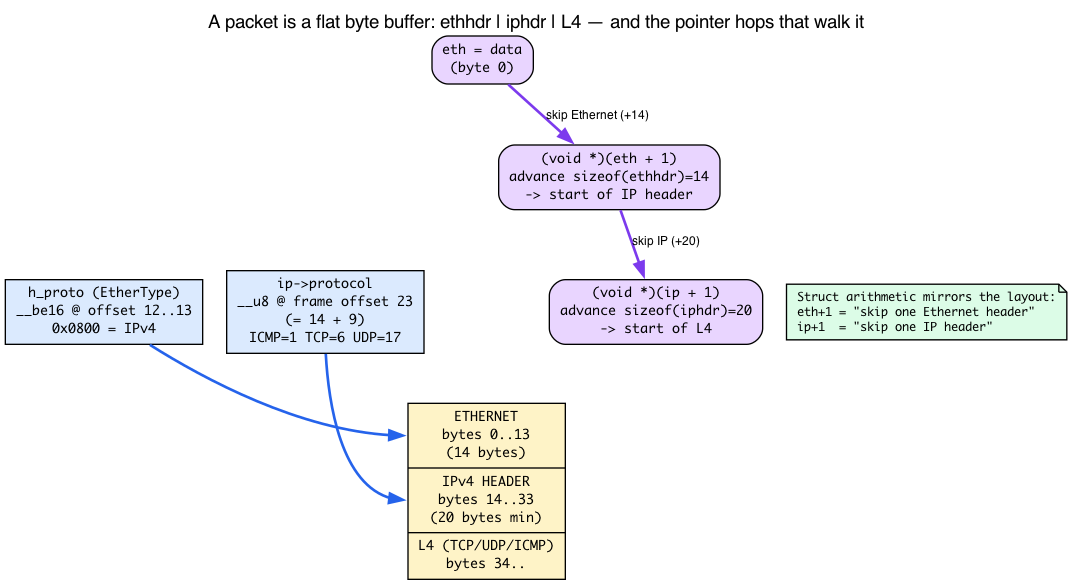
The Ethernet header — exactly 14 bytes
The frame starts with struct ethhdr, and it is one of the simplest structs in the kernel — three fields, and __packed so the compiler inserts no padding (include/uapi/linux/if_ether.h:177):
/* include/uapi/linux/if_ether.h:177 */
struct ethhdr {
unsigned char h_dest[ETH_ALEN]; /* destination MAC — 6 bytes, offset 0 */
unsigned char h_source[ETH_ALEN]; /* source MAC — 6 bytes, offset 6 */
__be16 h_proto; /* EtherType — 2 bytes, offset 12 */
} __attribute__((packed));
ETH_ALEN is 6, so 6 + 6 + 2 = 14 bytes — which is exactly the named constant ETH_HLEN == 14 (if_ether.h:34). The last field, h_proto, is the EtherType: it tells you what header comes next. The value we care about is ETH_P_IP == 0x0800 (if_ether.h:52), meaning “an IPv4 packet follows.” That’s the check the program makes first: is this even an IP packet?
The IPv4 header — and where protocol lives
If the EtherType says IP, the bytes at offset 14 are struct iphdr (include/uapi/linux/ip.h:87):
/* include/uapi/linux/ip.h:87 */
struct iphdr {
__u8 ihl:4, /* header length in 32-bit words — first byte... */
version:4; /* ...packed with version (little-endian layout) */
__u8 tos; /* offset 1 */
__be16 tot_len; /* offset 2 */
__be16 id; /* offset 4 */
__be16 frag_off; /* offset 6 */
__u8 ttl; /* offset 8 */
__u8 protocol; /* offset 9 ← the field we read (ip.h:102) */
__sum16 check;
/* ... saddr, daddr ... */
};
Two things to notice. First, the very first byte packs version:4 and ihl:4 together — which means the IP header length is variable: ihl counts 32-bit words, so the header is ihl * 4 bytes, minimum 20. (For our counting program we don’t need to parse options, so we treat it as the fixed 20-byte minimum.)
Second, and this is the number the whole lab hinges on: protocol is a single __u8 at byte offset 9 of the IP header (ip.h:102). Walk it: version/ihl (1) + tos (1) + tot_len (2) + id (2) + frag_off (2) + ttl (1) = 9 bytes before it. This one byte is the key the map is indexed by: ICMP = 1, TCP = 6, UDP = 17.
Pointer arithmetic mirrors the layout
The code never computes these offsets by hand — it lets C pointer arithmetic do it. Watch how the casts walk the buffer:
struct ethhdr *eth = data;—ethpoints at byte 0.(void *)(eth + 1)— advancing astruct ethhdr *by one whole struct moves the pointersizeof(struct ethhdr) == 14bytes forward. That lands exactly on the start of the IP header.(void *)(ip + 1)— advancing astruct iphdr *by one moves past the (fixed-size) IP header to the start of L4.
So eth + 1 is “skip the Ethernet header” and ip + 1 is “skip the IP header,” expressed as struct arithmetic. This is also the secret decoder ring for Break 1’s off=23: the IP header’s protocol sits at frame offset 14 (one Ethernet header) + 9 (offset inside the IP header) = 23.
That’s all the wire format we need today — just byte offsets. The full kernel RX/stack treatment lives in the companion linux-net book; here we only borrow the layout.
Network byte order: why bpf_htons wraps some values and not others
There’s a trap hiding in h_proto. Look at the struct ethhdr again: h_proto is typed __be16, not __u16. The __be prefix is the kernel’s machine-checkable way of saying “this field is big-endian” — and it is not decoration. Every multi-byte protocol field on the wire is big-endian (most-significant byte first): EtherTypes, IP tot_len, TCP/UDP ports, IP id. You can read it straight off the struct types — __be16 h_proto, __be16 tot_len, __be32 saddr — every __be* is the kernel telling you “big-endian.”
x86 is little-endian. So when you write the constant ETH_P_IP (0x0800) in your C program, the compiler stores it in memory the x86 way — low byte first, as 00 08. But the wire delivered those two bytes as 08 00. If you compared the raw 16-bit field against the raw constant, you’d be comparing 08 00 against 00 08 — they’d never match, silently, and your program would think no packet is ever IP.
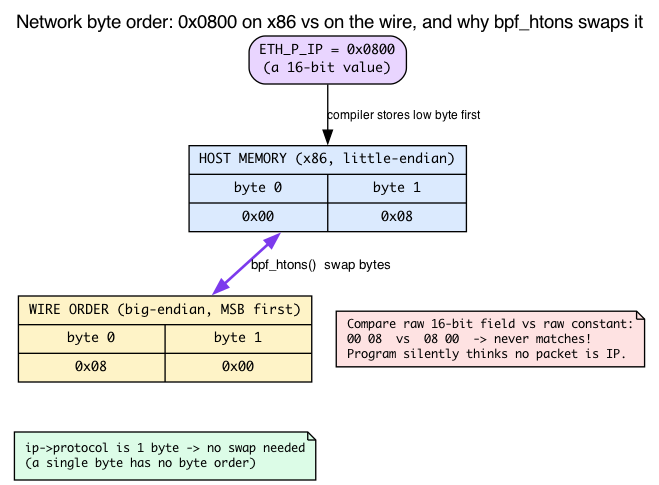
bpf_htons() (“host to network, short”) performs that byte swap, converting your host-order constant into wire order so the comparison is correct. That’s why the program reads:
if (eth->h_proto != bpf_htons(ETH_P_IP)) /* swap the constant to wire order */
return XDP_PASS;
The portable versions live in #include <bpf/bpf_endian.h>, which is why the program pulls that header in.
The rule of thumb: convert whenever the field is 2 or more bytes — h_proto, tcp->dest, ip->tot_len. A single byte has no byte order at all (there’s nothing to swap), so ip->protocol is read raw. That is exactly why the program wraps ETH_P_IP but reads ip->protocol directly — and why Break 4’s tcp->dest (a __be16 port) would need bpf_ntohs if you wanted to print it as a host number. The direction is symmetric: bpf_htons (host→wire) for constants you compare against, bpf_ntohs (wire→host) when you pull a wire value out to use as a number.
The XDP context: struct xdp_md
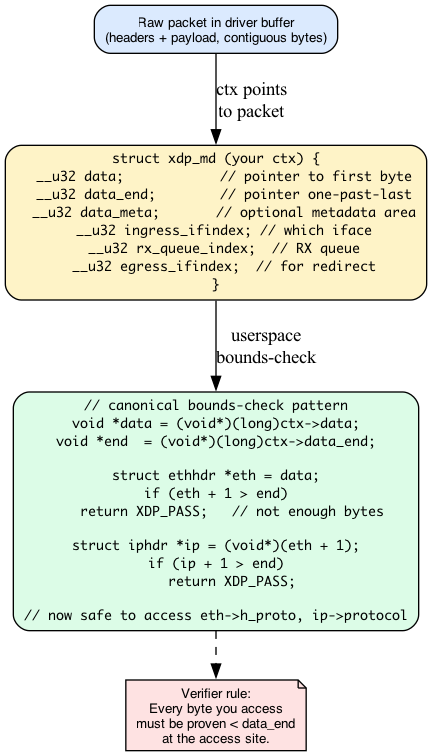
You receive struct xdp_md *ctx. The two fields you’ll touch on every program (include/uapi/linux/bpf.h:6560-6561):
ctx->data— pointer (cast from u32) to the first packet byte.ctx->data_end— pointer one-past-the-last byte.
Other fields:
ingress_ifindex— which interface the packet arrived on.rx_queue_index— which NIC RX queue.data_meta— optional metadata area (Day 18, AF_XDP).egress_ifindex— only readable in devmap-egress XDP programs (expected_attach_type == BPF_XDP_DEVMAP); the Verifier rejects access from a plainSEC("xdp")program (seexdp_is_valid_accessinnet/core/filter.c).
data / data_end: the packet-pointer model
Here is the part that 13 days of tracing never prepared you for. ctx->data and ctx->data_end are a matched pair of packet pointers:
datais aPTR_TO_PACKET— the start of the readable window.data_endis aPTR_TO_PACKET_END— one byte past the last readable byte.
They are runtime values. The verifier does not know the packet’s length when it checks your program at load time — a 64-byte ARP and a 1500-byte TCP segment both arrive through the same code. So the verifier can’t just trust you to read 34 bytes; it has no idea whether 34 bytes are even present.
What the verifier does do is track a proven-safe range on the packet pointer. Initially that range is zero bytes — the verifier will reject any dereference of data, because nothing has proven a single byte is in-bounds. You enlarge the range with a comparison against data_end:
struct ethhdr *eth = data;
if (eth + 1 > end) /* "are the 14 bytes of an ethhdr present?" */
return XDP_PASS; /* not enough bytes — bail out */
/* fall-through branch: verifier now KNOWS 14 bytes from data are safe */
Writing if (eth + 1 > end) return XDP_PASS; and continuing on the false branch teaches the verifier “sizeof(ethhdr) bytes from data are in-bounds.” Only then may you read eth->h_proto. This is the mechanism Day 4 named in one line (find_good_pkt_pointers, the range-narrowing routine at kernel/bpf/verifier.c:15422, triggered by exactly this x + 1 > end compare). Today you use it for real.
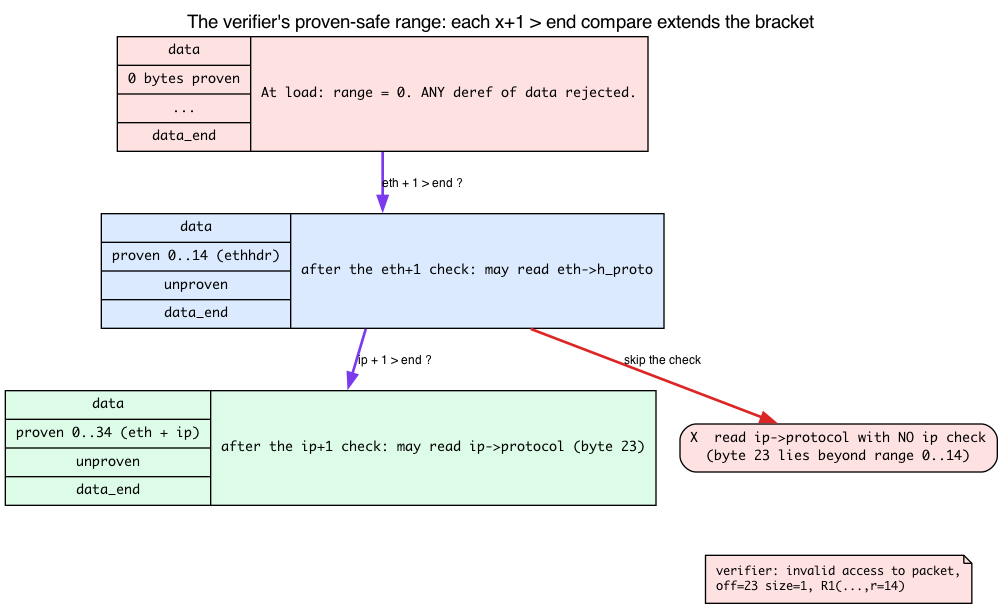
Each layer needs its own check. A compare only extends the proven range up to the pointer being tested. After the eth check, the IP bytes are still unproven — you must re-test ip + 1 > end before touching ip->protocol:
void *data = (void *)(long)ctx->data;
void *end = (void *)(long)ctx->data_end;
struct ethhdr *eth = data;
if (eth + 1 > end)
return XDP_PASS; /* skip — not enough bytes for an Ethernet header */
The pattern repeats for each header layer. ip + 1 > end for IP, tcp + 1 > end for TCP, etc. Skip a layer’s check and the verifier prints invalid access to packet (the verbose() call at kernel/bpf/verifier.c:4433) — which is exactly what Break 1 and Break 4 produce. Bounds checking is not optional, and now you know precisely why: without the compare, the proven range never grows past the last pointer you tested, and the access falls outside it.
XDP actions

Five constants you can return:
XDP_PASS— continue to the kernel stack (allocate skb, hand off).XDP_DROP— free the packet now. Doesn’t touch skb path.XDP_TX— send the (possibly modified) packet back out the same interface. DDoS-mitigation classic.XDP_REDIRECT— paired withbpf_redirect_map(...), send to a different interface, a different CPU (cpumap), or an AF_XDP socket.XDP_ABORTED— error path. Equivalent to DROP plus a tracepoint fires (so you can find bugs).
There are no Dumb Questions
Q: Why isn’t every packet path written as XDP?
A: Because XDP runs before the kernel knows much. There’s no socket lookup, no routing decision, no connection state. For most stacks you want skb-level processing (or higher) to use the kernel’s accumulated knowledge. XDP is for cases where speed beats sophistication: DDoS drop, load balancing, L2/L3 forwarding for known patterns.
Q: Are there modes of XDP?
A: Yes. Native XDP runs in the driver as described — fastest. Generic XDP (
XDP_FLAGS_SKB_MODE) runs much later — up in the stack’s receive path (do_xdp_genericfrom__netif_receive_skb_core), after a fullsk_buffhas already been allocated, wrapping anxdp_buffaround that existing skb. Works on any driver but is slower precisely because you have already paid the skb-allocation cost XDP is meant to skip (roughly half the speed of native). Offloaded XDP runs on the NIC itself for hardware that supports it — in mainline v7.1 that is essentially only the Netronome NFP (Agilio) SmartNIC, the lone non-test driver implementingXDP_SETUP_PROG_HW; the program is JITed to NIC firmware. Mellanox/mlx5 NICs run native driver-mode XDP, not firmware offload. Native is the default and what we’ll use.Q: How do I attach safely without crashing my SSH session?
A: Test on a
vethpair, not your real NIC. We’ll do that in the lab.
Sharpen your pencil
You write an XDP program that counts packets and returns
XDP_PASS. Compared to the same logic written as a tc-bpf ingress program, which is faster?.
.
.Answer: XDP, by roughly the skb-build cost (hundreds of ns) per packet. The tc-bpf path runs after skb allocation; XDP runs before. For pure observability that doesn’t modify the packet, XDP wins. For complex forwarding decisions that benefit from skb metadata, tc may be the right choice — Day 17.
The lab
Setup: a veth pair to play with — and why the namespace matters
Before the script, two concepts you’ve never met (13 days of tracing never ran ip netns):
A veth (virtual Ethernet) device is always created as a connected pair. Think of it as a patch cable: a frame transmitted on veth0 appears on the RX path of veth1, and vice-versa. That RX path is what runs the XDP hook — which is the whole reason veth is the safe place to test XDP. (On v7.1 the veth driver runs XDP through the standard bpf_prog_run_xdp entry at drivers/net/veth.c:657/:819 — the same inline a physical NIC uses, so what you test here behaves like the real thing.)
A network namespace is an isolated copy of the kernel’s entire network stack — its own interfaces, routing table, and addresses. Moving veth1 into ns1 puts the two ends of the cable in different stacks. ip netns exec ns1 <cmd> runs a command inside that namespace, which is why we’ll launch the loader with ip netns exec ns1 ./xdp_count veth1. veth is a faithful test bed for XDP program semantics (identical data/data_end, actions, and verifier behavior) — though note that on veth the peer already received an sk_buff, which veth_convert_skb_to_xdp_buff wraps into an xdp_buff before XDP runs, so the veth lab is not where you measure the native-NIC skb-allocation savings.
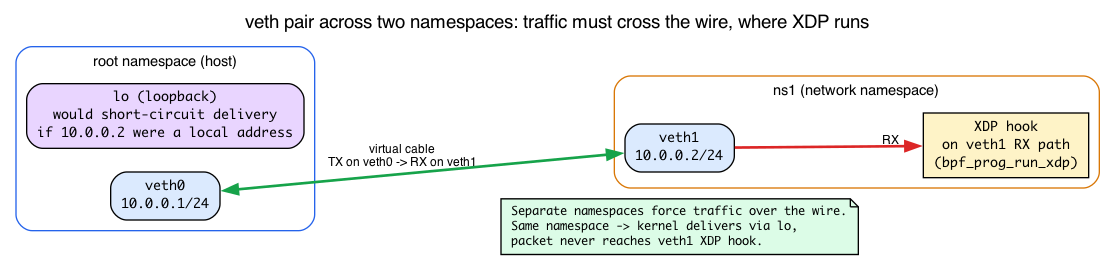
sudo ip netns add ns1
sudo ip link add veth0 type veth peer name veth1
sudo ip link set veth1 netns ns1
sudo ip addr add 10.0.0.1/24 dev veth0
sudo ip link set veth0 up
sudo ip netns exec ns1 ip addr add 10.0.0.2/24 dev veth1
sudo ip netns exec ns1 ip link set veth1 up
veth1 lives in its own namespace, ns1, and this matters: if both ends shared the root namespace, 10.0.0.2 would be a local address, and the kernel would short-circuit ping 10.0.0.2 through lo — the packet would never leave veth0, and XDP on veth1 would never fire. Putting veth1 in ns1 forces traffic to cross the wire. We attach our program to veth1 inside ns1; pinging 10.0.0.2 from the host sends echo requests out veth0, across the link into veth1’s RX path, where XDP runs.
xdp_count.bpf.c
Included from the source the lab build and CI compile:
#include “vmlinux.h” #include <bpf/bpf_helpers.h> #include <bpf/bpf_endian.h>
/* vmlinux.h carries kernel types and enums but not UAPI #define macros like
- ETH_P_IP, and <linux/if_ether.h> can’t be mixed with vmlinux.h (it
- redefines struct ethhdr). So define the one EtherType we compare against
- locally, the way the kernel’s own BPF selftests do. */ #define ETH_P_IP 0x0800
char LICENSE[] SEC(“license”) = “GPL”;
struct { __uint(type, BPF_MAP_TYPE_PERCPU_ARRAY); __uint(max_entries, 256); /* indexed by IP protocol number */ __type(key, __u32); __type(value, __u64); } counts SEC(“.maps”);
SEC(“xdp”) int xdp_count(struct xdp_md *ctx) { void *data = (void *)(long)ctx->data; void *end = (void *)(long)ctx->data_end;
struct ethhdr *eth = data;
if (eth + 1 > end)
return XDP_PASS;
if (eth->h_proto != bpf_htons(ETH_P_IP))
return XDP_PASS;
struct iphdr *ip = (void *)(eth + 1);
if (ip + 1 > end)
return XDP_PASS;
__u32 key = ip->protocol; /* TCP=6, UDP=17, ICMP=1 */
__u64 *c = bpf_map_lookup_elem(&counts, &key);
if (c)
(*c)++; /* per-CPU; no atomic needed */
return XDP_PASS;
}
What’s new — and you now have the background for every line:
SEC("xdp")— XDP attach. Userspace specifies the interface.#include <bpf/bpf_endian.h>— forbpf_htons. Theh_protocompare swaps the host constantETH_P_IPto wire order;ip->protocolis one byte, so it’s read raw. (See “Network byte order” above.)- The two
eth + 1 > end/ip + 1 > endlines are the proven-range idiom from thedata/data_endsection — each extends the verified window by one header so the next field read is legal. - The casts
(void *)(eth + 1)/ pastipwalk the byte layout: 14 bytes to the IP header, then into L4. (See “A packet is just bytes” above.) BPF_MAP_TYPE_PERCPU_ARRAY— each CPU gets its own value slot (recall the per-CPU map from Day 2). No atomic needed for increment because no two CPUs share a slot. Userspace must sum across CPUs to get a total.- The bounds check pattern is the XDP idiom. Everyone writes it.
xdp_count.c — userspace
Included from the loader the lab build and CI compile:
#include <errno.h> #include <net/if.h> #include <signal.h> #include <stdio.h> #include <string.h> #include <unistd.h>
#include <bpf/bpf.h> #include <bpf/libbpf.h>
#include “xdp_count.skel.h”
static volatile sig_atomic_t exiting;
static void handle_signal(int signal_number) { (void)signal_number; exiting = 1; }
static int install_signal_handlers(void) { const struct sigaction action = { .sa_handler = handle_signal, };
if (sigaction(SIGINT, &action, NULL) != 0 ||
sigaction(SIGTERM, &action, NULL) != 0) {
fprintf(stderr, "failed to install signal handlers: %s\n",
strerror(errno));
return -errno;
}
return 0;
}
int main(int argc, char **argv) { struct xdp_count_bpf *skel = NULL; struct bpf_link *link = NULL; unsigned int ifindex; int ncpu; int err;
setvbuf(stdout, NULL, _IOLBF, 0);
if (argc < 2) {
fprintf(stderr, "usage: %s <iface>\n", argv[0]);
return 1;
}
ifindex = if_nametoindex(argv[1]);
if (!ifindex) {
fprintf(stderr, "if_nametoindex(%s): %s\n", argv[1], strerror(errno));
return 1;
}
err = install_signal_handlers();
if (err)
return 1;
skel = xdp_count_bpf__open_and_load();
if (!skel) {
fprintf(stderr, "failed to open and load xdp_count BPF skeleton\n");
return 1;
}
link = bpf_program__attach_xdp(skel->progs.xdp_count, ifindex);
if (!link) {
err = -errno;
fprintf(stderr, "failed to attach XDP program to ifindex %u: %s\n",
ifindex, strerror(errno));
goto cleanup;
}
ncpu = libbpf_num_possible_cpus();
if (ncpu <= 0) {
fprintf(stderr, "libbpf_num_possible_cpus failed\n");
err = 1;
goto cleanup;
}
printf("Counting packets per IP protocol on %s; press Ctrl-C to stop.\n",
argv[1]);
while (!exiting) {
int fd;
if (sleep(2) != 0)
continue;
fd = bpf_map__fd(skel->maps.counts);
for (__u32 k = 0; k < 256; k++) {
__u64 vals[ncpu];
if (bpf_map_lookup_elem(fd, &k, vals) == 0) {
__u64 sum = 0;
for (int i = 0; i < ncpu; i++)
sum += vals[i];
if (sum)
printf("proto %3u: %llu\n", k, sum);
}
}
printf("---\n");
}
err = 0;
cleanup: bpf_link__destroy(link); xdp_count_bpf__destroy(skel); return err != 0; }
Run
make
sudo ip netns exec ns1 ./xdp_count veth1 &
# From the host (root namespace):
ping -c 5 10.0.0.2
nc -u 10.0.0.2 9999 <<< "hello"
Expected output every 2 seconds:
proto 1: 5 # ICMP
proto 17: 1 # UDP
---
You’re now counting every packet that hits veth1. Now redirect this same program at a real NIC (eno1 or whatever) and you’ve got line-rate counters with effectively zero overhead.
Cleanup
sudo kill %1 # stop the loader; closing its bpf_link fd auto-detaches the XDP program
sudo ip link del veth0 # deletes the pair (veth1 goes with it)
sudo ip netns del ns1 # remove the namespace
The XDP program stays attached only as long as the loader runs — the link is never pinned, so bpf_link__destroy (or simply the process exiting) detaches it. If you stopped the loader some other way and the program is still attached, detach it explicitly with sudo ip netns exec ns1 ip link set dev veth1 xdp off.
What to break, in order
Break 1 — Drop the bounds check
struct iphdr *ip = (void *)(eth + 1);
__u32 key = ip->protocol; /* no bounds check */
Verifier rejects at load time. libbpf prints the log to stderr when xdp_count_bpf__open_and_load() fails (the if (!skel) return 1; path — the userspace program prints nothing of its own):
invalid access to packet, off=23 size=1, R1(id=N,off=23,r=14)
off=23 because protocol sits 9 bytes into the IP header and the IP header starts 14 bytes (one Ethernet header) into the frame; only those first 14 bytes were bounds-checked (r=14). The Verifier’s per-byte tracking doesn’t know the byte at eth+1+offsetof(protocol) is reachable. The exact wording and offsets are kernel- and clang-version dependent.
(This is the data/data_end proven-range model made concrete: the eth + 1 > end check extended the range to 14, you then deleted the ip + 1 > end check, so the range never reached byte 23 — and the access falls outside the bracket.)
Break 2 — Pre-bound the index, then atomic
Switch from per-CPU to a regular hash:
__uint(type, BPF_MAP_TYPE_HASH);
A PERCPU_ARRAY pre-allocates all 256 indices, so bpf_map_lookup_elem(&counts, &key) always returns a (zeroed) slot. A HASH map starts empty — the lookup returns NULL for every protocol it hasn’t seen yet, so if (c) ... never fires and the counter stays at zero. You have to create the entry on first sight, and because a shared (not per-CPU) map can be touched by several CPUs at once, the increment now needs an atomic:
__u64 *c = bpf_map_lookup_elem(&counts, &key);
if (c) {
__sync_fetch_and_add(c, 1); /* shared map: atomic now required */
} else {
__u64 one = 1;
bpf_map_update_elem(&counts, &key, &one, BPF_NOEXIST); /* create on first sight */
}
(The first concurrent update for a brand-new key can still race on a non-preallocated hash; BPF_NOEXIST plus the atomic add on the existing-entry path is the standard mitigation.)
The throughput lesson — a shared hash contends on a per-bucket lock where the per-CPU array does not — is not observable on this veth: a 5-packet ping over a single-queue virtual link generates no contention. To see it you need a real multi-queue NIC and parallel load that spreads RX across CPUs (e.g. iperf3 -u -P 16 to a peer, or pktgen across queues), then sudo perf top -e cycles -g. With the hash you’ll see time in queued_spin_lock_slowpath/_raw_spin_lock under htab_map_update_elem/bpf_map_lookup_elem; with the per-CPU array those frames are absent. (Note: the hardware cycles event needs a real PMU — bare metal or a PMU-enabled host. Many cloud VMs expose no hardware PMU and -e cycles errors out; fall back to the software event sudo perf top -e task-clock -g, and expect the lock-contention frames to be clearest on physical hardware.)
Break 3 — Return XDP_DROP instead of XDP_PASS
Change the return to XDP_DROP, then rebuild and re-attach — editing the program does nothing until you reload it:
make
sudo ip netns exec ns1 ./xdp_count veth1 &
ping -c 5 10.0.0.2
The ping now reports 100% packet loss (0 received): the echo requests cross the wire, hit veth1’s RX inside ns1, and XDP drops them before they reach the IP stack, so no replies come back. SSH into your box still works (it’s on a different interface). Lesson: XDP is the literal first hop. Be careful which iface you attach to. (This break is invisible without the namespace separation from the setup above — a same-namespace 10.0.0.2 is delivered locally over lo and never reaches veth1’s XDP hook.)
Break 4 — Forget a per-layer bounds check
struct iphdr *ip = (void *)(eth + 1);
if (ip + 1 > end) return XDP_PASS;
struct tcphdr *tcp = (void *)(ip + 1);
if (tcp + 1 > end) return XDP_PASS;
__u16 dport = tcp->dest;
As written this compiles and loads — every layer is bounds-checked. Now delete the if (tcp + 1 > end) return XDP_PASS; line and rebuild. The Verifier rejects the load with the same invalid access to packet error, this time pointing at the tcp->dest read: each header layer needs its own check, and Break 1’s lesson generalizes from one header to a multi-layer chain. (And note tcp->dest is a __be16 port — if you wanted to print it you’d wrap it in bpf_ntohs, just like the h_proto compare wrapped ETH_P_IP.)
What to read in the kernel
include/net/xdp.h—bpf_prog_run_xdp, the inline that drivers call to run an XDP program.include/uapi/linux/bpf.h—struct xdp_mdandenum xdp_action(the action constants).net/core/dev.c— searchxdp_buff; the driver-side dispatch path.net/core/filter.c— XDP helpers (xdp_func_prototable). Note which helpers are XDP-only.tools/testing/selftests/bpf/progs/test_xdp_*— many examples of common patterns.Documentation/networking/af_xdp.rst— the AF_XDP socket family (Day 18). Upstream has no top-levelxdp.rstat v7.1; for general XDP background lean on theDocumentation/bpf/BPF docs.Documentation/networking/xdp-rx-metadata.rst— XDP RX metadata (hints the driver can hand to your program).
Bullet Points
- XDP runs in the driver’s NAPI poll, before skb allocation. Fastest place to drop, redirect, or count. (Skips the
sk_buffbuild cost — the two-allocation descriptor+data model from linux-net Day 1.) - A packet is a flat byte buffer:
[ethhdr 14B][iphdr ≥20B][L4].eth->h_proto == ETH_P_IP(0x0800) selects IPv4;ip->protocol(byte 9 of the IP header, frame offset 23) is ICMP=1/TCP=6/UDP=17.(eth+1)/(ip+1)step exactly one header. - Network byte order is big-endian. Wrap multi-byte constants in
bpf_htons(and read wire values withbpf_ntohs); a 1-byte field likeip->protocolneeds no swap. struct xdp_md:data,data_end,ingress_ifindex,rx_queue_index,data_meta,egress_ifindex.- Bounds checks are mandatory:
data/data_endare runtime packet pointers; ax + 1 > endcompare extends the verifier’s proven-safe range. Each header layer needs its own check before you read its fields. - Actions: PASS, DROP, TX, REDIRECT, ABORTED.
BPF_MAP_TYPE_PERCPU_ARRAYfor hot-path counters — no contention, sum in userspace.- A
vethpair is a virtual cable (TX on one end → RX on the other, where XDP runs); a network namespace is an isolated stack. Both ends in separate namespaces forces traffic across the wire instead of short-circuiting throughlo. - Test with
vethpairs before attaching to real interfaces.
Check question
You attach an XDP program that always returns XDP_PASS. Why might it still affect performance compared to no program at all?
Click to reveal answer
Answer: Two reasons. (1) Native XDP requires the driver to call into the BPF program for every packet — that’s a function call (~10-30 ns) plus your logic. Even an empty program has measurable cost at line rate. (2) Some drivers disable certain optimizations (large receive offload, GRO) when XDP is attached, because XDP needs to see one packet at a time, not coalesced bursts. So even a passthrough XDP can reduce throughput by ~10% on workloads dependent on those features. For tracing/observability, this is fine; just be aware before deploying on a production load-balancer NIC.
Tomorrow
Day 15: turn the counter into a denylist with BPF_MAP_TYPE_LPM_TRIE and userspace-controlled rules. Drop traffic from specific CIDRs at line rate.
Day 15 — XDP firewall: drop CIDRs at line rate
Today’s mission: turn yesterday’s counter into a userspace-controlled denylist that drops traffic from configurable IPv4 prefixes. Along the way, learn three things the lab quietly depends on: how a BPF map can outlive and be shared beyond the process that created it (pinning + bpffs), the exact byte layout the kernel demands of an LPM key and why, and what the trie actually allocates under the hood so the per-entry memory cost (a leaf node plus manufactured branch nodes) stops being a hand-wave. Total time: ~110 minutes.
The wrong way and the right way
To drop traffic from 10.1.2.0/24, you could shove all 256 IPs into a hash map (the BPF_MAP_TYPE_HASH from Day 2). That works but doesn’t scale to 10.0.0.0/8 (16 million entries) and definitely doesn’t scale to IPv6 (…you’re not enumerating /64 prefixes).
You want prefix matching. The map type for that is BPF_MAP_TYPE_LPM_TRIE.
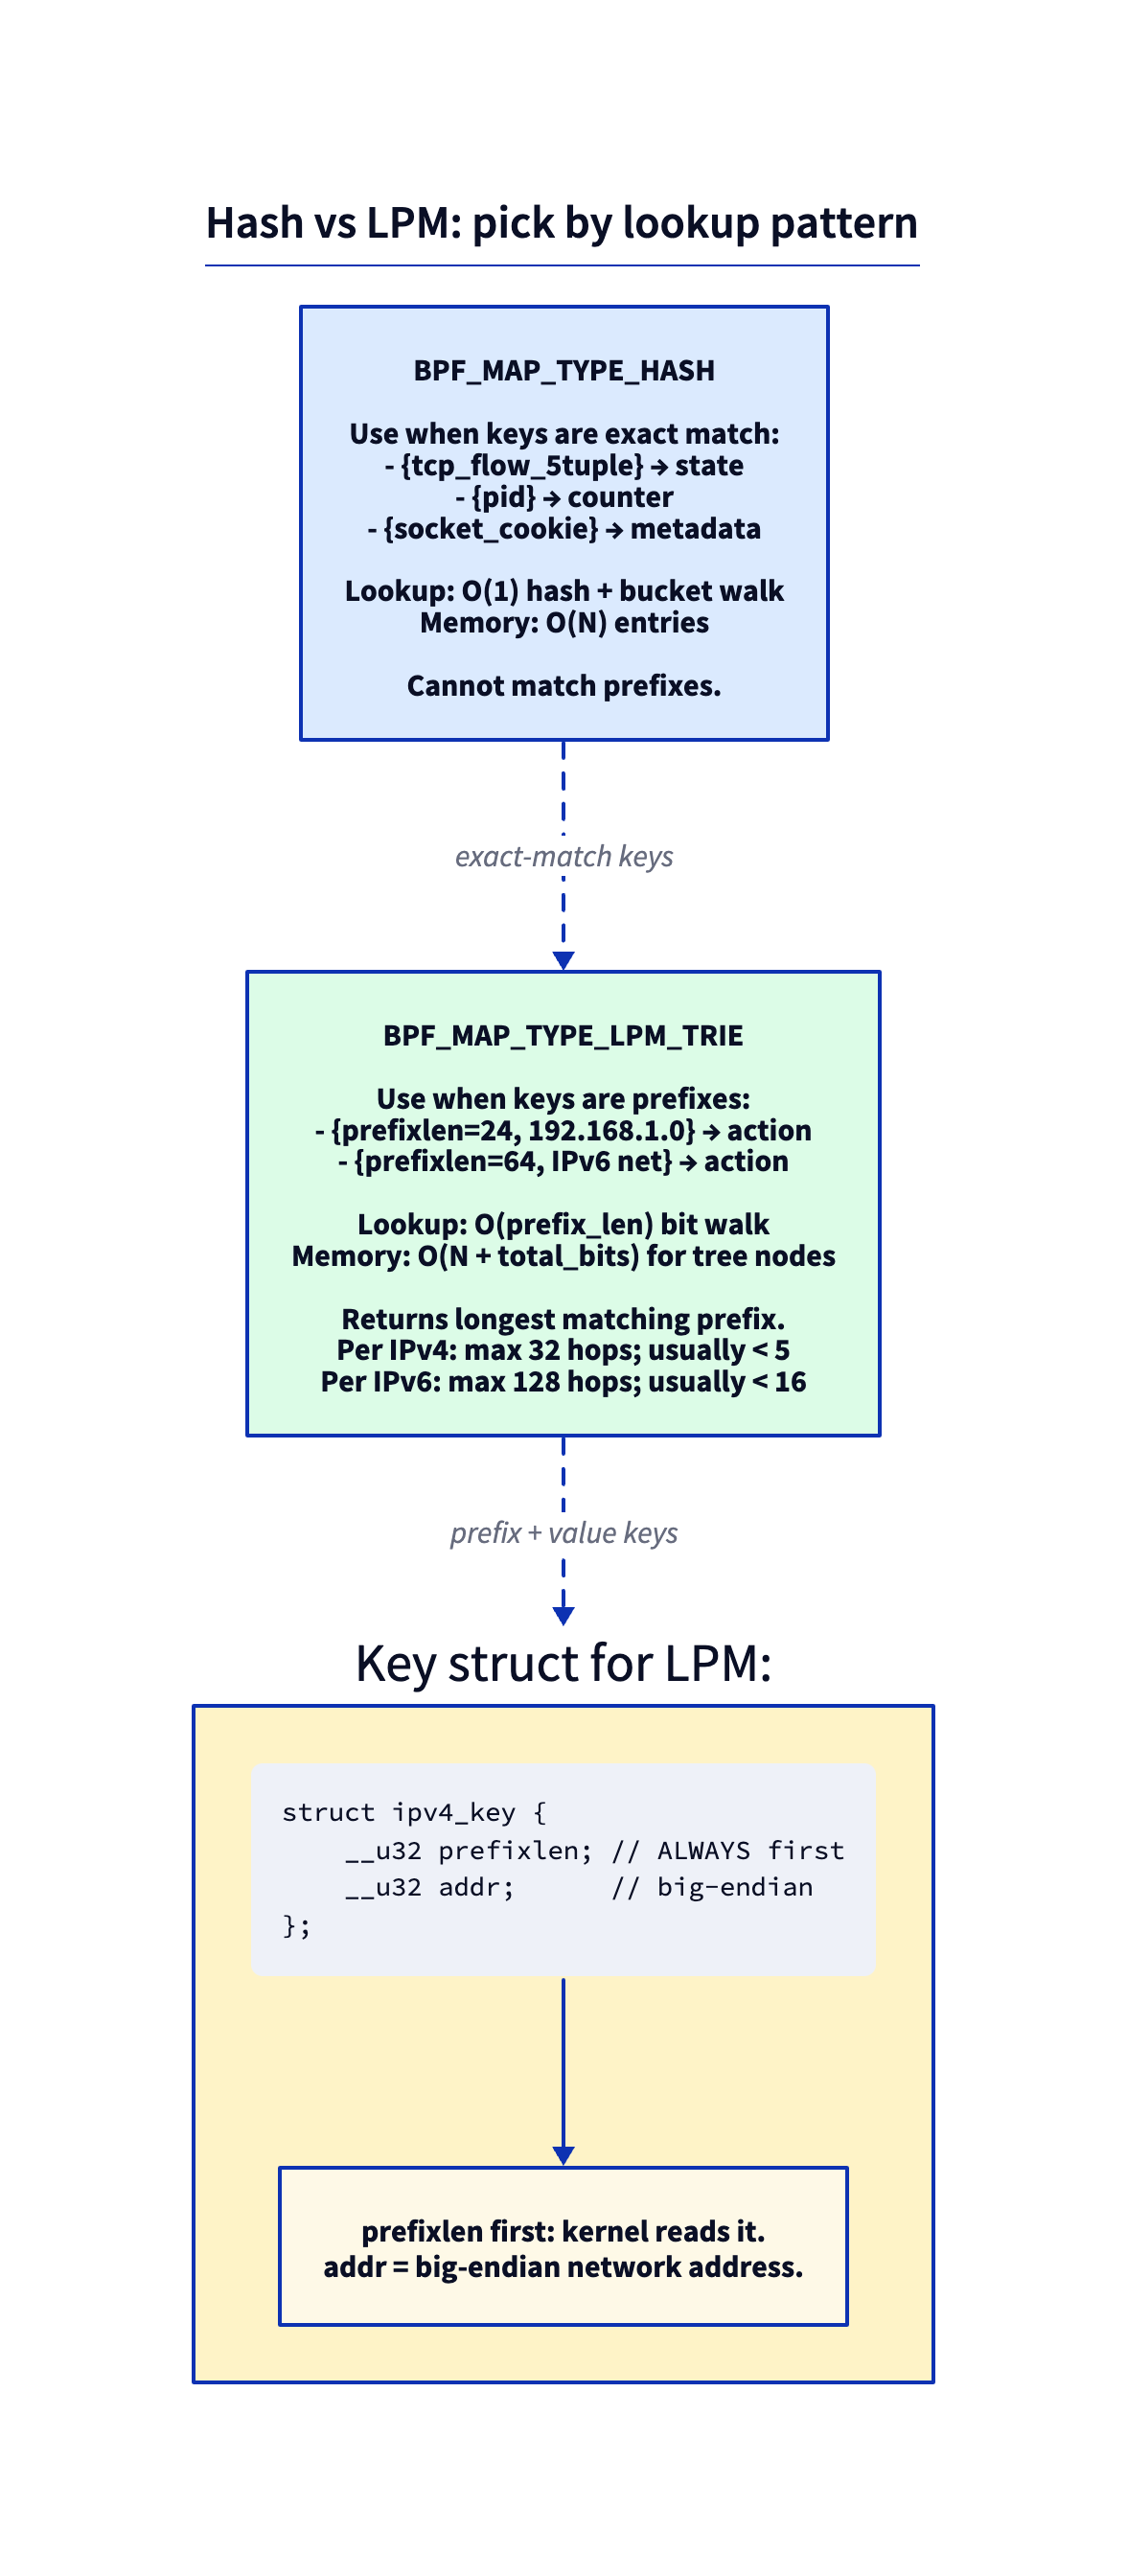
The LPM trie
A bit-by-bit prefix tree. Insert 10.0.0.0/8, then 10.1.0.0/16, then 10.1.2.0/24, and the trie holds them at the right depths.
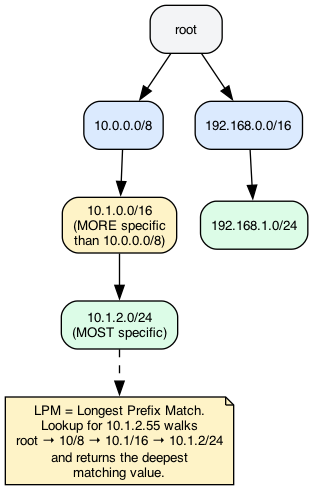
A lookup with key 10.1.2.55 walks:
- Root.
- Match the first 8 bits (10.x.x.x) →
10.0.0.0/8node. - Match next 8 bits (10.1.x.x) →
10.1.0.0/16node. - Match next 8 bits (10.1.2.x) →
10.1.2.0/24node. - No deeper match → return value at
10.1.2.0/24.
That’s Longest Prefix Match (LPM) — the same algorithm IP routing uses. Lookup cost is O(prefix length): max 32 hops for IPv4, ~128 for IPv6, but in practice much less.
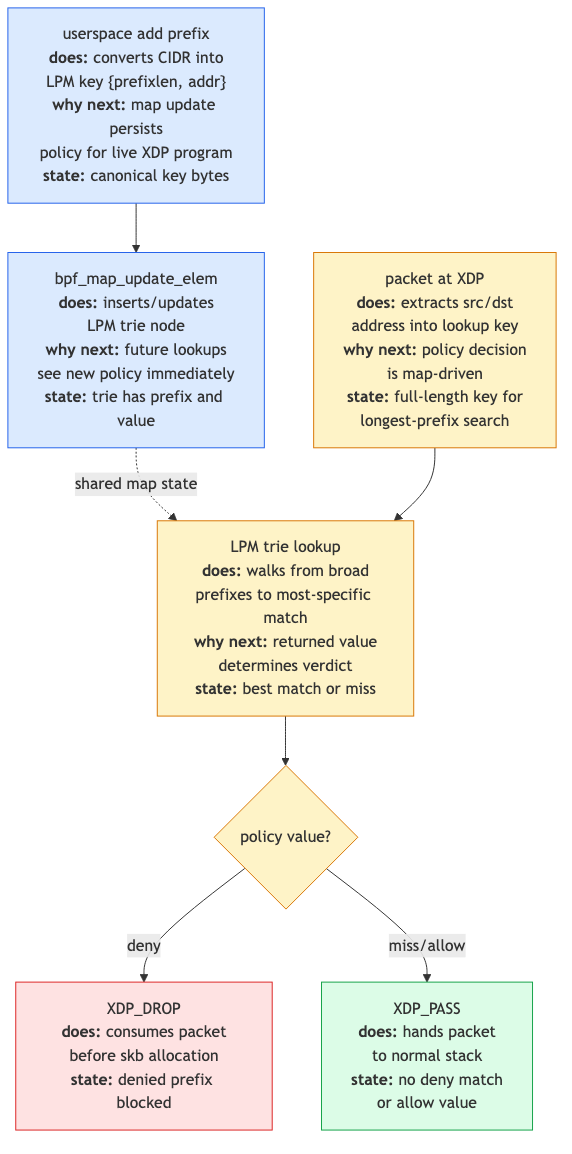
What’s actually in the tree: intermediate nodes
That clean root→/8→/16→/24 walk is a simplification, and the simplification is exactly what hides the trie’s real memory cost. Here is the part no tutorial shows you.
Suppose you store two prefixes that diverge mid-byte — say 10.1.0.0/16 and 10.2.0.0/16. In binary, 10.1 and 10.2 agree for the first 14 bits and split at bit 14. There is no stored prefix at that 14-bit branch point, but the tree still needs a fork there. So the kernel manufactures one: an intermediate (IM) node at the divergence point, with the two real /16 leaves as its children.
/* kernel/bpf/lpm_trie.c:22 */
#define LPM_TREE_NODE_FLAG_IM BIT(0)
The IM node is a genuine allocation — it occupies kernel memory — but it holds no user value. It exists purely to give the two real prefixes a common parent. That is the “multiple internal nodes per leaf” the Dumb-Question answer cites, and it’s why each stored prefix costs more than just sizeof(value): the kernel allocates every node — leaf or branch — at leaf_size = sizeof(struct lpm_trie_node) + data_size + value_size (kernel/bpf/lpm_trie.c:601-602). The header (struct lpm_trie_node) is child[2] (16 bytes) + prefixlen (4) + flags (4) = 24 bytes, so for this lab’s IPv4 map (data_size=4, value_size=4) a node is 24+4+4 = 32 bytes. You pay for the leaf and each branch node that routes to it — tens of bytes per stored prefix, not hundreds. trie_update_elem allocates the IM node at the split point:
/* kernel/bpf/lpm_trie.c:423-444 — insert a branch node at the divergence point */
im_node = lpm_trie_node_alloc(trie, NULL);
...
im_node->prefixlen = matchlen;
im_node->flags |= LPM_TREE_NODE_FLAG_IM; /* no value; pure branch */
...
rcu_assign_pointer(*slot, im_node);
Two consequences make this worth knowing:
-
Lookup skips IM nodes as match candidates. The walk descends through an IM node but only “remembers” it as a result if it is a real node. The source records the found node only when the IM flag is clear:
/* kernel/bpf/lpm_trie.c:271-275, inside trie_lookup_elem */ /* Consider this node as return candidate unless it is an * artificially added intermediate one. */ if (!(node->flags & LPM_TREE_NODE_FLAG_IM)) found = node;So “longest prefix match” is literally “the last non-intermediate node the walk passed through.” That’s the mechanism behind the hand-wavy walk above.
-
IM nodes get promoted, not leaked. If you later insert a prefix exactly at an IM node’s branch point, that branch position becomes a real node instead of leaking. The mechanics are copy-and-replace, not in-place flag-clearing:
trie_update_elemalways allocates a freshnew_nodeup front (lpm_trie.c:341), and when the update lands on an existing IM node (node->prefixlen == matchlenwith the IM flag still set), the new real node inherits the IM node’s two children, is swapped into the slot viarcu_assign_pointer, and the old IM node is then freed (lpm_trie.c:387-406). So the kernel doesn’t keep the same node object and clear its flag — it replaces the node while reusing its place in the tree. The source comment uses a192.168.0.0/23example and calls this “turned into a ‘real’ node on demand” / the IM node being “re-used” (lpm_trie.c:142), where “re-used” means the branch point, not the allocation.
The lookup also has two early exits worth one sentence, because they’re what make the O(prefix_len) cost concrete. If a node matches the full key width it returns immediately (exact match), and if fewer bits match than the node’s own prefix length, it stops and returns the last real node seen:
/* kernel/bpf/lpm_trie.c:259-262 — exact match: stop now */
if (matchlen == trie->max_prefixlen) {
found = node;
break;
}
/* ... matchlen < node->prefixlen ⇒ bail, return last seen */
One last detail that ties back to byte order: the walk reads the key MSB-first — bit 0 is the top bit of byte 0.
/* kernel/bpf/lpm_trie.c:154 */
static inline int extract_bit(const u8 *data, size_t index)
{
return !!(data[index / 8] & (1 << (7 - (index % 8))));
}
That is why the address must be stored in network (big-endian) byte order: the trie walks bits from the wire’s most-significant end, so the bytes have to be in wire order for “the first 8 bits” to actually mean “the first octet.”
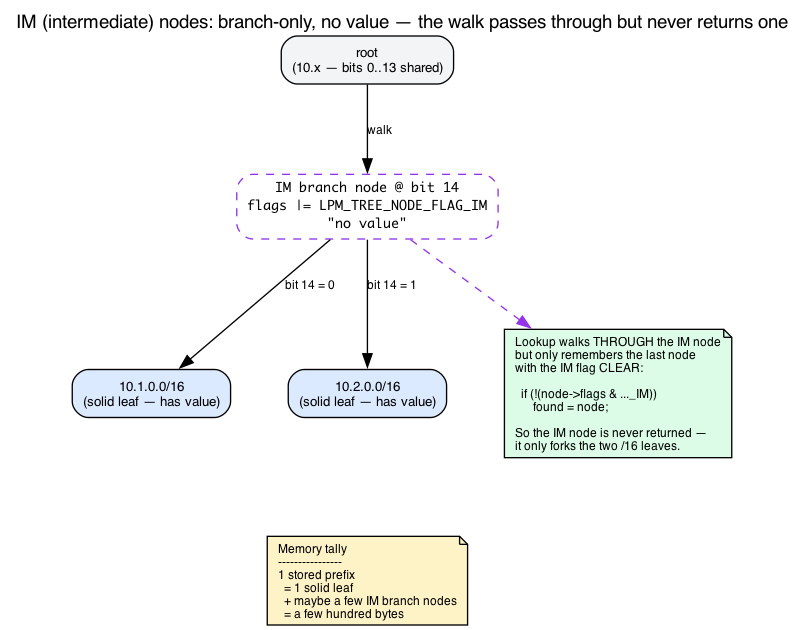
The key struct: what the kernel really demands, and why
LPM trie keys must start with a prefixlen field, then the address bytes:
struct ipv4_lpm_key {
__u32 prefixlen; /* always first */
__u32 addr; /* network byte order */
};
That’s the convention every example repeats. But it’s not arbitrary — your hand-rolled struct is mirroring a real UAPI type, and the kernel enforces the layout with a compile-time assertion. The canonical key is:
/* include/uapi/linux/bpf.h:103-109 */
struct bpf_lpm_trie_key_u8 {
union {
struct bpf_lpm_trie_key_hdr hdr;
__u32 prefixlen;
};
__u8 data[]; /* Arbitrary size */
};
(data[] is the address bytes.) A 4-byte prefixlen header followed by a flexible array of address bytes. Your { prefixlen; addr; } is exactly that header plus a 4-byte data[] payload. Three facts fall out of this struct, and each grounds a rule the chapter otherwise asks you to memorize:
-
prefixlenmust be first, and the address must be u32-aligned. The kernel doesn’t trust you — itBUILD_BUG_ONs the offset of the data array:/* kernel/bpf/lpm_trie.c:176 */ BUILD_BUG_ON(offsetof(struct bpf_lpm_trie_key_u8, data) % sizeof(u32));The address bytes therefore land at offset 4. That’s not a coincidence you have to remember; it’s a build-time invariant of the layout.
-
The address width is derived, not hard-coded. The kernel computes how many address bytes there are by subtracting the header size from your declared
key_size, then sets the max prefix length to that many bits:/* kernel/bpf/lpm_trie.c:594-596, in trie_alloc */ trie->data_size = attr->key_size - offsetof(struct bpf_lpm_trie_key_u8, data); trie->max_prefixlen = trie->data_size * 8;A 4-byte
addr⇒data_size = 4⇒max_prefixlen = 32. Enlarge the struct to hold a 16-bytein6_addr⇒data_size = 16⇒max_prefixlen = 128. This is the whole reason the IPv6 variant in Break 4 “just works” by growing the struct — you’re not configuring anything, you’re feeding the kernel a biggerkey_sizeand it does the arithmetic. -
The lookup key uses
prefixlen = 32— “this is an exact host address; match it against any stored prefix.” The kernel rejects a key whoseprefixlenexceeds the trie’s max up front:/* kernel/bpf/lpm_trie.c:244-245, in trie_lookup_elem */ if (key->prefixlen > trie->max_prefixlen) return NULL;
So { .prefixlen = 16, .addr = 0x0a010000 } means “10.1.0.0/16” — only the top 16 bits of addr matter — and { .prefixlen = 32, .addr = <packet saddr> } means “look up this exact source IP and give me the longest stored prefix that covers it.”
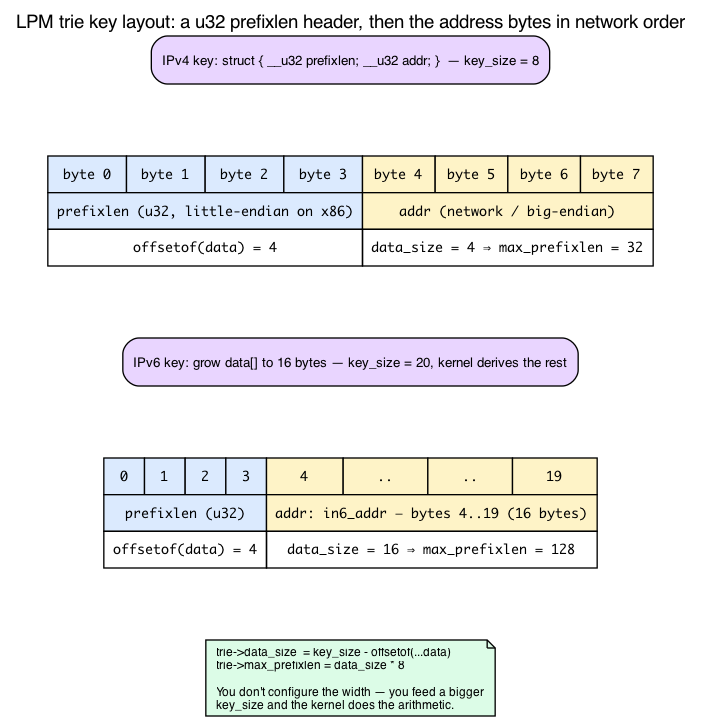
Sharing one trie between two processes: pinning and bpffs
Here is something genuinely new today. Every chapter so far (Days 1–14) loaded a skeleton, kept the map’s file descriptor inside one process, and let everything vanish when that process exited. Day 14’s counter disappears the moment the loader dies. Today’s lab has two separate programs — a loader that attaches the XDP program, and a CLI that mutates the denylist — and they must operate on the same trie. That requires a mechanism we haven’t needed until now: pinning.
A map is a kernel object behind a file descriptor
Recall from Day 2 that userspace never holds a kernel pointer to a map — it holds an integer file descriptor, a handle to a kernel object. The same is true of programs and links. And like any fd-referenced kernel object, a BPF map is reference-counted: the kernel keeps it alive as long as at least one fd refers to it, and frees it when the last fd closes. The UAPI header says so directly:
/* include/uapi/linux/bpf.h:951 */
* An eBPF object is deallocated only after all file descriptors referring
* to the object have been closed and no references remain pinned to the
* filesystem or attached ...
That single sentence explains Day 14: the loader held the only fd, the loader exited, the refcount hit zero, the map was freed. Fine when one process owns everything. Useless when a second, unrelated process needs to reach the same map — two processes cannot hand each other a raw fd.
bpffs: a filesystem where kernel objects get names
The rendezvous mechanism is a special pseudo-filesystem of type bpf, mounted by convention at /sys/fs/bpf (it’s called bpffs). It holds no real files on disk; each directory entry is a name bound to a kernel BPF object. Creating such an entry is called pinning, and the pin holds its own reference to the object — exactly the “no references remain pinned to the filesystem” clause above. So a pinned map survives even when no process has it open. The header spells out the contract:
/* include/uapi/linux/bpf.h:945-949 (paraphrased) */
* File descriptors referring to eBPF objects can be pinned to the
* filesystem using the BPF_OBJ_PIN command of bpf(2).
The flow for two processes is then:
- Process A (the loader) pins the map by path: this creates
$PIN/denyinside a directory the run owns and adds a reference. - Process B (the CLI) calls
bpf_obj_get("$PIN/deny")to obtain its own fd to the same underlying map.
Now both processes — plus the pin itself — hold references. The trie is shared, and it stays alive as long as any of those three references exists.
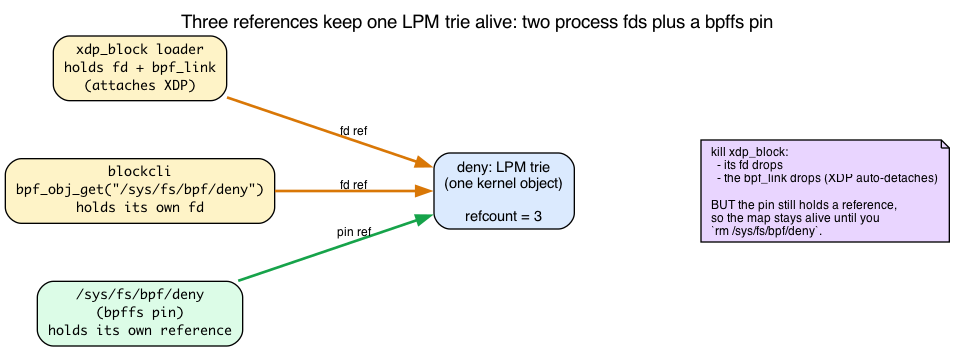
The libbpf entry points
Two layers do the same job:
- High-level, from the skeleton:
bpf_map__pin(map, path)— what the loader calls (tools/lib/bpf/libbpf.c:9150). - Low-level, by fd/path:
bpf_obj_pin(fd, path)(tools/lib/bpf/bpf.c:604) andbpf_obj_get(path)(tools/lib/bpf/bpf.c:609).
Both wrap the same two bpf() syscall commands, BPF_OBJ_PIN and BPF_OBJ_GET (include/uapi/linux/bpf.h:962-963). The CLI never opens a skeleton and never attaches anything — it just calls bpf_obj_get to grab an fd and then issues the ordinary bpf_map_update_elem / bpf_map_delete_elem syscalls from Day 2.
Pin the map, not the program — and the cleanup gotcha
Notice the loader pins the map, not the program. The XDP program stays attached because the loader holds its bpf_link open (via pause() — that’s the whole reason the loader parks). Only the trie needs to be shared, so only the trie is pinned.
The consequence is a cleanup gotcha. Killing the loader drops its bpf_link, which auto-detaches the XDP program — good, the firewall stops filtering. But the pinned map node in bpffs is a separate reference; it lingers until you explicitly rm it:
sudo rm "$PIN/deny" "$PIN/stats" && sudo rmdir "$PIN"
Forget that, and a stale deny trie sits in bpffs holding kernel memory, and the next bpf_map__pin to the same path fails with EEXIST.
There are no Dumb Questions
Q: Can I update the LPM trie while the XDP program is running?
A: Yes. Recall from Day 2 that map reads are RCU-protected — lookups take no lock and elements are RCU-freed, so a returned pointer can’t be freed under you. The LPM trie walks its nodes under
rcu_dereference_check(...)withrcu_read_lock_bh_held()(kernel/bpf/lpm_trie.c:249, :282), so an XDP lookup sees a consistent tree even whileblockcliis mutating it. Updates are atomic at the per-key level. Hot-path-friendly.Q: What’s the lookup cost vs hash?
A: For exact-match keys, hash is faster (O(1)). For prefixes, hash can’t do the job. LPM trie lookup is O(prefix_len) but the per-bit cost is low; on a 5-level trie a lookup is ~30 ns vs ~10 ns for a hash hit. In a wire-rate context that’s noticeable but not crippling.
Q: How many entries can the trie hold?
A: Capped by
max_entries. Each entry costs ~32 bytes for an IPv4 leaf (24-byte node header + 4-byte addr + 4-byte value,lpm_trie.c:601-602) plus ~32 bytes for each intermediate branch node the kernel had to manufacture to route to it (the IM nodes from “What’s actually in the tree”) — and now you know why. So 1M IPv4 entries is tens of MB; 10M is only a few hundred MB. (IPv6 with a large value is bigger per node, but still tens of bytes, not hundreds.)Q: IPv6?
A: Same map type, key struct grows:
{ prefixlen, struct in6_addr addr; }. You don’t configure anything — the kernel derives the address width fromkey_size(see “The key struct”). Treat each 32-bit chunk in network byte order.
End-to-end flow
You manage the denylist from userspace via bpf_map_update_elem calls (the Day 2 userspace function — fills a union bpf_attr, issues a bpf() syscall). The XDP program does a single LPM lookup per packet and drops on match.
The lab
block.bpf.c
The BPF program and the blockcli CLI share the LPM key layout through one
header:
#ifndef PRACTICAL_EBPF_BLOCK_H #define PRACTICAL_EBPF_BLOCK_H
/* Shared between the BPF program (block.bpf.c) and the CLI (blockcli.c) so
- both sides agree on the LPM key layout: prefixlen first, then the address
- bytes in network byte order. */ struct ipv4_lpm_key { unsigned int prefixlen; unsigned int addr; };
#endif
and the program is included from the compiled source:
#include “vmlinux.h” #include <bpf/bpf_helpers.h> #include <bpf/bpf_endian.h>
#include “block.h”
/* ETH_P_IP is a UAPI #define, not a BTF enum, so it is absent from vmlinux.h
- and <linux/if_ether.h> cannot be mixed with vmlinux.h. Define it locally. */ #define ETH_P_IP 0x0800
char LICENSE[] SEC(“license”) = “GPL”;
struct { __uint(type, BPF_MAP_TYPE_LPM_TRIE); __uint(max_entries, 1024); __type(key, struct ipv4_lpm_key); __type(value, __u32); /* arbitrary value; we just check existence / __uint(map_flags, BPF_F_NO_PREALLOC); / required for LPM */ } deny SEC(“.maps”);
struct { __uint(type, BPF_MAP_TYPE_PERCPU_ARRAY); __uint(max_entries, 2); /* [0] = pass, [1] = drop */ __type(key, __u32); __type(value, __u64); } stats SEC(“.maps”);
static __always_inline void bump(__u32 idx) { __u64 *c = bpf_map_lookup_elem(&stats, &idx); if (c) (*c)++; }
SEC(“xdp”) int xdp_block(struct xdp_md *ctx) { void *data = (void *)(long)ctx->data; void *end = (void *)(long)ctx->data_end;
struct ethhdr *eth = data;
if (eth + 1 > end)
goto pass;
if (eth->h_proto != bpf_htons(ETH_P_IP))
goto pass;
struct iphdr *ip = (void *)(eth + 1);
if (ip + 1 > end)
goto pass;
struct ipv4_lpm_key k = { .prefixlen = 32, .addr = ip->saddr };
if (bpf_map_lookup_elem(&deny, &k)) {
bump(1);
return XDP_DROP;
}
pass: bump(0); return XDP_PASS; }
What’s new (and where it’s grounded):
BPF_F_NO_PREALLOCis required for LPM. Hash maps preallocate by default for fast updates; the trie is a dynamic tree and the kernel rejects its absence at create time. The flag is value(1U << 0)(include/uapi/linux/bpf.h:1402), andtrie_allocreturns-EINVALunless it’s set —!(attr->map_flags & BPF_F_NO_PREALLOC)is right there in the sanity check (kernel/bpf/lpm_trie.c:579). Try removing the flag (Break 1) and you’ll hit that exact line.- The key passed to lookup uses
prefixlen=32— you’re asking “match this exact IP against any prefix in the trie.” The address comes straight fromip->saddr, which is already in network byte order on the wire — exactly the order the MSB-firstextract_bitwalk needs (see “What’s actually in the tree”). - Two-stage drop accounting: indices 0 and 1 in a percpu array hold pass/drop counters — the
PERCPU_ARRAY+ sum-across-CPUs pattern from Day 14 / Day 2.
blockcli.c — userspace CLI
/* Day 15 — CLI for maps owned by a running block loader. *
- blockcli PIN_DIRECTORY add 10.1.0.0/16
- blockcli PIN_DIRECTORY del 10.1.0.0/16
- blockcli PIN_DIRECTORY stats */ #include <arpa/inet.h> #include <errno.h> #include <limits.h> #include <stdio.h> #include <stdlib.h> #include <string.h> #include <unistd.h>
#include <bpf/bpf.h> #include <bpf/libbpf.h>
#include “block.h”
static char deny_pin[PATH_MAX]; static char stats_pin[PATH_MAX];
static int set_pin_paths(const char *directory) { if (snprintf(deny_pin, sizeof(deny_pin), “%s/deny”, directory) >= (int)sizeof(deny_pin) || snprintf(stats_pin, sizeof(stats_pin), “%s/stats”, directory) >= (int)sizeof(stats_pin)) return -1; return 0; }
static int parse_cidr(const char *text, struct ipv4_lpm_key *out) { char buffer[64]; char *slash; char *end; struct in_addr address; long prefixlen;
if (snprintf(buffer, sizeof(buffer), "%s", text) >= (int)sizeof(buffer))
return -1;
slash = strchr(buffer, '/');
if (!slash)
return -1;
*slash = '\0';
errno = 0;
prefixlen = strtol(slash + 1, &end, 10);
if (errno || *end != '\0' || prefixlen < 0 || prefixlen > 32)
return -1;
if (inet_pton(AF_INET, buffer, &address) != 1)
return -1;
out->prefixlen = (__u32)prefixlen;
out->addr = address.s_addr;
return 0;
}
static int do_add(const char *cidr) { struct ipv4_lpm_key key = {}; __u32 value = 1; int fd; int err = 0;
if (parse_cidr(cidr, &key)) {
fprintf(stderr, "bad CIDR: %s\n", cidr);
return 1;
}
fd = bpf_obj_get(deny_pin);
if (fd < 0) {
fprintf(stderr, "open %s: %s (is block running?)\n", deny_pin,
strerror(errno));
return 1;
}
if (bpf_map_update_elem(fd, &key, &value, BPF_ANY)) {
fprintf(stderr, "update failed: %s\n", strerror(errno));
err = 1;
} else {
printf("blocked %s\n", cidr);
}
close(fd);
return err;
}
static int do_del(const char *cidr) { struct ipv4_lpm_key key = {}; int fd; int err = 0;
if (parse_cidr(cidr, &key)) {
fprintf(stderr, "bad CIDR: %s\n", cidr);
return 1;
}
fd = bpf_obj_get(deny_pin);
if (fd < 0) {
fprintf(stderr, "open %s: %s\n", deny_pin, strerror(errno));
return 1;
}
if (bpf_map_delete_elem(fd, &key)) {
fprintf(stderr, "delete failed: %s\n", strerror(errno));
err = 1;
} else {
printf("unblocked %s\n", cidr);
}
close(fd);
return err;
}
static int sum_slot(int fd, __u32 key, int cpu_count, __u64 *out) { __u64 *values; __u64 total = 0; int err = -1;
values = calloc((size_t)cpu_count, sizeof(*values));
if (!values)
return -1;
if (bpf_map_lookup_elem(fd, &key, values) == 0) {
for (int index = 0; index < cpu_count; index++)
total += values[index];
*out = total;
err = 0;
}
free(values);
return err;
}
static int do_stats(void) { int fd = bpf_obj_get(stats_pin); int cpu_count = libbpf_num_possible_cpus(); __u64 pass = 0; __u64 drop = 0; int err = 0;
if (fd < 0) {
fprintf(stderr, "open %s: %s\n", stats_pin, strerror(errno));
return 1;
}
if (cpu_count <= 0 || sum_slot(fd, 0, cpu_count, &pass) ||
sum_slot(fd, 1, cpu_count, &drop)) {
fprintf(stderr, "failed to read per-CPU statistics\n");
err = 1;
} else {
printf("pass=%llu drop=%llu\n", (unsigned long long)pass,
(unsigned long long)drop);
}
close(fd);
return err;
}
int main(int argc, char **argv) { if (argc < 3 || set_pin_paths(argv[1])) { fprintf(stderr, “usage: %s PIN_DIRECTORY add|del CIDR | stats\n”, argv[0]); return 1; } if (!strcmp(argv[2], “add”) && argc == 4) return do_add(argv[3]); if (!strcmp(argv[2], “del”) && argc == 4) return do_del(argv[3]); if (!strcmp(argv[2], “stats”) && argc == 3) return do_stats();
fprintf(stderr, "usage: %s PIN_DIRECTORY add|del CIDR | stats\n",
argv[0]);
return 1;
}
The key line is bpf_obj_get("$PIN_DIR/deny") — no skeleton, no attach. This process gets its own fd to the same kernel trie the loader pinned, exactly the rendezvous from the pinning section. Everything after is the ordinary Day 2 userspace map API.
block.c — loader
Neither artifact above attaches the program. The complete loader loads the object, creates one pin directory that did not previously exist, pins both maps for the separate CLI, attaches the XDP program, and owns every resource until Ctrl-C:
/* Day 15 — loader for the XDP LPM-trie firewall. *
- Usage: sudo ./block IFACE [OWNED_PIN_DIRECTORY]
- The optional directory must not already exist. The loader creates it, pins
- both maps for blockcli, and removes the pins and directory on every exit. */ #include <errno.h> #include <limits.h> #include <net/if.h> #include <signal.h> #include <stdio.h> #include <string.h> #include <sys/stat.h> #include <unistd.h>
#include <bpf/libbpf.h>
#include “block.skel.h”
static volatile sig_atomic_t exiting;
static void handle_signal(int signal_number) { (void)signal_number; exiting = 1; }
static int install_signal_handlers(void) { const struct sigaction action = { .sa_handler = handle_signal, };
if (sigaction(SIGINT, &action, NULL) != 0 ||
sigaction(SIGTERM, &action, NULL) != 0) {
fprintf(stderr, "failed to install signal handlers: %s\n",
strerror(errno));
return -errno;
}
return 0;
}
int main(int argc, char **argv) { struct block_bpf *skel = NULL; struct bpf_link *link = NULL; char default_dir[PATH_MAX]; char deny_pin[PATH_MAX]; char stats_pin[PATH_MAX]; const char *pin_dir; unsigned int ifindex; int dir_created = 0; int deny_pinned = 0; int stats_pinned = 0; int err;
setvbuf(stdout, NULL, _IOLBF, 0);
if (argc < 2 || argc > 3) {
fprintf(stderr, "usage: %s IFACE [OWNED_PIN_DIRECTORY]\n", argv[0]);
return 1;
}
ifindex = if_nametoindex(argv[1]);
if (!ifindex) {
fprintf(stderr, "if_nametoindex(%s): %s\n", argv[1], strerror(errno));
return 1;
}
if (argc == 3) {
pin_dir = argv[2];
} else {
snprintf(default_dir, sizeof(default_dir),
"/sys/fs/bpf/practical-ebpf-day15-%ld", (long)getpid());
pin_dir = default_dir;
}
if (snprintf(deny_pin, sizeof(deny_pin), "%s/deny", pin_dir) >=
(int)sizeof(deny_pin) ||
snprintf(stats_pin, sizeof(stats_pin), "%s/stats", pin_dir) >=
(int)sizeof(stats_pin)) {
fprintf(stderr, "pin directory path is too long\n");
return 1;
}
err = install_signal_handlers();
if (err)
return 1;
if (mkdir(pin_dir, 0700) != 0) {
fprintf(stderr, "refusing pin directory %s: %s\n", pin_dir,
strerror(errno));
return 1;
}
dir_created = 1;
skel = block_bpf__open_and_load();
if (!skel) {
fprintf(stderr, "failed to open and load block BPF skeleton\n");
err = -errno;
goto cleanup;
}
err = bpf_map__pin(skel->maps.deny, deny_pin);
if (err) {
fprintf(stderr, "failed to pin %s: %s\n", deny_pin, strerror(-err));
goto cleanup;
}
deny_pinned = 1;
err = bpf_map__pin(skel->maps.stats, stats_pin);
if (err) {
fprintf(stderr, "failed to pin %s: %s\n", stats_pin, strerror(-err));
goto cleanup;
}
stats_pinned = 1;
link = bpf_program__attach_xdp(skel->progs.xdp_block, ifindex);
if (!link) {
err = -errno;
fprintf(stderr, "failed to attach XDP program to %s: %s\n",
argv[1], strerror(errno));
goto cleanup;
}
printf("Firewall attached to %s. Manage it with:\n"
" blockcli %s add|del <CIDR>\n"
" blockcli %s stats\n"
"Press Ctrl-C to detach and remove the owned pins.\n",
argv[1], pin_dir, pin_dir);
while (!exiting)
pause();
err = 0;
cleanup: bpf_link__destroy(link); if (stats_pinned) unlink(stats_pin); if (deny_pinned) unlink(deny_pin); block_bpf__destroy(skel); if (dir_created && rmdir(pin_dir) != 0 && errno != ENOENT) { fprintf(stderr, “failed to remove owned pin directory %s: %s\n”, pin_dir, strerror(errno)); if (!err) err = -errno; } return err != 0; }
The pin is what lets two processes share one trie: block owns the skeleton and attachment; blockcli opens $PIN_DIR/deny and $PIN_DIR/stats with bpf_obj_get. bpf_map__pin (tools/lib/bpf/libbpf.c:9150) issues BPF_OBJ_PIN; bpf_obj_get (tools/lib/bpf/bpf.c:609) issues BPF_OBJ_GET. The loader removes both pins and its directory on every exit path, so the rendezvous lasts exactly as long as this lab run.
Run
First stand up an isolated peer at 10.0.0.2 so there is actually something to ping — otherwise ping times out whether or not XDP is dropping, and the experiment proves nothing. A veth pair is a virtual cable: two linked interfaces, here with one end (veth1) moved into a separate network namespace (an isolated network stack) so it acts like a remote peer.
sudo ip netns add peer
sudo ip link add veth0 type veth peer name veth1
sudo ip link set veth1 netns peer
sudo ip addr add 10.0.0.1/24 dev veth0 && sudo ip link set veth0 up
sudo ip -n peer addr add 10.0.0.2/24 dev veth1 && sudo ip -n peer link set veth1 up
XDP runs on RX (ingress), so the drop must happen on the echo reply — whose source address is 10.0.0.2. Attach the program on veth0, the host side that receives those replies:
make -C ebpf/labs day15
PIN=/sys/fs/bpf/practical-ebpf-day15-$$
sudo ebpf/labs/.output/day15/block veth0 "$PIN" & # host RX side
LOADER=$!
trap 'sudo kill -INT "$LOADER" 2>/dev/null || true; wait "$LOADER" 2>/dev/null || true; sudo ip link del veth0 2>/dev/null || true; sudo ip netns del peer 2>/dev/null || true' EXIT
sleep 0.5
ping -c 3 10.0.0.2 # replies arrive on veth0 ingress -> PASS
sudo ebpf/labs/.output/day15/blockcli "$PIN" add 10.0.0.0/8
ping -c 3 10.0.0.2 # matching replies -> XDP_DROP -> 100% loss
sudo ebpf/labs/.output/day15/blockcli "$PIN" stats
sudo ebpf/labs/.output/day15/blockcli "$PIN" del 10.0.0.0/8
ping -c 3 10.0.0.2 # works again
The observation is the before/after contrast: the first ping gets replies (0% loss), and after add 10.0.0.0/8 the replies are dropped on veth0 ingress so ping reports 100% loss. blockcli stats confirms it with a non-zero drop count:
pass=<some number> drop=3
(drop should be 3 — one per dropped echo reply. Attaching to the in-netns veth1 instead would not drop the replies, because they leave that side on TX, not RX.)
Clean up by leaving the shell or running the trap body. It signals the exact loader PID (never a broad pkill), waits for the loader to auto-detach XDP and remove its owned pins/directory, then removes only this lab’s veth pair and namespace. If the loader is killed with SIGKILL, its pins demonstrate the persistence rule; remove only the unique $PIN directory before rerunning.
Now you have a userspace-controlled, line-rate firewall. Every API call updates the trie atomically; no XDP restart needed.
What to break, in order
Break 1 — Forget BPF_F_NO_PREALLOC
Remove the flag. Map creation fails:
libbpf: map 'deny': failed to create: EINVAL
That EINVAL is not libbpf being fussy — it comes straight from the kernel’s trie_alloc, which lists !(attr->map_flags & BPF_F_NO_PREALLOC) among the conditions that return ERR_PTR(-EINVAL) (kernel/bpf/lpm_trie.c:579). Most map types preallocate hashtable buckets at create time for stability. The LPM trie is a dynamic tree that allocates nodes on demand, so the kernel insists you acknowledge that with the flag.
Break 2 — Wrong byte order on insert
out->addr = htonl(a.s_addr); /* WRONG — already big-endian */
inet_aton returns network byte order already. Double-converting flips the bits. You’ll insert “wrong” CIDRs that never match. Verify with:
sudo bpftool map dump name deny
bpftool dumps a non-BTF LPM map as raw little-endian hex byte arrays — not as a decoded prefixlen N key 0xN string. For 10.1.0.0/16 you’ll see:
key: 10 00 00 00 0a 01 00 00 value: 01 00 00 00
The first u32 is prefixlen in little-endian (10 00 00 00 = 16); the next 4 bytes are the address in network order — 0a 01 00 00 = 10.1.0.0 (correct). This is the byte layout from “The key struct” made visible: prefixlen at offset 0, address bytes at offset 4. If you double-swapped, the address bytes come out reversed: 00 00 01 0a. (Add -j for the same bytes as a JSON hex array.)
Break 3 — Block your own SSH
If you’re attached to the real NIC and add 0.0.0.0/0 to the denylist, you’ve cut your own session. (Don’t actually do this.) XDP_DROP is below the kernel’s “let SSH through” logic.
To detach without console access: panic + reboot. Or better: never test on a real NIC without an out-of-band escape route.
Break 4 — Add IPv6
struct ipv6_lpm_key {
__u32 prefixlen;
struct in6_addr addr;
};
Update the map definition’s value type, parse CIDR with inet_pton(AF_INET6, ...), branch in BPF on ETH_P_IPV6. Same shape, different sizes — and now you know why it just works: enlarging the struct grows key_size, and the kernel derives the address width from it (see “The key struct”). You never tell the kernel “this is IPv6”; the arithmetic on key_size does it for you.
What to read in the kernel
kernel/bpf/lpm_trie.c— the implementation. Readtrie_lookup_elem(the IM-skipping walk at:271-275, the exact-match early exit at:259-262) andtrie_update_elem(the IM-node insert at:423-444). ~800 lines, accessible.include/uapi/linux/bpf.h—struct bpf_lpm_trie_key_u8(:103-109), theBPF_OBJ_PIN/BPF_OBJ_GETcommands (:962-963), andBPF_F_NO_PREALLOC(:1402).tools/lib/bpf/libbpf.c/tools/lib/bpf/bpf.c—bpf_map__pin(:9150),bpf_obj_pin(:604),bpf_obj_get(:609): the pinning entry points.tools/testing/selftests/bpf/map_tests/lpm_trie_map_basic_ops.c— the canonical test, including edge cases.
Bullet Points
BPF_MAP_TYPE_LPM_TRIEis for prefix lookups (CIDRs, IPv6 prefixes, MAC OUIs).- Key struct must start with
prefixlen, followed by address bytes — it mirrorsstruct bpf_lpm_trie_key_u8, and the kernelBUILD_BUG_ONs the address landing at a u32-aligned offset (lpm_trie.c:176). The address width (and thusmax_prefixlen) is derived fromkey_size, which is why IPv6 “just works” by growing the struct. - Always set
BPF_F_NO_PREALLOC— the kernel returns-EINVALat create time without it (lpm_trie.c:579). - The trie stores intermediate (IM) branch nodes with no value to fork diverging prefixes; that’s the real per-entry memory cost, and lookup skips them as match candidates (
lpm_trie.c:271-275), returning the last non-IM node — that’s longest-prefix-match. - Lookup is O(prefix_len) — fast enough for line-rate; reads are RCU-protected (Day 2), safe to update while XDP is running.
- Pinning + bpffs is how two processes share one map: a BPF object is fd-refcounted and freed when the last fd closes (that’s why Day 14’s map vanished); a pin in
/sys/fs/bpfadds a filesystem reference that survives the creator’s death. The loaderbpf_map__pins; the CLIbpf_obj_gets its own fd to the same trie. This lab uses a unique owned directory and removes its pins on normal exit; a forcedSIGKILLstill demonstrates why stale pins must be removed explicitly. - Userspace CIDR parsing:
inet_atonreturns network byte order (don’t double-convert) — required because the trie walks bits MSB-first. - Test on
vethpairs before deploying on real interfaces.
Check question
You add 10.0.0.0/8 and 10.1.0.0/16 to the denylist. A packet from 10.1.5.20 arrives. Which entry matches, and what’s the lookup cost?
Click to reveal answer
Answer: Both prefixes match, but LPM returns the longest — 10.1.0.0/16. Cost is O(prefix length matched) — about 16 bit comparisons, plus tree-walking overhead. The trie nodes are visited in the order: root → /8 → /16, and the walk “remembers” the last non-intermediate node it passed (lpm_trie.c:271-275), returning the value at /16. ~30 ns total on modern hardware.
Tomorrow
Day 16: tc-bpf — the legacy way to attach BPF to the network stack at L2/L3. We’ll see why it predates XDP, what it can do that XDP can’t, and the pain of tc qdisc lifecycle that motivated tcx.
Day 16 — tc-bpf: BPF in the kernel network stack
Today’s mission: attach BPF to a network interface’s ingress and egress with classic tc, learn the traffic-control machinery (qdisc / classifier / filter / clsact) that every
tccommand leans on, see why XDP can’t do everything, and feel the pain oftc qdisclifecycle that motivated tcx (tomorrow). Total time: ~110 minutes.
Why tc, when XDP exists
Days 14–15 put your BPF program in the NIC driver with XDP, before the kernel built anything. That’s the fastest place — and also its limit: there’s no skb yet. No connection-tracking metadata, no socket lookup, no routing decision, no skb control block. For programs that need that information (e.g., “tag packets belonging to flows my conntrack already saw”), XDP isn’t enough.
tc-bpf runs after skb allocation. You see struct __sk_buff — a typed view of the kernel’s struct sk_buff (the universal packet container you dissected on Day 1 of the companion networking book: the descriptor with head/data/tail/end pointers and page-fragment payload). All the metadata that XDP couldn’t show you is now populated.
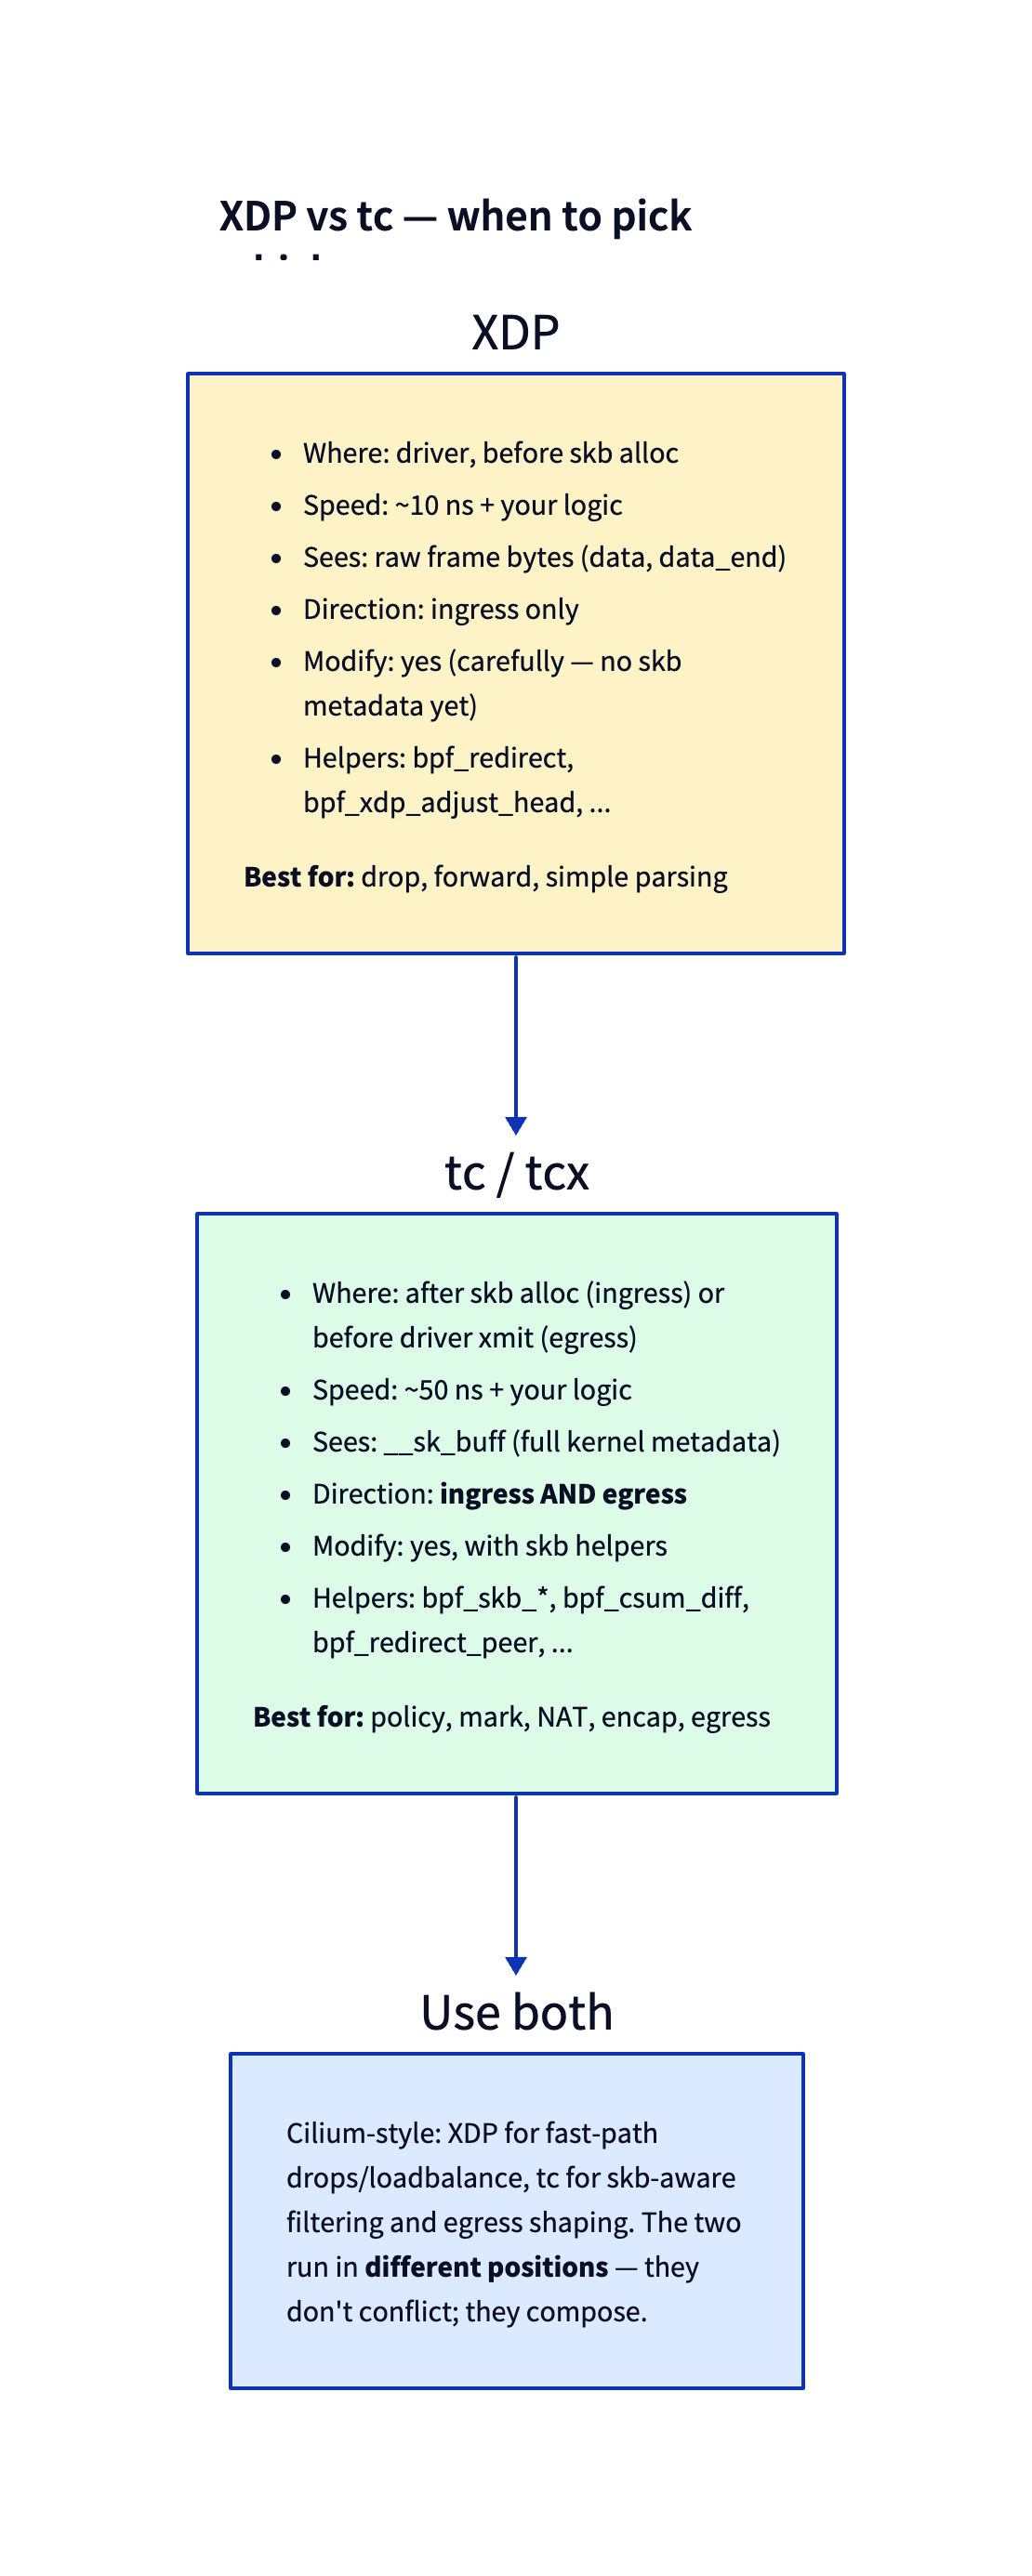
The other big difference: tc has both ingress and egress hooks. XDP is ingress-only. If you want to drop or modify packets on their way out (e.g., adding tunnel encapsulation, marking based on cgroup), you need tc.
But before we write a line of BPF, we have to confront a wall of unfamiliar vocabulary. Every command in today’s lab — tc qdisc add dev veth1 clsact, tc filter add ... bpf da obj, tc filter show — comes from a subsystem that predates BPF by a decade and was built for something else entirely. If you’ve only done XDP, you have never met a qdisc, a classifier, a filter, or a thing called clsact. Let’s fix that first, so none of the lab is cargo-cult.
The tc traffic-control model: qdisc, classifier, filter
tc is short for traffic control. Long before BPF existed, Linux needed a way to do QoS — shape, prioritize, and rate-limit outgoing traffic so that, say, your VoIP packets jump ahead of a bulk file upload. That subsystem is what tc configures, and its central object is the qdisc.
What a qdisc is
A qdisc (queueing discipline) is an object attached to a net_device that decides how packets are queued and scheduled on their way out. When the stack wants to transmit a packet, it doesn’t hand it straight to the driver — it enqueues it on the device’s qdisc, and the qdisc later dequeues packets in whatever order its algorithm dictates. Historically this only existed on the egress (TX) path, because that’s the side you control: you can’t make a remote sender slow down, but you can choose the order in which your packets leave.
The default qdisc on most interfaces is pfifo_fast — a simple three-band priority FIFO. It really does queue: packets go in, packets come out, possibly reordered by priority. That is the normal job of a qdisc — actual buffering and scheduling of bytes.
The classifier → filter → action pipeline
A pure FIFO is dumb; for real QoS you need to classify traffic (“this is VoIP, that is bulk”) and treat classes differently. So tc grew a three-stage pipeline that hangs off a qdisc:
- A filter inspects a packet and decides whether it matches.
tcships many filter types —u32(match raw header bytes),flower(match parsed fields), and the one we care about,bpf(run a BPF program). The filter is the classifier: its job is to say “this packet belongs to class X.” - An action then decides the packet’s fate — drop it, redirect it, re-mark it, pass it along.
So the conceptual flow is classifier → filter → action. BPF was bolted onto this old machinery as just another filter type (cls_bpf). That is the single most important thing to understand today, because it explains why attaching a tc-bpf program needs two commands: one to install a qdisc that provides the hook, and one to add your BPF program as a filter on that qdisc.
You can see the classic classifier entry point in the kernel. When a packet reaches a bpf filter, the kernel calls:
/* net/sched/cls_bpf.c:81 */
TC_INDIRECT_SCOPE int cls_bpf_classify(struct sk_buff *skb,
const struct tcf_proto *tp,
struct tcf_result *res)
registered as the .classify handler of the bpf filter ops:
/* net/sched/cls_bpf.c:685 */
.classify = cls_bpf_classify,
This function — over ten years old — is the legacy path your tc filter add ... bpf command lights up.
clsact: a qdisc that queues nothing
Here is the twist. To attach BPF you need a qdisc to provide a hook point — but you do not want any of the queueing/shaping behavior a real qdisc brings. You just want a place to hang a classifier on both ingress and egress.
That is exactly what clsact is: a special pseudo-qdisc that does not queue or schedule a single byte. It exists solely to expose two classification hook points — one for ingress, one for egress — so that tc-bpf has somewhere to attach. This is why this chapter (and the kernel community) call it a scaffold: hooks only, no queueing.
You can ground that claim in the source. clsact is registered as a qdisc whose .init is clsact_init:
/* net/sched/sch_ingress.c:341 */
.init = clsact_init,
/* net/sched/sch_ingress.c:337 */
.cl_ops = &clsact_class_ops,
and clsact_init (net/sched/sch_ingress.c:243) does nothing but wire up two blocks — an ingress block and an egress block — that will hold the filters. A “block” (tcf_block) is just the kernel’s container for the chain of filters attached at a hook. The egress side is plumbed by clsact_egress_block_set (sch_ingress.c:222) / clsact_egress_block_get (sch_ingress.c:236); the ingress side reuses the plain-ingress plumbing ingress_ingress_block_set (sch_ingress.c:63). No .enqueue/.dequeue that actually moves packets — contrast that with pfifo_fast, which is all enqueue/dequeue.
The ingress/egress choice is encoded in a handle. A qdisc handle is a 32-bit number written major:minor. clsact claims a fixed reserved handle, and the minor number selects which hook your filter lands on:
/* include/uapi/linux/pkt_sched.h */
#define TC_H_CLSACT TC_H_INGRESS /* :77 the clsact qdisc handle itself */
#define TC_H_MIN_INGRESS 0xFFF2U /* :80 the ingress hook */
#define TC_H_MIN_EGRESS 0xFFF3U /* :81 the egress hook */
This is the secret behind the words ingress and egress you’ll type in tc filter add dev veth1 ingress .... They are not device names or free-form keywords — they are shorthand for these reserved minor handles that pick the direction. ingress → 0xFFF2, egress → 0xFFF3.
And it explains Break 1 below in advance: without clsact installed, there is no tcf_block to hold your filter, so tc filter add fails with Parent Qdisc doesn't exists. The qdisc is the parent; the filter is the child; no parent, no child.
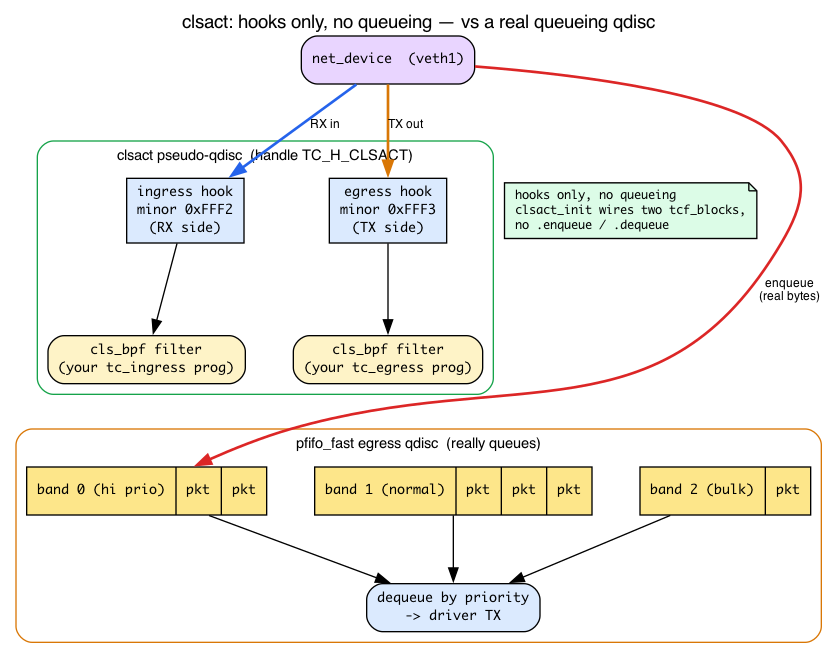
Where the two hooks actually fire in the datapath
You now know tc-bpf “runs after skb allocation” and that there are two hooks — but where in the receive and transmit paths do they execute? That placement is what lets you reason about ordering (the Check question) and about why a locally-routed packet skips egress (the namespace trick in the lab).
The RX path skeleton (driver → NAPI poll → __netif_receive_skb_core → L3 handlers) and the TX path (__dev_queue_xmit → qdisc → driver) are taught in full in the companion networking book (Days 2–3). Here we only need the two hook placements:
- Ingress tc runs from inside the RX software path, after the driver/NAPI has built the skb but before the packet is handed to L3 protocol handlers (
ip_rcvand friends). That’s the concrete meaning of “after skb allocation”: by the time your program runs,__sk_buffalready carrieslen,protocol,mark, and the rest. - Egress tc runs from inside the transmit path, just before the packet is enqueued to the real (queueing) qdisc and driver. A packet that is locally delivered — e.g. routed over loopback to an address on the same host — never enters this transmit path on
veth1, which is precisely why today’s lab forces traffic into a separate namespace so the UDP datagram actually traversesveth1’s egress hook.
In v7.1 the two hooks are reached through sch_handle_ingress and sch_handle_egress:
/* net/core/dev.c:4460 — reads skb->dev->tcx_ingress; called at dev.c:6053 in the RX path */
static __always_inline struct sk_buff *
sch_handle_ingress(struct sk_buff *skb, struct packet_type **pt_prev, int *ret, ...)
/* net/core/dev.c:4524 — reads dev->tcx_egress; called at dev.c:4807 in __dev_queue_xmit */
static __always_inline struct sk_buff *
sch_handle_egress(struct sk_buff *skb, int *ret, struct net_device *dev)
Both first try tcx_run (the modern Day-17 path) and fall back to the classic tc_run(tcx_entry(entry), skb, ...) — the same hook point is shared by classic tc-bpf and tcx:
/* net/core/dev.c:4485 (ingress) and dev.c:4544 (egress) */
sch_ret = tc_run(tcx_entry(entry), skb, &drop_reason);
tcx_run itself (net/core/dev.c:4439) just walks its program list and runs each with bpf_prog_run. The takeaway: because ingress tc sits at a fixed point in the RX path after the skb exists, and XDP sits before the skb exists in the driver, the XDP → tc-ingress order is deterministic and sequential — which is exactly what today’s Check question is about.
The tc context: struct __sk_buff
A read-mostly typed view of struct sk_buff (abridged — the real definition in include/uapi/linux/bpf.h continues with socket and timestamp fields):
struct __sk_buff {
__u32 len;
__u32 pkt_type; /* PACKET_HOST, PACKET_BROADCAST, ... */
__u32 mark; /* socket/skb mark */
__u32 queue_mapping;
__u32 protocol; /* L3 protocol */
__u32 vlan_present;
__u32 vlan_tci;
__u32 vlan_proto;
__u32 priority;
__u32 ingress_ifindex;
__u32 ifindex;
__u32 tc_index; /* tc classification slot */
__u32 cb[5]; /* skb control block — pass data between progs */
__u32 hash; /* skb hash */
__u32 tc_classid;
__u32 data; /* same idea as xdp_md */
__u32 data_end;
__u32 napi_id;
/* and more — family/remote_ip4/...; data_meta, tstamp, sk, etc. */
};
Use data and data_end for direct packet access (same bounds-checking discipline as XDP). Use mark, cb, etc. to coordinate with kernel state.
mark: a scratch tag the whole stack shares
Today’s lab writes skb->mark = 0xCAFE in the ingress program and later matches it from iptables. For that to make sense you need to know what mark is and why a value a BPF program writes is visible to a completely different subsystem.
markis a 32-bit scratch field on the skb (kernelstruct sk_buff.mark, surfaced here as__sk_buff.mark). It is not part of the packet on the wire — nothing in the Ethernet/IP/TCP bytes changes. It is metadata that travels with the skb through the stack, like a sticky note on the descriptor.- It is the same field that netfilter calls the packet mark (a.k.a. fwmark / nfmark) and that policy routing matches on. That shared identity is exactly why a tc-bpf write is later matchable by
iptables -m mark: both are reading the oneskb->markslot. (The iptables/netfilter side — theLOGtarget, theINPUTchain,-m mark— is companion-book netfilter material; see the linux-net netfilter chapter for the matching machinery.) markis one of the few__sk_bufffields a tc program is allowed to write (see Break 3’s writable-field list), which is what makes this coordination pattern legal in the first place. We can confirm it directly: intc_cls_act_is_valid_access(net/core/filter.c:9186), theBPF_WRITEallow-list opens withcase bpf_ctx_range(struct __sk_buff, mark):(filter.c:9193).- Because the mark is per-skb and is not reset between hooks, it is the canonical way BPF coordinates with kernel state — which is the chapter’s whole motivation: tag a packet in BPF, act on the tag later in conntrack / routing / iptables.
Action constants for tc
#define TC_ACT_OK 0 /* let the packet through */
#define TC_ACT_RECLASSIFY 1 /* reclassify */
#define TC_ACT_SHOT 2 /* drop */
#define TC_ACT_PIPE 3 /* pass to next filter */
#define TC_ACT_STOLEN 4 /* steal: don't free, prog took it */
#define TC_ACT_QUEUED 5
#define TC_ACT_REPEAT 6
#define TC_ACT_REDIRECT 7 /* paired with bpf_redirect() */
Most programs return TC_ACT_OK (allow), TC_ACT_SHOT (drop), or TC_ACT_REDIRECT.
da = direct-action: your return value is the verdict
Every attach command below uses bpf da obj tc.bpf.o, and tc -s filter show literally prints direct-action. What is da?
Recall the classic pipeline: a classifier returns a classid, and a separate tc action object actually drops or redirects. That indirection — classifier here, action there — is the historical default, and it’s clumsy: you’d have to create an action object and wire it to the classifier.
da = direct-action collapses that. It tells cls_bpf that the BPF program’s return value itself is the TC_ACT_* verdict — no separate action object needed. That is why the lab’s program can simply return TC_ACT_SHOT / TC_ACT_OK and have it take effect.
Internally this is the TCA_BPF_FLAG_ACT_DIRECT flag. The parse path validates and records it:
/* net/sched/cls_bpf.c:473 */
if (bpf_flags & ~TCA_BPF_FLAG_ACT_DIRECT) { ret = -EINVAL; ... }
/* net/sched/cls_bpf.c:478 */
have_exts = bpf_flags & TCA_BPF_FLAG_ACT_DIRECT;
and tc filter show reports it back (cls_bpf.c:611: bpf_flags |= TCA_BPF_FLAG_ACT_DIRECT;), which is the direct-action string you see. The return value is consumed as the verdict inside cls_bpf_classify (cls_bpf.c:81). Without da you’d be hand-wiring classifier-plus-action plumbing; effectively all modern tc-bpf uses direct-action, and it’s conceptually what tcx inherits tomorrow.
There are no Dumb Questions
Q: Does tc see GRO-coalesced packets or individual packets?
A: tc on ingress sees what NAPI/GRO produced. Recall NAPI receive polling from the companion networking book (Days 1–2: the driver drains the RX descriptor ring in softirq). GRO (Generic Receive Offload) is a software step layered on top of that: during NAPI receive, the kernel merges consecutive same-flow segments into one larger skb before delivering it up the stack. So tc-ingress — which sits after that merge in the RX path — may see a single coalesced “superpacket” rather than the individual frames that arrived on the wire. GRO improves throughput but hides per-frame structure, which is why tools that need exact per-packet semantics (Cilium, for instance) disable GRO. On egress the concern doesn’t disappear — it just changes offload. The egress hook (
sch_handle_egress) fires inside__dev_queue_xmitbefore the real qdisc and well before segmentation:skb_gso_segmentruns later, invalidate_xmit_skbon the way todev_hard_start_xmit(and is skipped entirely when the NIC does TSO in hardware). So a TCP sender’s large GSO/TSO buffer reaches the egress hook as a single super-skb (gso_segs > 1, spanning many MTU-worth of data) — the egress analog of a GRO superpacket, not a per-frame view. tc-egress sees skbs pre-segmentation, so the same coalescing caveat applies outbound that GRO creates inbound.Q: Why is the attach mechanism so awkward (
tc qdisc add+tc filter add)?A: As the model section explained, tc predates BPF. It was originally a packet-classifier system for QoS (queueing disciplines), and BPF programs got bolted on as a filter type. The qdisc gives you a hook point; the filter is your BPF. Hence two commands. tcx (tomorrow) ditches this entirely.
The lab: tc on ingress and egress
tc.bpf.c
Included from the source the lab build and CI compile (there is no userspace
loader today — the object is attached with the tc command below):
#include “vmlinux.h” #include <bpf/bpf_helpers.h> #include <bpf/bpf_endian.h>
/* vmlinux.h does not export these UAPI macros, and <linux/pkt_cls.h> can’t be mixed with vmlinux.h (it redefines struct tc_stats etc.). So we define the handful we need locally, the same way the kernel’s own BPF selftests do (tools/testing/selftests/bpf/progs/bpf_tracing_net.h). IPPROTO_UDP already comes from vmlinux.h. */ #define TC_ACT_OK 0 #define TC_ACT_SHOT 2 #define ETH_P_IP 0x0800
char LICENSE[] SEC(“license”) = “GPL”;
/* The ELF section name (SEC) is what tc filter add ... sec tc_ingress selects;
the C function symbol must differ from it, or clang errors with
“symbol ‘tc_ingress’ is already defined”. */
SEC(“tc_ingress”)
int mark_ingress(struct __sk_buff *skb)
{
void *data = (void *)(long)skb->data;
void *end = (void *)(long)skb->data_end;
struct ethhdr *eth = data;
if (eth + 1 > end) return TC_ACT_OK;
if (eth->h_proto != bpf_htons(ETH_P_IP)) return TC_ACT_OK;
struct iphdr *ip = (void )(eth + 1);
if (ip + 1 > end) return TC_ACT_OK;
/ Mark packets so userspace iptables can pick them up */
skb->mark = 0xCAFE;
return TC_ACT_OK;
}
SEC(“tc_egress”) int drop_udp_egress(struct __sk_buff skb) { / Drop every UDP packet outbound to demonstrate egress */ void *data = (void *)(long)skb->data; void *end = (void *)(long)skb->data_end; struct ethhdr *eth = data; if (eth + 1 > end) return TC_ACT_OK; if (eth->h_proto != bpf_htons(ETH_P_IP)) return TC_ACT_OK; struct iphdr *ip = (void *)(eth + 1); if (ip + 1 > end) return TC_ACT_OK; if (ip->protocol == IPPROTO_UDP) return TC_ACT_SHOT; return TC_ACT_OK; }
Setup: build the object and a namespaced veth pair
First build the object (Days 14–15 drove this with make; here is the explicit compile):
clang -O2 -g -target bpf -c tc.bpf.c -o tc.bpf.o # or: make
Now the topology. Unlike Day 14 we put one end of the veth pair in its own network namespace. This matters for the egress demo: as the datapath section explained, the egress hook only fires from inside the transmit path. If both ends live in the root namespace, a packet sent to veth1’s own address (10.0.0.2) is routed over loopback and never traverses veth1’s egress hook — so the egress drop below would silently never fire. A namespace forces the packet out through veth1.
sudo ip netns add ns1
sudo ip link add veth0 type veth peer name veth1
sudo ip link set veth1 netns ns1
sudo ip addr add 10.0.0.1/24 dev veth0
sudo ip link set veth0 up
sudo ip netns exec ns1 ip addr add 10.0.0.2/24 dev veth1
sudo ip netns exec ns1 ip link set veth1 up
sudo ip netns exec ns1 ip link set lo up
(If a veth0/ns1 from a previous run is lying around, run the Detach/cleanup at the bottom first.)
Attach the classic way
veth1 lives in ns1, so every tc command runs inside that namespace with ip netns exec ns1:
sudo ip netns exec ns1 tc qdisc add dev veth1 clsact
sudo ip netns exec ns1 tc filter add dev veth1 ingress \
bpf da obj tc.bpf.o sec tc_ingress
sudo ip netns exec ns1 tc filter add dev veth1 egress \
bpf da obj tc.bpf.o sec tc_egress
# verify:
sudo ip netns exec ns1 tc filter show dev veth1 ingress
sudo ip netns exec ns1 tc filter show dev veth1 egress
Read those three commands with the model section in mind: the first installs the clsact pseudo-qdisc (the scaffold — clsact_init wires up the ingress and egress blocks, but queues nothing). The next two add your BPF as a filter on each block; ingress/egress select the 0xFFF2/0xFFF3 minor handles, and da makes the program’s return value the verdict.
Run
Generate traffic from inside ns1 so it egresses veth1:
# ICMP passes — the egress program only drops UDP:
sudo ip netns exec ns1 ping -c 3 10.0.0.1
# UDP is dropped on veth1's egress. A `nc -u` send never reports an
# application error even when the datagram is silently dropped, so don't
# wait for nc to "fail" — instead watch the *peer* veth0 in the root ns:
# UDP never arrives, ICMP does. Start the sniffer first, then send.
sudo timeout 4 tcpdump -i veth0 -nn 'udp port 9999 or icmp' &
sudo ip netns exec ns1 ping -c 1 10.0.0.1
sudo ip netns exec ns1 nc -u -w1 10.0.0.1 9999 <<< "hi"
wait
You’ll see the ICMP echo request reach veth0 but no UDP packet to port 9999 — the egress program shot it on veth1 before it ever left:
IP 10.0.0.2 > 10.0.0.1: ICMP echo request, ...
IP 10.0.0.1 > 10.0.0.2: ICMP echo reply, ...
Why not
tc -s filter show ... egress? Withbpf da(direct-action) there is no separate tc action object to accumulate stats, so on this kernel (iproute2 6.19.0, v7.1.0)tc -s filter showprints only the filter line — noSent ... (dropped N ...)counter. The drop is real (tcpdump proves it); the classic per-action stats line just isn’t emitted for direct-action filters. If you want a counter, add aBPF_MAP_TYPE_ARRAYto the egress program, bump it beforereturn TC_ACT_SHOT, and read it withbpftool map dump.
Verify the mark in iptables
The ingress program stamps skb->mark = 0xCAFE on incoming IP packets — that shared fwmark slot we covered above. To observe it from userspace, add an iptables rule inside ns1 that matches that mark and watch its packet counter climb:
sudo ip netns exec ns1 iptables -A INPUT -m mark --mark 0xCAFE -j ACCEPT
sudo ip netns exec ns1 ping -c 3 10.0.0.1
sudo ip netns exec ns1 iptables -L INPUT -v -n
The rule’s own pkts counter ticks up for every inbound packet carrying the mark — proof the BPF ingress program set it and that netfilter reads the same skb->mark slot (note the kernel prints the mark lowercase):
Chain INPUT (policy ACCEPT ...)
pkts bytes target prot opt in out source destination
3 252 ACCEPT all -- * * 0.0.0.0/0 0.0.0.0/0 mark match 0xcafe
Why not
-j LOG+dmesg? A netfilterLOGtarget firing inside a non-init network namespace does not reach the kernel ring buffer unlessnet.netfilter.nf_log_all_netns=1(it defaults to0), sosudo dmesg | tailwould show nothing here. The-vpacket counter above is non-mutating and works inside the netns, keeping the lab self-contained. (If you must useLOG, runsudo sysctl -w net.netfilter.nf_log_all_netns=1first and reset it to0afterward.)
Detach and clean up
sudo ip netns exec ns1 tc filter del dev veth1 ingress
sudo ip netns exec ns1 tc filter del dev veth1 egress
sudo ip netns exec ns1 tc qdisc del dev veth1 clsact
# remove the mark-match rule we added above:
sudo ip netns exec ns1 iptables -D INPUT -m mark --mark 0xCAFE -j ACCEPT
# tear down the topology (deleting the namespace also removes veth1, and
# that removes its peer veth0):
sudo ip netns del ns1
Three commands to undo. If your test process crashes mid-test, you have to remember to clean up. No FD-based ownership. This is the pain point tcx fixes.
What to break, in order
Break 1 — Forget clsact
# Skip `tc qdisc add ... clsact` and jump straight to the filter:
sudo ip netns exec ns1 tc filter add dev veth1 ingress bpf da obj tc.bpf.o sec tc_ingress
# Error: Parent Qdisc doesn't exists.
This is the failure the model section predicted: without clsact, clsact_init never ran, so there is no tcf_block to hold the filter — there are no ingress/egress slots at all. Note also that ingress here is the parent-direction keyword (the 0xFFF2 minor handle), not a device name — so the kernel reports a missing parent qdisc, not a missing device. (The exact text is iproute2-version-specific: 6.x prints Error: Parent Qdisc doesn't exists.; older iproute2 prints RTNETLINK answers: No such file or directory.) Add clsact first.
Break 2 — Try a BPF helper that doesn’t work in tc
Add an XDP-only helper inside tc_ingress, rebuild, and re-attach:
/* inside tc_ingress() — bpf_xdp_adjust_head's real signature is
(struct xdp_md *, int), so this is the wrong program type for it */
bpf_xdp_adjust_head(skb, 0);
clang -O2 -g -target bpf -c tc.bpf.c -o tc.bpf.o
sudo ip netns exec ns1 tc filter add dev veth1 ingress bpf da obj tc.bpf.o sec tc_ingress 2>&1 | tail
# program of this type cannot use helper bpf_xdp_adjust_head#44
Note this is a disallowed-helper rejection, not an “unknown func” — the helper exists (it’s helper number 44; you can confirm with FN(xdp_adjust_head, 44, ...) at include/uapi/linux/bpf.h:5949), but each program type has its own helper allowance table, and bpf_xdp_adjust_head is XDP-only.
Break 3 — Set skb->len
skb->len = 100;
Verifier rejects — __sk_buff is read-only for most fields. For tc programs the writable ones are listed explicitly in tc_cls_act_is_valid_access (net/core/filter.c): mark, tc_index, priority, tc_classid, cb[0..4], tstamp, and queue_mapping. len is not among them. (This is the same allow-list that permits the skb->mark = 0xCAFE write in our ingress program — mark is on it, len is not.)
Break 4 — Multiple programs at one priority
sudo ip netns exec ns1 tc filter add dev veth1 ingress pref 100 handle 1 bpf da obj tc.bpf.o sec tc_ingress
sudo ip netns exec ns1 tc filter add dev veth1 ingress pref 100 handle 1 bpf da obj tc.bpf.o sec tc_ingress
# Error: Filter already exists.
The collision is on the priority + handle pair, not the priority alone. A second pref 100 add with no explicit handle does not fail — it gets auto-handle 0x2 and both filters chain, running in handle order. Only reusing the same pref+handle errors. To run programs in a controlled order you use distinct prefs (pref 100, pref 200); replacing an existing filter requires del+add (or tc filter replace). Inspect with sudo ip netns exec ns1 tc -s filter show dev veth1 ingress. This clumsiness is exactly what tcx’s mprog API fixes.
What to read in the kernel
net/sched/cls_bpf.c— the classic tc-bpf classifier (cls_bpf_classifyat:81). Ages ~10 years old. SearchTCA_BPF_FLAG_ACT_DIRECT(:478,:611) to see direct-action parsed and reported.net/sched/sch_ingress.c—clsact_init(:243) and the ingress/egress block plumbing (clsact_egress_block_setat:222). This is the whole “scaffold” qdisc.net/core/dev.c—sch_handle_ingress(:4460) andsch_handle_egress(:4524); the call sites in the RX path (:6053) and__dev_queue_xmit(:4807) show exactly where the hooks fire.tools/lib/bpf/netlink.c— searchbpf_tc_attach. The libbpf wrapper for the legacy interface.
Bullet Points
- A qdisc is a per-device object that queues/schedules egress traffic for QoS; the default
pfifo_fastactually queues. tc’s pipeline is classifier → filter → action, and BPF is just a filter type (cls_bpf). clsactis a pseudo-qdisc that queues nothing — it only exposes ingress (0xFFF2) and egress (0xFFF3) hook points so tc-bpf has somewhere to attach. No clsact ⇒ notcf_block⇒Parent Qdisc doesn't exists.- The two hooks fire at fixed datapath points: ingress after the skb is built but before L3 (
sch_handle_ingress), egress just before the real qdisc in__dev_queue_xmit(sch_handle_egress). Locally-routed packets skip egress onveth1— hence the namespace. da(direct-action) makes the program’s return value be theTC_ACT_*verdict (TCA_BPF_FLAG_ACT_DIRECT), so no separate action object is needed.- tc-bpf runs after skb allocation; sees
__sk_buffwith full kernel metadata. Has both ingress and egress hooks (XDP is ingress only). skb->markis a 32-bit per-skb scratch tag (fwmark/nfmark) that is not on the wire and is writable by tc — the canonical way BPF coordinates with netfilter/routing.- Action constants:
TC_ACT_OK,TC_ACT_SHOT,TC_ACT_REDIRECT. - Classic attach:
tc qdisc add ... clsact+tc filter add ... bpf. Three commands to set up, three to tear down. No FD-based ownership; cleanup on crash is fragile. - Use tcx (Day 17) for new code. tc-bpf classic is legacy.
Check question
You attach the same BPF program to both XDP and tc-ingress on the same interface. Both run on every incoming packet. Will you see them invoked in a deterministic order?
Click to reveal answer
Answer: Yes. XDP runs first (in the driver, before skb alloc). If XDP returns XDP_PASS, the packet flows on; the kernel allocates skb and calls tc-ingress (via sch_handle_ingress). If XDP returns XDP_DROP, tc-ingress never sees the packet. They’re sequential, not concurrent — XDP’s decision gates whether tc even runs.
Tomorrow
Day 17: tcx — same hook position as tc-bpf (the very sch_handle_ingress/sch_handle_egress call sites we read today, taking the tcx_run branch instead of tc_run) but with bpf_link lifecycle, multi-program ordering via mprog, and zero tc qdisc ceremony.
Day 17 — tcx: link-based multi-program networking
Today’s mission: rewrite yesterday’s program with tcx, attach two programs to the same hook in a defined order, and feel why this replaces classic tc-bpf for new code. Along the way we’ll pin down the one thing every tcx tutorial gets backwards — the chain-advance return code — and learn how mprog names the program you want to insert next to. Total time: ~110 minutes.
What tcx fixes
Yesterday’s tc-bpf had three friction points:
- Three commands to attach (qdisc, filter, program) and three to detach.
- No
bpf_linkownership — if your loader process crashes, the BPF stays attached, and you have to manually clean up. - Multiple programs at one hook is awkward — you juggle filter priorities by hand.
tcx (Linux 6.6+, commit e420bed02507) addresses all three.
One syscall to attach. Returns a bpf_link FD. Closing the FD detaches. And ordering between multiple programs uses mprog, the same multi-program abstraction that backs tcx and netkit.
Refresher: what a bpf_link is (Day 14, Day 16)
You met bpf_link on Day 14 with XDP: bpf_program__attach_xdp returned a struct bpf_link, and closing its FD auto-detached the program (day14.md:166,185,213). Day 16 contrasted that with classic tc-bpf, which has no FD ownership at all (day16.md:210,278). One line to carry forward:
A
bpf_linkis a kernel object representing one attachment and holding one reference to the program. The userspace FD owns that link — close the FD (or exit the process) and the ref drops, detaching the program. The program itself is unloaded only when its last reference (link, pinned fd, or open program fd) goes away.
In v7.1, libbpf names this link type "tcx" (tools/lib/bpf/libbpf.c:153, BPF_LINK_TYPE_TCX), and the per-device chain it plugs into is struct bpf_mprog_entry __rcu *tcx_ingress; on the net device (include/linux/netdevice.h:2196).
mprog: ordered chains of BPF programs
Multiple BPF programs can attach to the same hook (one tcx-ingress on eth0 can have N programs). mprog defines deterministic ordering with attach-time flags:
BPF_F_BEFORE— attach before the named program.BPF_F_AFTER— attach after the named program.BPF_F_REPLACE— replace a specific program in place.BPF_F_LINK— interpret the relative target as a link ID/fd rather than a program ID/fd.BPF_F_ID— interpret the relative target as an ID rather than an fd (used withrelative_id).
The chain runs each program in order — but how a program says “keep going” is the one thing you must get right, and it is not what classic tc-bpf taught you.
The verdict that advances the chain: TCX_NEXT, not TC_ACT_OK
Here is the kernel’s per-hook chain runner, tcx_run() in net/core/dev.c (line 4439). Read it slowly — it is short, and every line matters:
/* net/core/dev.c:4439 */
static __always_inline enum tcx_action_base
tcx_run(const struct bpf_mprog_entry *entry, struct sk_buff *skb,
const bool needs_mac)
{
const struct bpf_mprog_fp *fp;
const struct bpf_prog *prog;
int ret = TCX_NEXT; /* :4444 — seed: "no decision yet" */
if (needs_mac)
__skb_push(skb, skb->mac_len);
bpf_mprog_foreach_prog(entry, fp, prog) { /* :4448 */
bpf_compute_data_pointers(skb);
ret = bpf_prog_run(prog, skb); /* :4450 */
if (ret != TCX_NEXT) /* :4451 */
break; /* ← ANY other value stops the chain */
}
if (needs_mac)
__skb_pull(skb, skb->mac_len);
return tcx_action_code(skb, ret);
}
Stare at if (ret != TCX_NEXT) break;. A program continues the chain only by returning TCX_NEXT. Any other return value — including the familiar TC_ACT_OK — terminates the chain right there.
That is the trap. On Day 16 you learned the classic tc-bpf verdicts: TC_ACT_OK (“accept, let it proceed”), TC_ACT_SHOT (“drop”), TC_ACT_REDIRECT (“redirect”). It is very tempting to assume TC_ACT_OK is how one tcx program lets the next one run. It is not. Look at the numbers, side by side:
/* include/uapi/linux/bpf.h:6530 — the NEW tcx contract */
enum tcx_action_base {
TCX_NEXT = -1,
TCX_PASS = 0,
TCX_DROP = 2,
TCX_REDIRECT = 7,
};
/* include/uapi/linux/pkt_cls.h:63 — the legacy tc-classic codes */
#define TC_ACT_UNSPEC (-1)
#define TC_ACT_OK 0
#define TC_ACT_SHOT 2
#define TC_ACT_REDIRECT 7
The terminal numbers line up on purpose (the uapi comment says tcx codes “must remain compatible with their TC_ACT_* counter-parts”): TCX_PASS == TC_ACT_OK == 0, TCX_DROP == TC_ACT_SHOT == 2, TCX_REDIRECT == TC_ACT_REDIRECT == 7. The genuinely new value is TCX_NEXT = -1, which has no tc-classic verdict equivalent — its numeric twin is TC_ACT_UNSPEC (“nobody decided”).
So return TC_ACT_OK; returns 0, which equals TCX_PASS, which is != TCX_NEXT, so the chain stops with an accept verdict. It does the opposite of “let the next program run.”
Where -1 goes after the chain: tcx_action_code() and the tc fall-through
What does tcx_run() do with that seeded-or-returned ret? It funnels it through tcx_action_code() (include/net/tcx.h:145):
/* include/net/tcx.h:145 */
static inline enum tcx_action_base tcx_action_code(struct sk_buff *skb, int code)
{
switch (code) {
case TCX_PASS:
skb->tc_index = qdisc_skb_cb(skb)->tc_classid;
fallthrough;
case TCX_DROP:
case TCX_REDIRECT:
return code; /* a real verdict — pass it straight through */
case TCX_NEXT:
default:
return TCX_NEXT; /* TCX_NEXT or anything unrecognized -> TCX_NEXT (-1) */
}
}
TCX_PASS/TCX_DROP/TCX_REDIRECT come back as themselves — a final verdict. But TCX_NEXT (and any unknown code) maps to TCX_NEXT == -1. And -1 is exactly TC_ACT_UNSPEC, which the ingress dispatcher reads as “no tcx program decided — fall through to classic tc”:
/* net/core/dev.c:4481 */
sch_ret = tcx_run(entry, skb, true);
if (sch_ret != TC_ACT_UNSPEC) /* :4482 */
goto ingress_verdict; /* a real verdict — act on it */
sch_ret = tc_run(tcx_entry(entry), skb, &drop_reason); /* :4485 — else legacy tc filters */
So if the last program in the chain returns TCX_NEXT, control falls through to legacy tc_run() filters — not “accept.” TCX_NEXT means “I defer,” all the way down to the classic tc layer.
The mental model to keep
A tcx program has two jobs it can do per packet:
- Defer — “let the next link decide” — by returning
TCX_NEXT. Counters, tracers, observability programs that don’t make policy returnTCX_NEXT. - Decide — make the final call and short-circuit the rest of the chain — by returning a terminal verdict:
TCX_PASS/TC_ACT_OK(accept),TCX_DROP/TC_ACT_SHOT(drop), orTCX_REDIRECT(redirect). Firewalls and policy programs return a terminal verdict.
This is composable: a counter, a firewall, a tracer can each be installed independently and their ordering controlled at attach time — as long as the observability links return TCX_NEXT so the policy links downstream actually run.
There are no Dumb Questions
Q: If I close the link FD, does the BPF object get unloaded?
A: Only if there are no other references. The link is one ref to the program; closing it drops that ref. If userspace still holds a
bpf_program__fdor the program is pinned in/sys/fs/bpf, it stays loaded but unattached.Q: Does
tcxwork alongside legacytc filter add ... bpf?A: Yes. They share the same hook point; multiple attach mechanisms can coexist. In fact you just saw the coexistence in the source: a tcx chain that ends in
TCX_NEXTfalls through totc_run()’s classic filters. But you generally don’t want to mix — pick one for a given system.Q: Does mprog also exist for XDP?
A: There’s
xdp_multi-attach but the abstraction is slightly different (XDP doesn’t use mprog the same way). For XDP, multi-program is typically done with a “dispatcher” program in front andBPF_PROG_RUNtail calls. We won’t cover that today.
The lab
Refresher: __sk_buff direct packet access and PERCPU_ARRAY (Day 14, Day 16)
The firewall below reads packet bytes and the counter uses a per-CPU map. Both are concepts earlier days own — one line each:
struct __sk_buff+data/data_end(Day 16,day16.md:15-58,83-109):__sk_buffis the typed BPF view of the kernel’ssk_buff;data/data_endbound the packet window, and every pointer step must be re-bounds-checked before you dereference it — the same discipline as XDP. The terminal verdictsTC_ACT_OK/TC_ACT_SHOT/TC_ACT_REDIRECTcarry over from tc-bpf unchanged; only the chain-advance codeTCX_NEXTis new (above).BPF_MAP_TYPE_PERCPU_ARRAY(Day 14,day14.md:108,133,142,174-179): each CPU gets its own value slot, so the in-kernel increment needs no atomic; userspace must sum across all CPUs (libbpf_num_possible_cpus()) to get the true total.
tcx.bpf.c
Included from the source the lab build and CI compile. (TCX_NEXT is a BTF
enum from vmlinux.h; the terminal TC_ACT_* codes are defined locally
because <linux/pkt_cls.h> cannot be mixed with vmlinux.h.)
#include “vmlinux.h” #include <bpf/bpf_helpers.h> #include <bpf/bpf_endian.h>
/* TCX_NEXT (enum tcx_action_base) is a BTF enum, so it comes from vmlinux.h.
- The terminal TC_ACT_* verdicts are UAPI #defines that vmlinux.h does not
- carry, and <linux/pkt_cls.h> can’t be mixed with vmlinux.h (it redefines
- struct tc_stats etc.). Define the two we return locally. ETH_P_IP is a UAPI
- #define too; IPPROTO_UDP already comes from vmlinux.h. */ #define TC_ACT_OK 0 #define TC_ACT_SHOT 2 #define ETH_P_IP 0x0800
char LICENSE[] SEC(“license”) = “GPL”;
struct { __uint(type, BPF_MAP_TYPE_PERCPU_ARRAY); __uint(max_entries, 2); __type(key, __u32); __type(value, __u64); } stats SEC(“.maps”);
static __always_inline void bump(__u32 idx) { __u64 *c = bpf_map_lookup_elem(&stats, &idx); if (c) (*c)++; }
SEC(“tcx/ingress”) int counter(struct __sk_buff skb) { (void)skb; bump(0); / count all / return TCX_NEXT; / DEFER: let the next link (firewall) decide */ }
SEC(“tcx/ingress”) int firewall(struct __sk_buff *skb) { void *data = (void *)(long)skb->data; void *end = (void *)(long)skb->data_end; struct ethhdr *eth = data; if (eth + 1 > end) return TCX_NEXT; if (eth->h_proto != bpf_htons(ETH_P_IP)) return TCX_NEXT; struct iphdr *ip = (void )(eth + 1); if (ip + 1 > end) return TCX_NEXT; if (ip->protocol == IPPROTO_UDP) { bump(1); return TC_ACT_SHOT; / DECIDE: drop the UDP datagram, stop the chain / } return TCX_NEXT; / DEFER on everything else */ }
Two design points, both consequences of tcx_run():
counterreturnsTCX_NEXT, notTC_ACT_OK. This is the correction that makes the lab work. IfcounterreturnedTC_ACT_OK(=0=TCX_PASS),tcx_run()would seeret != TCX_NEXT,breakafter the first program, andfirewallwould never run —udp_dropwould stay0forever. ReturningTCX_NEXTis what lets the chain advance tofirewall.firewallreturnsTCX_NEXTfor traffic it doesn’t care about (non-IP, non-UDP) and the terminalTC_ACT_SHOTonly for the UDP it actually drops. Sincefirewallis last in the chain, itsTCX_NEXTfalls through to classictc(here: nothing), which accepts the packet — exactly what we want for the ICMP we’re letting through.
Attach via tcx, ordered
The loader is built as ./tcx; the listing is included from the source
the lab build and CI compile:
#include <errno.h> #include <net/if.h> #include <signal.h> #include <stdio.h> #include <string.h> #include <unistd.h>
#include <bpf/bpf.h> #include <bpf/libbpf.h>
#include “tcx.skel.h” /* generated from tcx.bpf.o */
static volatile sig_atomic_t exiting;
static void handle_signal(int signal_number) { (void)signal_number; exiting = 1; }
static int install_signal_handlers(void) { const struct sigaction action = { .sa_handler = handle_signal, };
if (sigaction(SIGINT, &action, NULL) != 0 ||
sigaction(SIGTERM, &action, NULL) != 0) {
fprintf(stderr, "failed to install signal handlers: %s\n",
strerror(errno));
return -errno;
}
return 0;
}
static int sum_slot(int fd, __u32 key, int ncpu, __u64 *out) { __u64 vals[ncpu]; __u64 total = 0;
if (bpf_map_lookup_elem(fd, &key, vals) != 0)
return -1;
for (int i = 0; i < ncpu; i++)
total += vals[i];
*out = total;
return 0;
}
int main(int argc, char **argv) { struct tcx_bpf *skel = NULL; struct bpf_link l1 = NULL; / counter */ struct bpf_link l2 = NULL; / firewall */ unsigned int ifindex; int fd, ncpu; int err;
setvbuf(stdout, NULL, _IOLBF, 0);
if (argc < 2) {
fprintf(stderr, "usage: %s <iface>\n", argv[0]);
return 1;
}
ifindex = if_nametoindex(argv[1]);
if (!ifindex) {
fprintf(stderr, "if_nametoindex(%s): %s\n", argv[1], strerror(errno));
return 1;
}
err = install_signal_handlers();
if (err)
return 1;
skel = tcx_bpf__open_and_load();
if (!skel) {
fprintf(stderr, "failed to open and load tcx BPF skeleton\n");
return 1;
}
/* counter goes first */
LIBBPF_OPTS(bpf_tcx_opts, opts1);
l1 = bpf_program__attach_tcx(skel->progs.counter, ifindex, &opts1);
if (!l1) {
err = -errno;
fprintf(stderr, "attach counter failed: %s\n", strerror(errno));
goto cleanup;
}
/* firewall goes after counter */
LIBBPF_OPTS(bpf_tcx_opts, opts2, .flags = BPF_F_AFTER);
l2 = bpf_program__attach_tcx(skel->progs.firewall, ifindex, &opts2);
if (!l2) {
err = -errno;
fprintf(stderr, "attach firewall failed: %s\n", strerror(errno));
goto cleanup;
}
ncpu = libbpf_num_possible_cpus();
if (ncpu <= 0) {
fprintf(stderr, "libbpf_num_possible_cpus failed\n");
err = 1;
goto cleanup;
}
fd = bpf_map__fd(skel->maps.stats);
printf("tcx counter+firewall attached to %s; press Ctrl-C to stop.\n",
argv[1]);
while (!exiting) {
__u64 total = 0, udp_drop = 0;
sum_slot(fd, 0, ncpu, &total); /* key 0: all packets */
sum_slot(fd, 1, ncpu, &udp_drop); /* key 1: dropped UDP */
printf("total: %llu udp_drop: %llu\n", total, udp_drop);
if (sleep(2) != 0)
break;
}
err = 0;
cleanup: bpf_link__destroy(l2); /* detaches; FD-based */ bpf_link__destroy(l1); tcx_bpf__destroy(skel); return err != 0; }
Two programs, both at tcx-ingress. The counter runs first; because it returns TCX_NEXT, the chain advances and firewall runs after. (If counter had returned a terminal code such as TC_ACT_SHOT, the chain would stop and firewall would never see the packet — that’s the whole point of the verdict section above.)
Set up the topology
The lab needs an interface to attach to and real traffic crossing it. Build a veth pair with the far end in its own namespace — exactly as on Day 14:
sudo ip netns add ns1
sudo ip link add veth0 type veth peer name veth1
sudo ip link set veth1 netns ns1
sudo ip addr add 10.0.0.1/24 dev veth0
sudo ip link set veth0 up
sudo ip netns exec ns1 ip addr add 10.0.0.2/24 dev veth1
sudo ip netns exec ns1 ip link set veth1 up
Why the namespace? If both ends shared the root namespace, 10.0.0.2 would be a local address and the kernel would short-circuit ping 10.0.0.2 through lo — the packet would never cross the wire into veth1’s ingress, and neither counter nor firewall would ever run. Putting veth1 in ns1 forces traffic across the link. We attach inside ns1; pinging from the host sends packets out veth0, into veth1’s ingress where the tcx chain fires.
Inspect the chain
The attachments live on veth1, which is inside ns1, so query bpftool in that namespace:
sudo ip netns exec ns1 bpftool net show
You’ll see:
xdp:
tc:
veth1(3) tcx/ingress counter prog_id 5 link_id 3
veth1(3) tcx/ingress firewall prog_id 6 link_id 4
Note the prog_id and link_id columns — these are the mprog IDs. A link_id is the handle you reach for when you want to replace a program (Break 4 updates the link); a prog_id/link_id is what you pass as relative_id to position a new program BEFORE/AFTER an existing one. Keep this output in mind.
Run
make
sudo ip netns exec ns1 ./tcx veth1 &
# From the host (root namespace):
ping -c 3 10.0.0.2 # works (counter defers, firewall passes ICMP)
echo ping | nc -u -w1 10.0.0.2 9999 # blocked (firewall drops the UDP datagram)
The loader prints the summed per-CPU counters every 2 seconds. After the ping and the single UDP send:
total: 4 udp_drop: 1
The 3 ICMP packets arriving on veth1’s ingress plus the 1 UDP datagram make total: 4; the firewall drops that one UDP datagram, so udp_drop: 1. (The dropped datagram gets no reply, so there is nothing else to count.) This total: 4 udp_drop: 1 is exactly what proves the chain advanced past counter: if counter had ended the chain, firewall could never have incremented udp_drop.
The loader runs backgrounded under sudo, so Ctrl-C (delivered to the foreground process group) won’t reach it. Signal it directly:
sudo pkill -INT tcx # closing its bpf_link FDs auto-detaches both programs
sudo ip netns exec ns1 bpftool net show # the tcx entries on veth1 are now gone
Then tear down the topology:
sudo ip link del veth0 # deletes the pair (veth1 goes with it)
sudo ip netns del ns1 # remove the namespace
What to break, in order
Break 1 — Forget BPF_F_AFTER
Both programs use default flags. With no BPF_F_BEFORE/BPF_F_AFTER and no relative target, mprog defaults to appending after existing programs (bpf_mprog_attach sets idx = bpf_mprog_total(entry) and flags = BPF_F_AFTER, kernel/bpf/mprog.c). So the order ends up counter → firewall here by default — but don’t rely on it implicitly; pass BPF_F_BEFORE/BPF_F_AFTER to make ordering explicit. Inspect with bpftool net show to verify.
Break 2 — Pin the link
bpf_link__pin(l1, "/sys/fs/bpf/counter_link");
This is the bpffs pinning you met on Day 15 (sharing/keeping BPF objects alive across process lifetime, day15.md:193,197,234) and Day 03 (the /sys/fs/bpf pin/rm mechanics, day03.md:373). One line to carry forward:
Pinning creates a bpffs reference that keeps the link — and therefore the attachment — alive after the loader process exits; removing the pin drops that reference and detaches.
Now even if your loader exits, the link persists (the bpffs pin holds a reference). Useful for daemons that load BPF then exit. Watch it survive: with the loader still running, the counter shows up attached and as a pinned link object —
sudo ip netns exec ns1 bpftool net show # counter listed on veth1
sudo bpftool link show pinned /sys/fs/bpf/counter_link
Now stop the loader (sudo pkill -INT tcx). The unpinned firewall link detaches, but the pinned counter link survives — re-run both commands and the counter is still attached and still pinned, even though no process holds it. (bpffs must be mounted at /sys/fs/bpf, which is why these need sudo.) Detach it for real by removing the pin:
sudo rm /sys/fs/bpf/counter_link
sudo ip netns exec ns1 bpftool net show # counter now gone — hook empty
That before/after contrast is the whole point of pinning.
Break 3 — Mix XDP and tcx
Attach an XDP counter and a tcx counter to the same interface. Both run, in order: XDP first (no skb), tcx after (with skb). Useful pattern: XDP for raw drops, tcx for skb-aware logic.
Break 4 — Replace a link
To swap the program behind an existing tcx bpf_link, you update the link in place — you do hand over the link handle:
/* l1 is the bpf_link returned by bpf_program__attach_tcx for `counter`.
Swap its program for new_prog atomically, with no empty-hook window. */
int err = bpf_link__update_program(l1, skel->progs.new_prog); /* LINK_UPDATE */
This issues BPF_LINK_UPDATE. Inside the kernel, tcx_link_update() builds the mprog call for you — it does not ask you to name a neighbor. It targets the link’s current program explicitly (kernel/bpf/tcx.c:232):
/* kernel/bpf/tcx.c:232 — inside tcx_link_update() */
ret = bpf_mprog_attach(entry, &entry_new, nprog, link, oprog,
BPF_F_REPLACE | BPF_F_ID,
link->prog->aux->id, 0); /* old prog named by the link itself */
if (!ret)
oprog = xchg(&link->prog, nprog); /* :237 — atomic swap */
The kernel synthesizes BPF_F_REPLACE | BPF_F_ID against link->prog->aux->id internally and swaps via bpf_mprog_replace — there is no window where the hook is empty. The v7.1 selftest proves this is the only way: tc_links.c:718-759 asserts that a fresh attach carrying BPF_F_REPLACE fails (link_attach_should_fail), then performs the replace via bpf_link__update_program() (tc_links.c:759).
Why can’t a fresh bpf_program__attach_tcx replace a link’s program? Look at struct bpf_tcx_opts (tools/lib/bpf/libbpf.h:900) — its entire surface:
struct bpf_tcx_opts {
size_t sz;
__u32 flags;
__u32 relative_fd;
__u32 relative_id;
__u64 expected_revision;
};
#define bpf_tcx_opts__last_field expected_revision
There is no replace-target field. A fresh attach issues LINK_CREATE, whose uapi only carries relative_fd / relative_id / expected_revision (include/uapi/linux/bpf.h:1836-1839) — there is nowhere to name the program being replaced. On the link-create path the kernel passes prog_old = NULL into bpf_mprog_attach (kernel/bpf/mprog.c:225), so bpf_mprog_pos_exact() looks up a NULL program, returns -ENOENT, and the attach fails. That absent field is precisely why link replacement must go through bpf_link__update_program.
The two roles, untangled. relative_id / relative_fd (with BPF_F_ID / BPF_F_LINK) name a neighbor — and they are consumed only for BPF_F_BEFORE / BPF_F_AFTER. BPF_F_REPLACE names the target program, not via the relative tuple at all:
- In the non-link prog-attach API, the target is
attr->replace_bpf_fd(kernel/bpf/tcx.c:25-26). - In
LINK_UPDATE, the target is the link’s own current program (kernel/bpf/tcx.c:232, shown above).
The kernel resolves a relative neighbor through bpf_mprog_tuple_relative() (kernel/bpf/mprog.c:53):
/* kernel/bpf/mprog.c */
bool id = flags & BPF_F_ID; /* BPF_F_ID set? -> the u32 is an ID, not an fd */
...
if (!id && !id_or_fd) /* neither flag nor value -> "first/last position" */
return 0;
So the single u32 is interpreted as a program/link ID when BPF_F_ID is set (use relative_id), or as a file descriptor when it isn’t (use relative_fd) — but this addressing applies to the BEFORE/AFTER neighbor, never to the replace target.
What the flags do at attach time (kernel/bpf/mprog.c, inside bpf_mprog_attach; line numbers are the call sites in bpf_mprog_attach, with each helper’s definition in parentheses):
| Flag | Position helper | Effect |
|---|---|---|
BPF_F_BEFORE | bpf_mprog_pos_before (call :261, def :193) | insert before the named neighbor |
BPF_F_AFTER | bpf_mprog_pos_after (call :269, def :209) | insert after the named neighbor |
BPF_F_REPLACE | bpf_mprog_pos_exact (call :250, def :178) | swap out the exact named program |
| (none, no target) | default | idx = bpf_mprog_total(entry); flags = BPF_F_AFTER; (:281) — append at the end |
That last row is exactly the default Break 1 relies on.
expected_revision: optimistic concurrency. Each mprog entry carries a revision counter. If you pass a non-zero expected_revision that doesn’t match the live one, the attach fails:
/* kernel/bpf/mprog.c:240 */
if (revision && revision != bpf_mprog_revision(entry))
return -ESTALE;
This lets a chain manager notice that someone else changed the chain since it last looked, instead of blindly clobbering it. You can leave it 0 to opt out (as our lab does); pass the value you read to get a compare-and-swap. expected_revision rides along on a fresh LINK_CREATE attach — it is the one optimistic-concurrency knob bpf_tcx_opts exposes.
So Break 4 splits cleanly in two: to insert a program next to a neighbor you use BPF_F_BEFORE/BPF_F_AFTER with relative_id/relative_fd; to replace the program behind a link you call bpf_link__update_program(link, new_prog) and let the kernel swap link->prog atomically — no window where the hook is empty.
What to read in the kernel
kernel/bpf/tcx.c— the whole file is ~350 lines (346 in v7.1). Read it.kernel/bpf/mprog.c— the multi-program ordering machinery. Used by tcx, netkit, and others. Readbpf_mprog_attach(:225) andbpf_mprog_tuple_relative(:53) to see the BEFORE/AFTER/REPLACE and ID-vs-fd logic from Break 4.net/core/dev.c—tcx_run(:4439) andsch_handle_ingress(:4459). This is where theTCX_NEXT-vs-terminal split and the fall-through totc_run()actually live.tools/lib/bpf/libbpf.c— searchbpf_program__attach_tcx. The userspace wrapper.tools/testing/selftests/bpf/prog_tests/tc_opts.c— extensive tcx tests.
Bullet Points
- tcx is the modern attach for tc-position BPF programs. Same hook position as tc-bpf classic, better lifecycle.
- Returns a
bpf_linkFD; closing it detaches (Day 14/16 ownership model). Pin into bpffs (Day 15/03) to survive loader exit. - The chain advances only on
TCX_NEXT(-1).tcx_run()doesif (ret != TCX_NEXT) break;— any other value, includingTC_ACT_OK(0), terminates the chain. Observability programs returnTCX_NEXTto defer; policy programs return a terminal verdict (TCX_PASS/TC_ACT_OK=0,TCX_DROP/TC_ACT_SHOT=2,TCX_REDIRECT=7) to decide and stop. - A trailing
TCX_NEXT(=TC_ACT_UNSPEC= -1) falls through to classictc_run()filters, not “accept.” - mprog orders multiple programs via attach-time flags:
BPF_F_BEFORE/BPF_F_AFTERposition a new program relative to a neighbor named byrelative_id(+BPF_F_ID) orrelative_fd.BPF_F_REPLACEis different — it names the target program directly (viareplace_bpf_fdin prog-attach, or the link itself inLINK_UPDATE/bpf_link__update_program), not via the relative tuple.expected_revisionis an-ESTALE-guarded compare-and-swap. Default with no target: append (BPF_F_AFTER). BPF_MAP_TYPE_PERCPU_ARRAY(Day 14): per-CPU slots, no atomic in kernel, sum across CPUs in userspace.- No
tc qdisc add clsactceremony — kernel installs the hook implicitly. - Inspect with
bpftool net show(it prints theprog_id/link_idyou feed to mprog). - For new code, always tcx, never classic tc-bpf.
Check question
You attach three programs to tcx-ingress on eth0, in order: count, firewall, log. You want every packet counted and logged, with firewall dropping UDP in between. What must count return so that firewall and log run at all — and what happens to a UDP packet versus a TCP packet as it walks the chain?
Click to reveal answer
Answer: count must return TCX_NEXT (-1). tcx_run() continues the chain only while each program returns TCX_NEXT; if count returned TC_ACT_OK (0 = TCX_PASS), the runner’s if (ret != TCX_NEXT) break; would fire and the chain would stop after count — firewall and log would never run. This is the opposite of the classic tc-bpf intuition where TC_ACT_OK means “proceed.”
For a TCP packet: count returns TCX_NEXT → firewall sees TCP, returns TCX_NEXT → log runs, returns TCX_NEXT → chain falls through to classic tc (and is accepted). All three programs ran.
For a UDP packet: count returns TCX_NEXT → firewall returns the terminal TC_ACT_SHOT (2 = TCX_DROP), which is != TCX_NEXT, so the chain stops there. log never runs for that packet, and the packet is dropped.
Lesson, corrected for tcx: order observability before policy, and make observability programs return TCX_NEXT (defer) — only the program that makes the final decision returns a terminal verdict, and that verdict short-circuits everything after it. If you put log after firewall, dropped UDP is never logged.
Tomorrow
Day 18: AF_XDP — bypass the kernel network stack entirely. Get raw packets to a userspace ring at 30+ Mpps per core.
Day 18 — AF_XDP: packets to userspace at line rate
Today’s mission: redirect raw packets from XDP to a userspace ring at line rate without copying. Build a tiny zero-copy packet receiver — and, on the way, finally learn the one mechanism the whole thing turns on: the lock-free shared ring. Total time: ~120 minutes. This builds directly on the XDP redirect machinery from Days 14–17 — if
bpf_redirect_map,ctx->rx_queue_index, and the XDP return-code model aren’t familiar, revisit Day 14 first.
Why bypass the stack
The Linux network stack is general-purpose. For most workloads that’s fine — sockets, retransmits, congestion control, all done for you. But for packet-processing apps (DPI, custom load balancers, network testing, telemetry pipelines), the stack adds overhead you don’t want: skb allocation, protocol parsing you’ll redo anyway, syscalls per packet.
AF_XDP is the kernel’s answer to DPDK: packet receive directly into userspace-managed rings, with no syscalls in the steady-state receive loop (with the XDP_USE_NEED_WAKEUP flag the driver may ask you to poll()/recvfrom() to wake it — see below). On NICs and drivers with zero-copy support, packets DMA directly into UMEM; otherwise AF_XDP still works in copy mode with lower throughput.
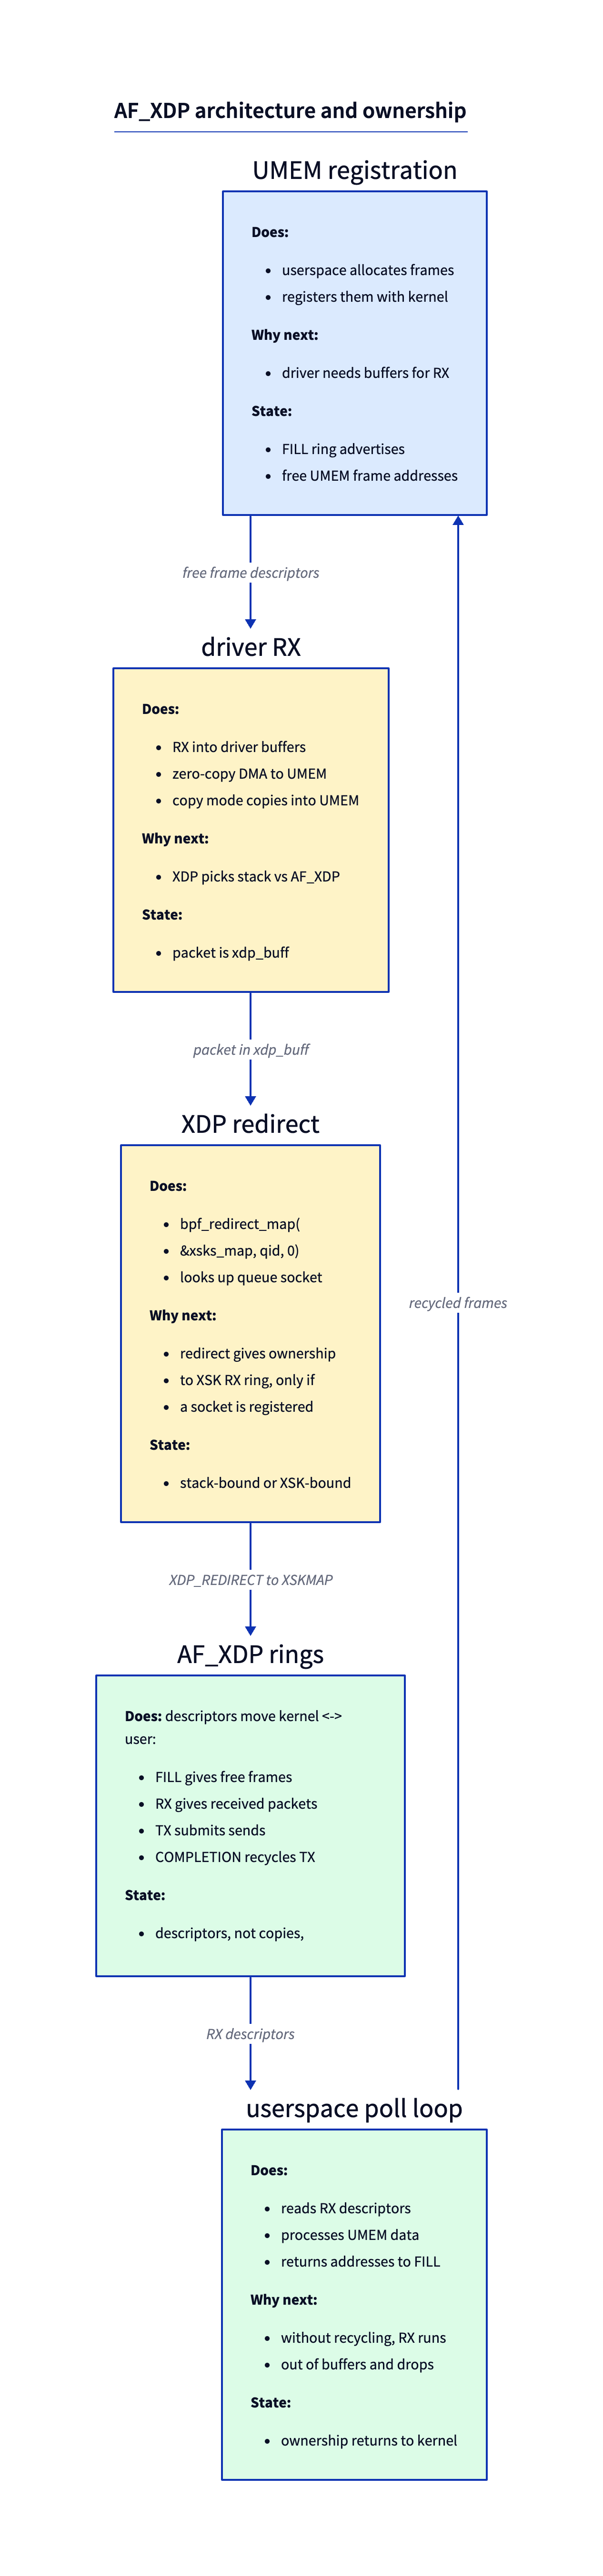
The trick: userspace pre-allocates a memory region (UMEM) and registers it with the kernel. In zero-copy mode, the NIC driver DMAs incoming packets directly into that memory. In copy mode, the kernel copies packet data into UMEM but keeps the same ring and descriptor model. An XDP program redirects to an AF_XDP socket bound to that UMEM, and userspace polls descriptors pointing into UMEM.
Throughput on supported zero-copy NICs can reach 30+ Mpps per core. A veth lab is still useful for learning the lifecycle, but it demonstrates functional/copy-mode behavior rather than NIC DMA zero-copy performance.
Today’s lab leans on four ideas the previous chapters never taught. Rather than hand you libxdp wrappers and hope, we’ll build each one up before we use it:
- What a lock-free single-producer/single-consumer ring actually is — the producer index, the consumer index, and the reserve/submit/peek/release dance. This is the abstraction; everything else is plumbing around it.
- UMEM — the chunked frame pool: what a descriptor address really means (spoiler: it’s an offset, not a pointer) and who owns each frame at each instant.
BPF_MAP_TYPE_XSKMAP— a map whose values are live sockets, the redirect target.- The AF_XDP socket itself — the real
socket()/setsockopt()/bind()/mmap()sequence that libxdp wraps.
We’ll teach each as we hit the part of the lab that depends on it. By the end you’ll be able to read net/xdp/xsk_queue.h and know exactly what every barrier is fighting against.
The ring: one array, two counters, no lock
Stop. Before any of the four rings makes sense, you have to know what a ring is — because the chapter keeps saying “user and kernel both advance their pointers, no syscalls needed,” and that sentence is doing enormous work.
The intuition. A ring is a fixed-size array plus two 32-bit counters:
- a producer index — where the writer will drop the next entry;
- a consumer index — where the reader will take the next entry.
The array is treated as circular: you mask the index down to the array size to get a slot. The ring is empty when producer == consumer and full when producer - consumer == size. That’s the entire state. No lock, no list, no allocation — just two counters chasing each other around a circular array.
The magic property is single-producer, single-consumer: each ring has exactly one writer and exactly one reader. When there is only one of each, and they each only ever advance their own counter, you don’t need a lock — you need a couple of memory barriers (more on that in a moment). And crucially, the two sides sit on opposite sides of the user/kernel boundary. One side is your program; the other side is the kernel. Both counters live in memory that both sides have mapped, so advancing a counter is just a memory write — no syscall.
That last sentence is the whole reason AF_XDP can do millions of packets per second. In the steady state, receiving a packet is: read a counter, read a descriptor, write a counter. No read(), no context switch, no copy. The syscall is amortised away.
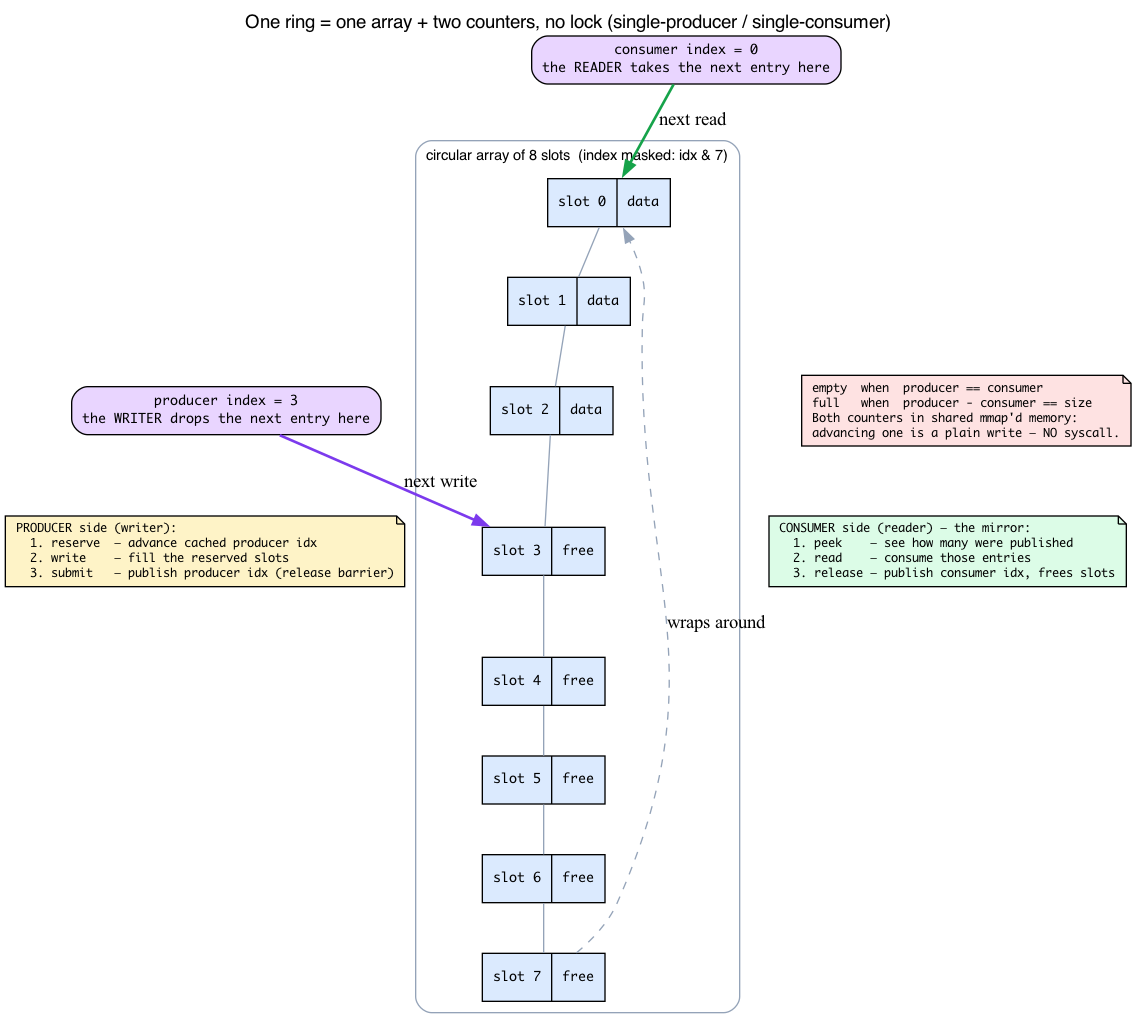
The two-step producer protocol, and its mirror
You never write a slot and bump the producer index in one motion, because the reader could observe the new index before your data lands. Instead both sides use a two-step protocol.
Producer side (the writer):
- reserve N slots — advance a local cached copy of the producer index, reserving room. Nothing is published yet.
- write the N entries into those slots.
- submit — publish the real producer index with a release barrier, so the other side sees the data only after it has been written.
Consumer side (the reader) — the mirror:
- peek N available entries — see how many the producer has published.
- read them.
- release — publish the consumer index, telling the producer those slots are free again.
In libxdp these are exactly xsk_ring_prod__reserve / __submit on the producer side and xsk_ring_cons__peek / __release on the consumer side — names you’ll see all over the lab. When the code does reserve → fill_addr → submit, that’s the producer protocol; when it does peek → rx_desc → release, that’s the consumer protocol. They are not arbitrary libxdp ceremony; they are the ring contract.
What this looks like in v7.1
The kernel’s ring header is net/xdp/xsk_queue.h — 508 lines total, which is why this chapter calls it “tight, copy-this-pattern” code. The shared state is a struct xdp_ring:
/* net/xdp/xsk_queue.h:16 */
struct xdp_ring {
u32 producer ____cacheline_aligned_in_smp; /* line 17 */
/* Hinder the adjacent cache prefetcher to prefetch the consumer
* pointer if the producer pointer is touched and vice versa.
*/
u32 pad1 ____cacheline_aligned_in_smp;
u32 consumer ____cacheline_aligned_in_smp; /* line 22 */
u32 pad2 ____cacheline_aligned_in_smp;
u32 flags;
u32 pad3 ____cacheline_aligned_in_smp;
};
There they are: a producer counter and a consumer counter, nothing else. Notice ____cacheline_aligned_in_smp on each, and read the comment: the producer and consumer are deliberately placed on separate cache lines so the two sides don’t ping-pong a shared line. (The CPU moves memory in 64-byte lines, so if the writer’s counter and the reader’s counter shared a line, every update on one side would invalidate the other side’s cached copy. The padding stops even the adjacent-line prefetcher from cross-touching them. The companion linux-net book, Day 1, covers cache lines in full.)
Two flavors of ring share that header. The RX and TX rings carry full descriptors; the FILL and COMPLETION rings carry bare 64-bit addresses:
/* net/xdp/xsk_queue.h:29 — RX and TX: descriptor rings */
struct xdp_rxtx_ring {
struct xdp_ring ptrs;
struct xdp_desc desc[] ____cacheline_aligned_in_smp;
};
/* net/xdp/xsk_queue.h:35 — FILL and COMPLETION: bare u64 addresses */
struct xdp_umem_ring {
struct xdp_ring ptrs;
u64 desc[] ____cacheline_aligned_in_smp;
};
The kernel’s own bookkeeping per ring is struct xsk_queue, and it keeps cached copies of the peer’s index so it doesn’t have to re-read the other side’s counter on every single entry:
/* net/xdp/xsk_queue.h:40 */
struct xsk_queue {
u32 ring_mask;
u32 nentries;
u32 cached_prod; /* line 43 */
u32 cached_cons; /* line 44 */
struct xdp_ring *ring;
/* ... */
};
cached_prod/cached_cons are the same trick libxdp uses on the userspace side: peek once, process a whole batch, then publish once. Re-reading the peer counter per entry would bounce a cache line across the user/kernel boundary every iteration.
The barriers are why you use the wrappers
The header carries a long comment (lines 62–84) explaining the exact memory ordering, drawn straight from Documentation/core-api/circular-buffers.rst:
* producer consumer
*
* if (LOAD ->consumer) { (A) LOAD.acq ->producer (C)
* STORE $data LOAD $data
* STORE.rel ->producer (B) STORE.rel ->consumer (D)
* }
Read it as: the producer must write the data before publishing the new producer index (B), and the consumer must read the index before the data (C). Get this wrong and the consumer loads stale or garbage frames — it sees the index move and races ahead of the bytes. This is precisely why you call libxdp’s reserve/submit/peek/release wrappers instead of poking the counters yourself: the wrappers contain the right acquire/release barriers. Hand-rolling the index arithmetic is the classic way to ship a receiver that works on x86 (strongly ordered) and corrupts packets on arm64 (weakly ordered).
The ring quartet
Now the four rings make sense, because each is just one of these single-producer/single-consumer rings, and the only question is which side is the producer:
- FILL ring (user → kernel): userspace produces, kernel consumes. “Here are free buffers in UMEM you can DMA into.”
- RX ring (kernel → user): kernel produces, userspace consumes. “Here are packets I just received.”
- TX ring (user → kernel): userspace produces, kernel consumes. “Send these for me.”
- COMPLETION ring (kernel → user): kernel produces, userspace consumes. “TX done; recycle these buffers.”
That’s the directionality the kernel comment spelled out: for the RX and completion ring, the kernel is the producer and userspace is the consumer; for the TX and fill rings, the kernel is the consumer and userspace is the producer. User and kernel both advance their own counters; no syscalls needed in the steady state. (You do call sendto() to kick TX after enqueueing, but the kernel handles batching.)
UMEM: the frame pool the rings point into
The rings carry addresses. Addresses of what? Of frames in UMEM — and UMEM has more structure than “a memory region.” You can’t understand Break 1 or Break 2 without it, because both are about frame ownership.
The intuition. UMEM is one big, page-aligned userspace buffer that you allocate once (the lab uses posix_memalign(&buffer, 4096, …)) and register with the kernel once via the XDP_UMEM_REG setsockopt. After registration, the NIC driver is allowed to DMA packet bytes directly into your pages. That’s the “zero copy”: as Day 14 recapped, the NIC’s DMA engine normally writes incoming frames straight into driver-owned RX-ring pages — here the DMA target is your registered UMEM instead of kernel skb pages, so the bytes never get copied on their way to your program. (The companion linux-net book, Day 1, derives the DMA/RX-ring machinery in full.)
UMEM is carved into equal-size chunks. One chunk is one frame. In the lab, FRAME_SIZE = 2048 and there are UMEM_NUM_FRAMES = 4096 of them. The registration struct says exactly this:
/* include/uapi/linux/if_xdp.h:84 */
struct xdp_umem_reg {
__u64 addr; /* start of the UMEM region */
__u64 len; /* total length */
__u32 chunk_size; /* size of one frame, e.g. 2048 */
__u32 headroom; /* bytes reserved before each packet */
__u32 flags;
__u32 tx_metadata_len;
};
headroom reserves bytes before the packet in each chunk for your own metadata or encapsulation (the same idea as the kernel’s NET_SKB_PAD skb headroom — see the companion linux-net book, Day 1 — but here it’s under your control). chunk_size bounds the largest single-buffer packet; bigger packets chain multiple frames via a continuation bit (below).
A descriptor address is a byte offset, not a pointer
This is the part that trips everyone. When the lab pre-fills the FILL ring it writes i * FRAME_SIZE, and when it reads an RX descriptor it does xsk_umem__get_data(buffer, addr). Why the multiply, why the helper?
Because a descriptor address is a u64 byte offset into UMEM, not a memory pointer. Frame i lives at offset i * FRAME_SIZE. To turn an offset back into a usable pointer you add it to the base of your UMEM mapping — which is exactly what xsk_umem__get_data(buffer, addr) does (buffer + addr). The rings can carry plain u64s precisely because they’re offsets, not addresses; that’s also why a FILL/COMPLETION entry is a bare __u64:
/* include/uapi/linux/if_xdp.h:166 */
struct xdp_desc {
__u64 addr;
__u32 len;
__u32 options;
};
/* UMEM descriptor is __u64 (the comment right below xdp_desc) */
The RX/TX rings carry the full xdp_desc (offset + the real packet len the driver fills in); the FILL/COMPLETION rings carry just the __u64 offset. There’s one wrinkle worth a sentence: in unaligned mode the high bits of addr pack a second offset, which is why there’s a shift constant — XSK_UNALIGNED_BUF_OFFSET_SHIFT 48 and XSK_UNALIGNED_BUF_ADDR_MASK (if_xdp.h:116). Mention it, don’t dwell; the lab uses aligned mode.
Multi-buffer packets (a packet larger than chunk_size) chain frames using a continuation bit in desc->options:
/* include/uapi/linux/if_xdp.h:179 */
#define XDP_PKT_CONTD (1 << 0)
Frame ownership is a cycle — and the breaks are about breaking it
Here is the mental model that makes Break 1 and Break 2 obvious. Every frame has exactly one owner at every instant, and ownership moves in a cycle through the four rings:
- Userspace puts a free frame’s offset on the FILL ring → now the driver owns it.
- The driver DMAs a packet into it → still driver-owned, now full.
- The driver hands it to userspace on the RX ring (with the real packet length) → now userspace owns it.
- Userspace processes the bytes, then returns the same offset to the FILL ring → back to step 1.
Skip step 1 (never fill) and the driver never had any frames → Break 1: empty RX ring. Skip step 4 (never recycle) and the driver runs out of frames → Break 2: starvation drops.
That’s the whole lifecycle. When the driver has no frame to DMA into, the kernel counts a drop — xs->rx_dropped++ (net/xdp/xsk.c:313 and :330) and xs->rx_queue_full++ (:199, :334) — which is the kernel side of the two breaks you’re about to run.
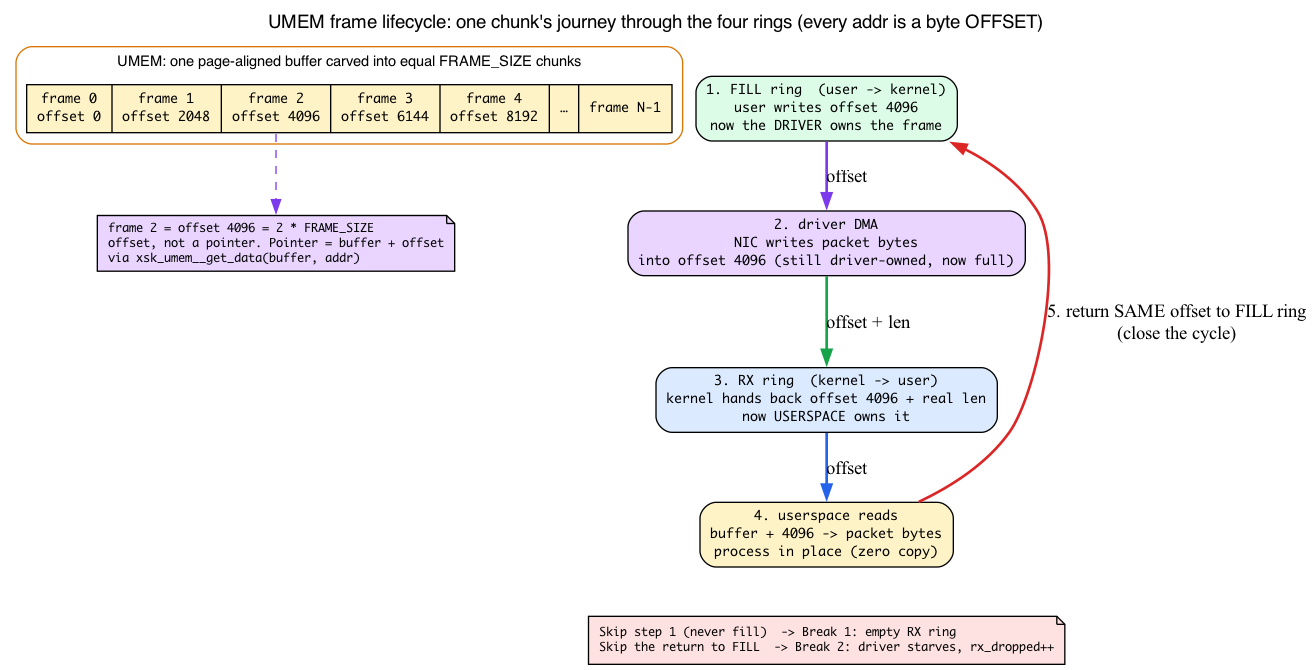
One more thing that surprises people: the four rings are not inside UMEM. UMEM holds packet bytes; the rings hold descriptors (offsets into UMEM). The rings are separate kernel-allocated buffers that you mmap into your address space at fixed page offsets — which is why the UAPI defines distinct offsets for each:
/* include/uapi/linux/if_xdp.h:110 */
#define XDP_PGOFF_RX_RING 0
#define XDP_PGOFF_TX_RING 0x80000000
#define XDP_UMEM_PGOFF_FILL_RING 0x100000000ULL
#define XDP_UMEM_PGOFF_COMPLETION_RING 0x180000000ULL
Four different mmap offsets = four separately mapped rings, all distinct from the UMEM region itself.
XDP and AF_XDP cooperate
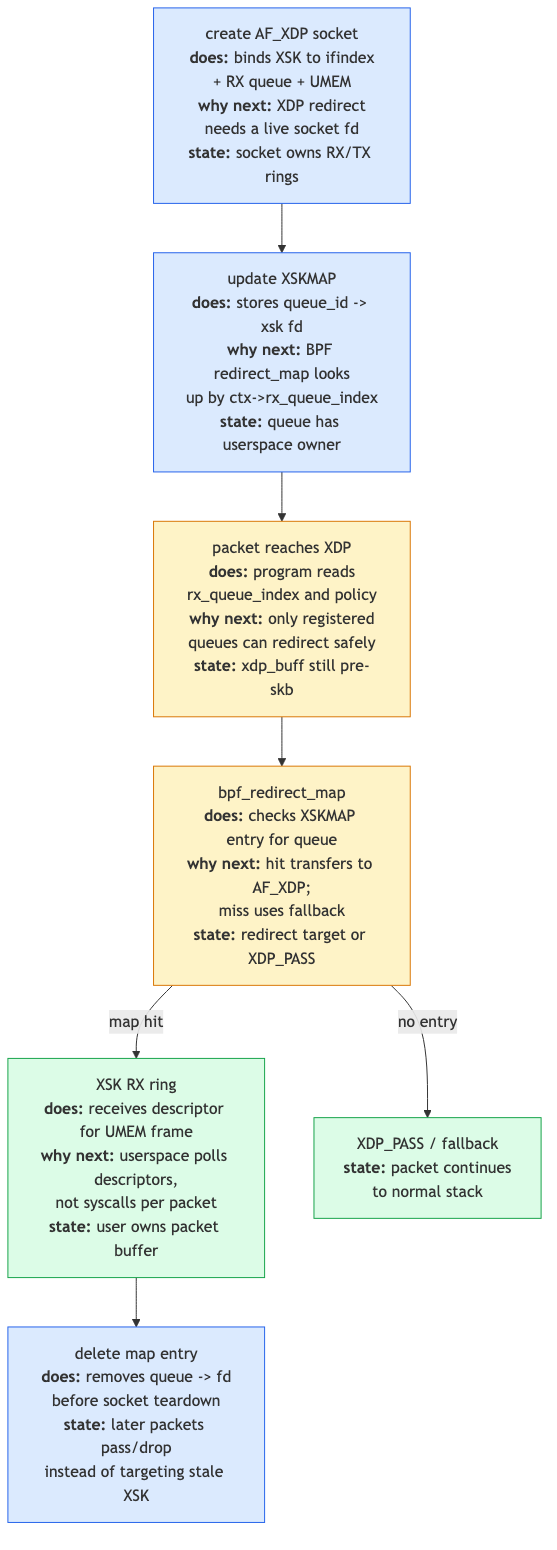
The XDP program decides per packet: pass to stack, drop, or redirect to an AF_XDP socket. But how does an XDP program — running in the kernel before any skb exists — name a userspace socket? Through a map type you haven’t met yet.
BPF_MAP_TYPE_XSKMAP — a map whose values are sockets
On Days 14–15 your map values were plain data: a PERCPU_ARRAY of counters, an LPM_TRIE of prefixes. An XSKMAP is different in kind: its value slot holds a reference to a live AF_XDP socket. You write a socket’s file descriptor into the map from userspace, and the kernel stores a refcounted pointer to the underlying xdp_sock. Inserting that fd is what arms a queue for redirect.
The key is always a 4-byte queue index — the kernel enforces this at map-creation time:
/* net/xdp/xskmap.c:64 */
static struct bpf_map *xsk_map_alloc(union bpf_attr *attr)
{
/* :70 */
if (attr->max_entries == 0 || attr->key_size != 4 ||
attr->value_size != 4 || ...)
return ERR_PTR(-EINVAL);
/* :76 — an array of socket slots, sized by max_entries */
size = struct_size(m, xsk_map, attr->max_entries);
So an XSKMAP is an array of socket slots indexed by u32 queue index, max_entries of them. The redirect decision is a single helper:
SEC("xdp")
int xdp_redirect_to_xsk(struct xdp_md *ctx) {
return bpf_redirect_map(&xsks_map, ctx->rx_queue_index, 0);
}
bpf_redirect_map(&xsks_map, queue_index, flags) looks up the socket bound at that queue and, if one is present, steers the raw frame to that socket’s RX ring before any skb is built. If the slot is empty, the program falls through to XDP_PASS — which is exactly the lookup-then-redirect guard in xsk.bpf.c below. The kernel path a hit drives into is __xsk_map_redirect(struct xdp_sock *xs, struct xdp_buff *xdp) (net/xdp/xsk.c:472). Like other redirect maps, XSK redirects are batched and flushed at the end of the NAPI poll rather than one-at-a-time: see the lh_xsk flush list and __xsk_map_flush(lh_xsk) in net/core/filter.c (lines 4360 and 4368).
Why ctx->rx_queue_index as the key? Because it’s the natural one: RSS/RPS already spreads incoming packets across the NIC’s RX queues, so keying the map by queue index lands each queue’s packets in its own socket (and its own thread). One socket per RX queue is the canonical pattern, and it’s exactly what Break 3 scales out.
Lifecycle ordering matters, and teardown depends on it. You must insert the fd after the socket is created and bound, and bpf_map_delete_elem the entry before destroying the socket — otherwise the map holds a dangling reference to a freed socket. That’s why the lab deletes the map entry before xsk_socket__delete. (Contrast with earlier maps: PERCPU_ARRAY and LPM_TRIE store plain bytes; XSKMAP — like PROG_ARRAY and DEVMAP — stores kernel-object references and exists specifically to be a redirect target.)
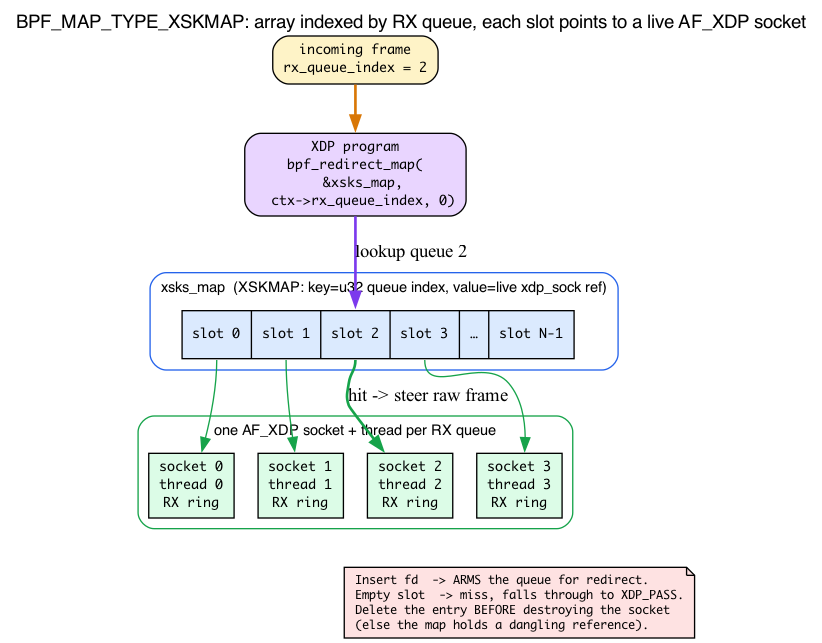
There are no Dumb Questions
Q: Is this DPDK?
A: Conceptually similar (kernel-bypass, zero-copy, polled rings) but cooperative with the kernel rather than commandeering the NIC. AF_XDP keeps the driver in the kernel; DPDK takes the device entirely. AF_XDP is easier to install/maintain and supports per-queue split (some queues to AF_XDP, others to the kernel stack).
Q: Can I run AF_XDP on any NIC?
A: There’s zero-copy mode for NICs with explicit driver support (Mellanox mlx5, Intel ice/i40e/ixgbe/igb/igc, Netronome nfp, stmmac, and a growing list). For unsupported NICs — including common Realtek r8169 desktop parts, which have no AF_XDP zero-copy path — “copy mode” works (one copy per packet) at lower throughput.
Q: This sounds complicated. Is there a tool I can use?
A:
xdp-toolsfrom the XDP project provides example senders/receivers.libxdp(a sister to libbpf) wraps the AF_XDP plumbing. We’ll use libxdp’s helpers in the lab.
What libxdp is actually wrapping: the AF_XDP socket
The lab calls xsk_umem__create and xsk_socket__create and then admits “libxdp helps but doesn’t hide everything.” When a create fails — or when you go read xsk.c as instructed — those wrappers are a black box unless you’ve seen the raw API once. So here it is.
AF_XDP is a real socket address family. You get one with socket(AF_XDP, SOCK_RAW, 0). Everything xsk_socket__create does is a wrapper around this plus the steps below; knowing the sequence is what lets you debug a failed create.
-
socket(AF_XDP, SOCK_RAW, 0)→ a raw xsk fd. -
setsockopt(XDP_UMEM_REG, …)registers your UMEM (thexdp_umem_regstruct above), thenXDP_UMEM_FILL_RING/XDP_UMEM_COMPLETION_RINGsize its two rings, andXDP_RX_RING/XDP_TX_RINGsize the socket’s own rings. The optnames are fixed integers:/* include/uapi/linux/if_xdp.h:75 */ #define XDP_RX_RING 2 #define XDP_TX_RING 3 #define XDP_UMEM_REG 4 #define XDP_UMEM_FILL_RING 5 #define XDP_UMEM_COMPLETION_RING 6 #define XDP_STATISTICS 7 -
mmapeach ring into your address space at the fixedXDP_PGOFF_*offsets you saw above. This is the step that makes the producer/consumer counters shared memory — after the mmap, both you and the kernel see the sameproducer/consumerwords, which is the whole no-syscall premise. -
bind(fd, sockaddr_xdp, …)ties the socket to one(ifindex, queue_id):/* include/uapi/linux/if_xdp.h:48 */ struct sockaddr_xdp { __u16 sxdp_family; __u16 sxdp_flags; __u32 sxdp_ifindex; __u32 sxdp_queue_id; __u32 sxdp_shared_umem_fd; };sxdp_flagsselects the mode:XDP_ZEROCOPY(1<<2, require driver DMA into UMEM — fails if the driver can’t),XDP_COPY(1<<1, force the universal one-copy path), or default (let the kernel pick).sxdp_shared_umem_fdlets several sockets share one UMEM — that’s the multi-socket Break-3 pattern.
The wakeup flag the intro mentioned. XDP_USE_NEED_WAKEUP (if_xdp.h:27, 1<<3) makes the driver set XDP_RING_NEED_WAKEUP (if_xdp.h:57, 1<<0) in a ring’s flags when it has gone to sleep. When you see that bit, you must poll()/sendto()/recvfrom() to kick the driver awake. Without the flag you busy-poll the rings; with it you can sleep efficiently. That’s why the chapter says you still sometimes call into the kernel even though the steady state is syscall-free.
Stats, the driver-independent way. getsockopt(fd, SOL_XDP, XDP_STATISTICS, …) fills a struct xdp_statistics:
/* include/uapi/linux/if_xdp.h:93 */
struct xdp_statistics {
__u64 rx_dropped; /* dropped for other reasons */
__u64 rx_invalid_descs;
__u64 tx_invalid_descs;
__u64 rx_ring_full;
__u64 rx_fill_ring_empty_descs;
__u64 tx_ring_empty_descs;
};
This is exactly the socket-layer counter Break 2 recommends. The kernel side is xsk_getsockopt (net/xdp/xsk.c:1734), case XDP_STATISTICS (:1750), populating stats.rx_dropped from xs->rx_dropped (:1766).
Why poll() and sendto() Just Work on an xsk fd. Because AF_XDP plugs into the normal socket machinery: its proto_ops table wires up .poll = xsk_poll (xsk.c:1226, table at :1950) and .sendmsg = xsk_sendmsg (:1178, table at :1956). An xsk fd is a real socket, so the standard poll/sendto paths reach into the AF_XDP driver-wakeup logic.
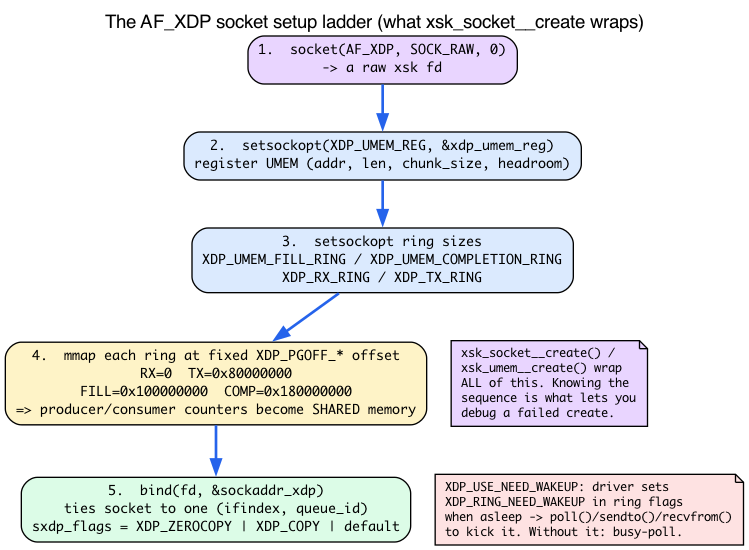
That’s the whole BPF side for AF_XDP, and now the whole socket side too — the rest of the work happens in the userspace receive loop.
The lab
This is the densest lab so far; budget the full time. Everything in the listings below is one of the four mechanisms you just learned: a ring operation, a UMEM offset, an XSKMAP insert, or a socket-setup call wrapped by libxdp.
Setup
# BPF + userspace build toolchain: clang/llvm compile the BPF object,
# bpftool generates vmlinux.h, libxdp/libbpf supply the AF_XDP ring + loader helpers.
sudo apt install clang llvm bpftool libxdp-dev libbpf-dev linux-headers-$(uname -r)
# On some distros bpftool ships in linux-tools-$(uname -r) / linux-tools-common instead.
# On a self-built kernel the matching linux-headers-$(uname -r) package may not exist
# in apt; use your in-tree headers (the kernel source you built from) instead.
Unlike the earlier network days, this lab links against libxdp (-lxdp) for the AF_XDP ring helpers in addition to libbpf. The repository’s lab build supplies the xdp/xsk.h include path and the -lxdp link flag for this day; the anchored listings below are the exact bytes it compiles.
The BPF object includes vmlinux.h, generated from the pinned vendored header by the lab build. If you compile it standalone instead, generate the header first with bpftool:
bpftool btf dump file /sys/kernel/btf/vmlinux format c > vmlinux.h
xsk.bpf.c
#include "vmlinux.h"
#include <bpf/bpf_helpers.h>
char LICENSE[] SEC("license") = "GPL";
struct {
__uint(type, BPF_MAP_TYPE_XSKMAP);
__uint(max_entries, 64);
__type(key, __u32);
__type(value, __u32); /* xsk fd */
} xsks_map SEC(".maps");
SEC("xdp")
int xsk_redirect(struct xdp_md *ctx)
{
__u32 q = ctx->rx_queue_index;
if (bpf_map_lookup_elem(&xsks_map, &q))
return bpf_redirect_map(&xsks_map, q, 0);
return XDP_PASS;
}
The if (bpf_map_lookup_elem(...)) guard is the “is a socket armed on this queue?” check we discussed: a hit redirects the raw frame into that socket’s RX ring; a miss falls through to XDP_PASS so the kernel stack still gets the packet.
xsk.c — userspace receiver (complete, buildable loader)
Unlike a reference sketch, this is the whole program the lab compiles and runs. It loads the XDP object through its skeleton, attaches it to the interface itself (trying native mode, then falling back to SKB/generic so it runs on veth and drivers without a native path), creates the UMEM and AF_XDP socket with libxdp, arms the XSKMAP slot, pre-fills the FILL ring, and runs the poll-driven receive/recycle loop until SIGINT/SIGTERM. Teardown removes the XSKMAP entry before destroying the socket, then detaches XDP.
Read it as four mechanisms stacked: the FILL/RX operations are the ring protocol (§“The ring”), i * FRAME_SIZE and xsk_umem__get_data are UMEM offsets (§“UMEM”), bpf_map_update_elem(map_fd, …) is the XSKMAP arm/disarm (§“XSKMAP”), and xsk_umem__create/xsk_socket__create are the socket setup ladder (§“socket”). It’s busier than previous labs because AF_XDP exposes the rings directly — libxdp helps but doesn’t hide everything. It passes XSK_LIBXDP_FLAGS__INHIBIT_PROG_LOAD so libxdp neither loads its own program nor manages the map: the loader owns both.
#include <errno.h>
#include <net/if.h>
#include <poll.h>
#include <signal.h>
#include <stdio.h>
#include <stdlib.h>
#include <string.h>
#include <unistd.h>
#include <linux/if_link.h>
#include <sys/socket.h>
#include <bpf/bpf.h>
#include <bpf/libbpf.h>
#include <xdp/xsk.h>
#include "xsk.skel.h"
#define UMEM_NUM_FRAMES 4096
#define FRAME_SIZE 2048
#define RX_BATCH_SIZE 64
#define FILL_RING_SIZE XSK_RING_PROD__DEFAULT_NUM_DESCS /* 2048 */
#define COMP_RING_SIZE XSK_RING_CONS__DEFAULT_NUM_DESCS /* 2048 */
static volatile sig_atomic_t exiting;
/* XDP attach mode actually used, remembered so teardown detaches with the
* same flags it attached with. */
static __u32 xdp_flags;
struct umem_info {
void *buffer;
struct xsk_ring_prod fq; /* FILL ring (user -> kernel) */
struct xsk_ring_cons cq; /* COMPLETION (kernel -> user) */
struct xsk_umem *umem;
};
struct xsk_info {
struct xsk_ring_cons rx;
struct xsk_ring_prod tx;
struct xsk_socket *xsk;
};
static void handle_signal(int signal_number)
{
(void)signal_number;
exiting = 1;
}
static int install_signal_handlers(void)
{
const struct sigaction action = {
.sa_handler = handle_signal,
};
if (sigaction(SIGINT, &action, NULL) != 0 ||
sigaction(SIGTERM, &action, NULL) != 0) {
fprintf(stderr, "failed to install signal handlers: %s\n",
strerror(errno));
return -errno;
}
return 0;
}
/* Attach the XDP program ourselves so we control the mode. Try native/driver
* mode first (fast path on real NICs and modern veth), then fall back to the
* universal SKB/generic mode so the lab still runs on drivers without a native
* XDP path. The flags that succeed are stored for the matching detach. */
static int attach_xdp(int ifindex, int prog_fd)
{
const __u32 modes[] = { XDP_FLAGS_DRV_MODE, XDP_FLAGS_SKB_MODE };
int err = -1;
for (size_t i = 0; i < sizeof(modes) / sizeof(modes[0]); i++) {
err = bpf_xdp_attach(ifindex, prog_fd, modes[i], NULL);
if (err == 0) {
xdp_flags = modes[i];
return 0;
}
}
fprintf(stderr, "failed to attach XDP program (native and skb): %s\n",
strerror(-err));
return err;
}
/* Prefill the FILL ring: producer protocol reserve -> write -> submit. Each
* entry is a byte OFFSET into UMEM (frame i lives at i * FRAME_SIZE), never a
* pointer. Skipping this is Break 1 (the driver never gets a frame to DMA
* into, RX stays empty). */
static int umem_prefill(struct umem_info *umem)
{
__u32 idx = 0;
__u32 got;
got = xsk_ring_prod__reserve(&umem->fq, FILL_RING_SIZE, &idx);
if (got != FILL_RING_SIZE) {
fprintf(stderr, "could not reserve FILL ring (%u/%u)\n", got,
(unsigned int)FILL_RING_SIZE);
return -1;
}
for (__u32 i = 0; i < got; i++)
*xsk_ring_prod__fill_addr(&umem->fq, idx + i) =
(__u64)i * FRAME_SIZE;
xsk_ring_prod__submit(&umem->fq, got);
return 0;
}
/* Return each consumed frame's offset to the FILL ring so the driver can DMA
* into it again. Skipping this is Break 2 (the driver starves after the pool
* drains and the kernel bumps rx_dropped / rx_queue_full). */
static void umem_recycle(struct umem_info *umem, const __u64 *addrs,
unsigned int n)
{
__u32 idx = 0;
unsigned int reserved;
reserved = xsk_ring_prod__reserve(&umem->fq, n, &idx);
for (unsigned int i = 0; i < reserved; i++)
*xsk_ring_prod__fill_addr(&umem->fq, idx + i) = addrs[i];
xsk_ring_prod__submit(&umem->fq, reserved);
if (reserved < n)
fprintf(stderr,
"FILL ring full: %u frame(s) not recycled this round\n",
n - reserved);
}
int main(int argc, char **argv)
{
struct umem_info umem = {0};
struct xsk_info xsk = {0};
struct xsk_bpf *skel = NULL;
struct xsk_umem_config umem_cfg = {
.fill_size = FILL_RING_SIZE,
.comp_size = COMP_RING_SIZE,
.frame_size = FRAME_SIZE,
.frame_headroom = 0,
.flags = 0,
};
struct xsk_socket_config xsk_cfg = {
.rx_size = XSK_RING_CONS__DEFAULT_NUM_DESCS,
.tx_size = XSK_RING_PROD__DEFAULT_NUM_DESCS,
.libxdp_flags = XSK_LIBXDP_FLAGS__INHIBIT_PROG_LOAD,
.xdp_flags = 0,
.bind_flags = XDP_USE_NEED_WAKEUP,
};
const size_t umem_size = (size_t)UMEM_NUM_FRAMES * FRAME_SIZE;
unsigned long long received = 0;
struct pollfd pfd;
int ifindex;
int xsk_fd = -1;
int map_fd = -1;
int xdp_attached = 0;
__u32 qid = 0;
int err;
setvbuf(stdout, NULL, _IOLBF, 0);
if (argc != 2) {
fprintf(stderr, "usage: %s <ifname>\n", argv[0]);
return 2;
}
ifindex = if_nametoindex(argv[1]);
if (ifindex == 0) {
fprintf(stderr, "unknown interface '%s': %s\n", argv[1],
strerror(errno));
return 1;
}
err = install_signal_handlers();
if (err)
return 1;
/* 1. Load the XDP redirect program and get the XSKMAP fd. */
skel = xsk_bpf__open_and_load();
if (!skel) {
fprintf(stderr, "failed to open/load xsk BPF skeleton\n");
return 1;
}
map_fd = bpf_map__fd(skel->maps.xsks_map);
/* 2. Attach XDP to the interface (native, else SKB). */
err = attach_xdp(ifindex, bpf_program__fd(skel->progs.xsk_redirect));
if (err)
goto cleanup;
xdp_attached = 1;
/* 3. Allocate page-aligned UMEM: NUM_FRAMES chunks of FRAME_SIZE. */
if (posix_memalign(&umem.buffer, sysconf(_SC_PAGESIZE), umem_size) != 0) {
fprintf(stderr, "posix_memalign(%zu) failed\n", umem_size);
err = 1;
goto cleanup;
}
/* xsk_umem__create wraps socket(AF_XDP) + setsockopt(XDP_UMEM_REG) and
sizes/mmaps the FILL (fq) and COMPLETION (cq) rings. */
err = xsk_umem__create(&umem.umem, umem.buffer, umem_size, &umem.fq,
&umem.cq, &umem_cfg);
if (err) {
fprintf(stderr, "xsk_umem__create failed: %s\n", strerror(-err));
goto cleanup;
}
/* 4. Create the AF_XDP socket bound to (ifname, queue 0). INHIBIT_PROG_LOAD
tells libxdp not to load/attach its own program or manage the map — we
own both. This wraps setsockopt(XDP_RX_RING/XDP_TX_RING), the ring
mmaps, and bind(sockaddr_xdp). */
err = xsk_socket__create(&xsk.xsk, argv[1], qid, umem.umem, &xsk.rx,
&xsk.tx, &xsk_cfg);
if (err) {
fprintf(stderr, "xsk_socket__create failed on %s queue %u: %s\n",
argv[1], qid, strerror(-err));
goto cleanup;
}
xsk_fd = xsk_socket__fd(xsk.xsk);
/* 5. Arm queue 0: insert the socket fd into the XSKMAP. The redirect only
fires AFTER this insert — that is what "arming" means. */
err = bpf_map_update_elem(map_fd, &qid, &xsk_fd, BPF_ANY);
if (err) {
fprintf(stderr, "failed to arm XSKMAP slot %u: %s\n", qid,
strerror(errno));
goto cleanup;
}
/* 6. Pre-fill the FILL ring so the driver has frames to DMA into. */
err = umem_prefill(&umem);
if (err)
goto cleanup;
printf("AF_XDP receiver up on %s (queue %u, %s mode); Ctrl-C to stop.\n",
argv[1], qid,
xdp_flags == XDP_FLAGS_DRV_MODE ? "native" : "skb");
pfd.fd = xsk_fd;
pfd.events = POLLIN;
/* 7. Receive loop: consumer protocol peek -> read -> release, then recycle
the frames back to the FILL ring to close the ownership cycle. */
while (!exiting) {
__u64 addrs[RX_BATCH_SIZE];
__u32 idx_rx = 0;
unsigned int n;
/* With XDP_USE_NEED_WAKEUP the driver may be asleep; poke it. */
if (xsk_ring_prod__needs_wakeup(&umem.fq))
recvfrom(xsk_fd, NULL, 0, MSG_DONTWAIT, NULL, NULL);
err = poll(&pfd, 1, 200);
if (err < 0) {
if (errno == EINTR)
continue;
fprintf(stderr, "poll failed: %s\n", strerror(errno));
goto cleanup;
}
if (err == 0)
continue;
n = xsk_ring_cons__peek(&xsk.rx, RX_BATCH_SIZE, &idx_rx);
if (n == 0)
continue;
for (unsigned int i = 0; i < n; i++) {
const struct xdp_desc *d =
xsk_ring_cons__rx_desc(&xsk.rx, idx_rx + i);
__u64 addr = d->addr; /* byte offset into UMEM */
__u32 len = d->len; /* real packet length */
const __u8 *pkt = xsk_umem__get_data(umem.buffer, addr);
addrs[i] = addr; /* remember for recycling */
received++;
if (len >= 6)
printf("rx %u bytes %02x:%02x:%02x:%02x:%02x:%02x ... "
"(total %llu)\n",
len, pkt[0], pkt[1], pkt[2], pkt[3], pkt[4], pkt[5],
received);
else
printf("rx %u bytes (short frame) (total %llu)\n", len,
received);
}
xsk_ring_cons__release(&xsk.rx, n);
umem_recycle(&umem, addrs, n);
}
err = 0;
cleanup:
/* Teardown order matters: remove the XSKMAP entry BEFORE destroying the
socket, or the map would hold a dangling reference to a freed socket. */
if (map_fd >= 0 && xsk_fd >= 0)
bpf_map_delete_elem(map_fd, &qid);
if (xsk.xsk)
xsk_socket__delete(xsk.xsk);
if (umem.umem)
xsk_umem__delete(umem.umem);
free(umem.buffer);
if (xdp_attached)
bpf_xdp_detach(ifindex, xdp_flags, NULL);
xsk_bpf__destroy(skel);
return err != 0;
}
Run
First build a topology. XDP/AF_XDP on veth1 only ever sees frames arriving into veth1, so the traffic has to originate from the peer end — we put that peer in its own namespace:
# Topology: veth0 (in lab netns) <-> veth1 (host, runs the AF_XDP receiver)
sudo ip netns add lab
sudo ip link add veth0 type veth peer name veth1
sudo ip link set veth0 netns lab
sudo ip netns exec lab ip addr add 10.0.0.1/24 dev veth0
sudo ip netns exec lab ip link set veth0 up
sudo ip addr add 10.0.0.2/24 dev veth1
sudo ip link set veth1 up
Now build and run the receiver, binding it to veth1:
make xsk
sudo ./.output/day18/xsk veth1
In another terminal, drive ingress into veth1 from the peer side:
sudo ip netns exec lab ping -c 5 10.0.0.2
You should see raw frame bytes / per-packet stats printed by the receiver. The XDP program redirects the ICMP echo requests to the AF_XDP socket before they reach the stack, so ping itself gets no replies — that’s expected; all you care about is that the receiver prints the frames it pulled off the RX ring. On veth, stop there: it proves the redirect/ring lifecycle. Use a supported physical NIC and driver before making zero-copy throughput claims with packet generators (pktgen, trafgen).
Tear down the lab when you’re done (this also removes the veth pair):
sudo ip netns del lab
What to break, in order
Each break severs one edge of the frame-ownership cycle you learned in the UMEM section. Keep that cycle in mind as you run them.
Break 1 — Forget the FILL ring
Skip the pre-fill (the FILL-ring pre-fill step, umem_prefill). You never hand the driver a single free frame, so it has nothing to DMA into — the cycle never gets its first frame. The RX ring stays empty and the receiver prints nothing. Confirm the pings are actually arriving with sudo tcpdump -ni veth1 icmp in another terminal — when tcpdump shows the echo requests but the receiver still prints nothing, you know the empty RX ring is caused by the missing FILL pre-fill, not by absent traffic. The FILL ring is your handshake to the driver.
Break 2 — Don’t recycle
Skip the “refill FILL ring” step in the polling loop (the recycle at the end of the receive loop, umem_recycle). Now you consume frames off the RX ring but never return their offsets — so after 4096 packets the FILL ring is empty and the driver has nowhere to DMA new frames. It drops them, and the kernel bumps rx_dropped/rx_queue_full (the counters at xsk.c:313/:330/:334 we saw earlier). Watch the per-queue drop counter climb in another terminal:
watch -n1 "ethtool -S veth1 | grep -E 'rx_queue.*drops'"
On veth, a redirect into a starved AF_XDP socket fails the xdp_do_redirect() call, and veth accounts that on the rx_drops counter — surfaced by ethtool as rx_queue_N_drops (see veth_xdp_rcv_one/veth_xdp_rcv_skb in drivers/net/veth.c, the XDP_REDIRECT case bumps stats->rx_drops on failure). Note that veth’s separate xdp_drops string counts only XDP_DROP/XDP_ABORTED returned by your program — it does not move on a redirect-to-starved-socket failure, so grep xdp_drops shows nothing here; grep drops (or the queue you bound to) instead. Physical drivers name and bucket these stats differently, which is why the next check is the portable one. A more direct, driver-independent check is to poll the socket’s own counters with getsockopt(xsk_fd, SOL_XDP, XDP_STATISTICS, &stats, &len) and watch stats.rx_dropped rise, since redirect-to-a-starved-socket drops are accounted at the socket layer regardless of driver. (That stats.rx_dropped is the struct xdp_statistics field at if_xdp.h:93, populated by xsk_getsockopt at xsk.c:1766 — the kernel side of this exact check.)
Break 3 — Multi-queue
Real NICs have multiple RX queues. Spawn one userspace thread per queue, one AF_XDP socket each, all in the xskmap (one socket per slot, keyed by queue index — exactly the XSKMAP layout from earlier; sockets can share one UMEM via sxdp_shared_umem_fd). RPS/RSS distributes packets across queues; bpf_redirect_map(&xsks_map, ctx->rx_queue_index, 0) sends each queue’s packets to its own socket, and each thread processes its queue independently. This is how you scale linearly with cores.
What to read in the kernel
net/xdp/xsk.c— the AF_XDP implementation. ~2100 lines. Read the top to understand the ring structures.net/xdp/xsk_queue.h— the lock-free ring code. Tight, copy-this-pattern level.include/uapi/linux/if_xdp.h— UAPI for AF_XDP rings, descriptors, configurations.tools/testing/selftests/bpf/xskxceiver.c— comprehensive AF_XDP test suite. Best example.tools/testing/selftests/bpf/xdp_hw_metadata.c— compact userspace AF_XDP example (UMEM +xsk_socket__create, diverts UDP into an AF_XDP socket).
Bullet Points
- A ring is a fixed-size array + a producer index and a consumer index (empty when equal, full when they differ by the size). Single-producer/single-consumer means no lock — just barriers. Both counters live in shared mmap’d memory, so advancing them is a plain memory write: no syscall, which is what makes line rate possible. Producer does reserve→write→submit; consumer does peek→read→release (
struct xdp_ring,xsk_queue.h:16, producer/consumer on separate cache lines). - AF_XDP is kernel-bypass for packet processing — polled rings and no syscalls in the steady-state receive loop (with
XDP_USE_NEED_WAKEUP, poll the driver when it sets the need-wakeup flag); zero-copy requires driver/NIC support. - Architecture: UMEM (a registered userspace buffer carved into fixed
chunk_sizeframes) + 4 rings (FILL, RX, TX, COMP) + XDP redirect. A descriptoraddris a byte offset into UMEM, not a pointer (xsk_umem__get_data(buf, addr)converts it). The rings are mmap’d separately from UMEM at theXDP_PGOFF_*offsets. - Frame ownership is a cycle: FILL → driver DMA → RX → userspace → back to FILL. Skip the start (Break 1) or the end (Break 2) and the driver starves; the kernel counts
rx_dropped/rx_queue_full. - BPF side is one line:
bpf_redirect_map(&xsks_map, ctx->rx_queue_index, 0). TheBPF_MAP_TYPE_XSKMAPis special: its values are live socket references (4-byte queue-index key), and inserting an fd is what arms a queue. Delete the entry before destroying the socket. - The AF_XDP socket is a real address family:
socket(AF_XDP)→setsockopt(XDP_UMEM_REG / ring sizes)→mmap(each ring)→bind(sockaddr_xdp: ifindex+queue+mode).xsk_socket__createwraps all of it.getsockopt(XDP_STATISTICS)returnsstruct xdp_statisticsfor driver-independent drop counts. - Throughput: 30+ Mpps per core is a supported-NIC zero-copy result; veth/copy mode is for functional learning.
- Use libxdp (
xsk.h) for ring helpers — itsreserve/submit/peek/releasecarry the right memory barriers; raw kernel UAPI is doable but verbose and easy to get wrong on weakly-ordered CPUs. - Modes: zero-copy (best), copy-mode (universal, slower). Cooperates with the kernel — you can split queues between AF_XDP and the kernel stack.
Check question
If you don’t refill the FILL ring, what’s the symptom?
Click to reveal answer
Answer: The kernel runs out of UMEM buffers to DMA new packets into. New packets are silently dropped at the driver level (an NIC stat increments). After the initial frames drain, the RX ring goes quiet even though traffic is still hitting the wire. In terms of the ownership cycle: you consumed frames off the RX ring but never returned their offsets to the FILL ring, so the driver has no free frame to DMA into. The “feed me more” half of the loop is FILL-ring refilling — every consumed packet’s address must be returned for reuse, or you starve the driver (this is Break 2, visible as rx_queue_N_drops via ethtool on veth or — portably across drivers — rx_dropped via getsockopt(XDP_STATISTICS)).
Tomorrow
Day 19: cgroup BPF and sockops — per-cgroup network policy and TCP tuning. Less hot-path, more configuration-plane.
Day 19 — cgroup BPF and sockops: policy at the socket layer
Today’s mission: filter network access per cgroup, then tune TCP behavior per cgroup. Learn what a cgroup v2 actually is, how a socket carries its cgroup with it, how the kernel turns your program’s return value into a packet verdict, and how one
sock_opsprogram gets re-entered at every step of a TCP handshake. End of Phase 3. Total time: ~110 minutes.
Above the packet, below the socket
Days 14–18 worked at the packet layer. Today goes higher: the socket and cgroup layers. Two related families:
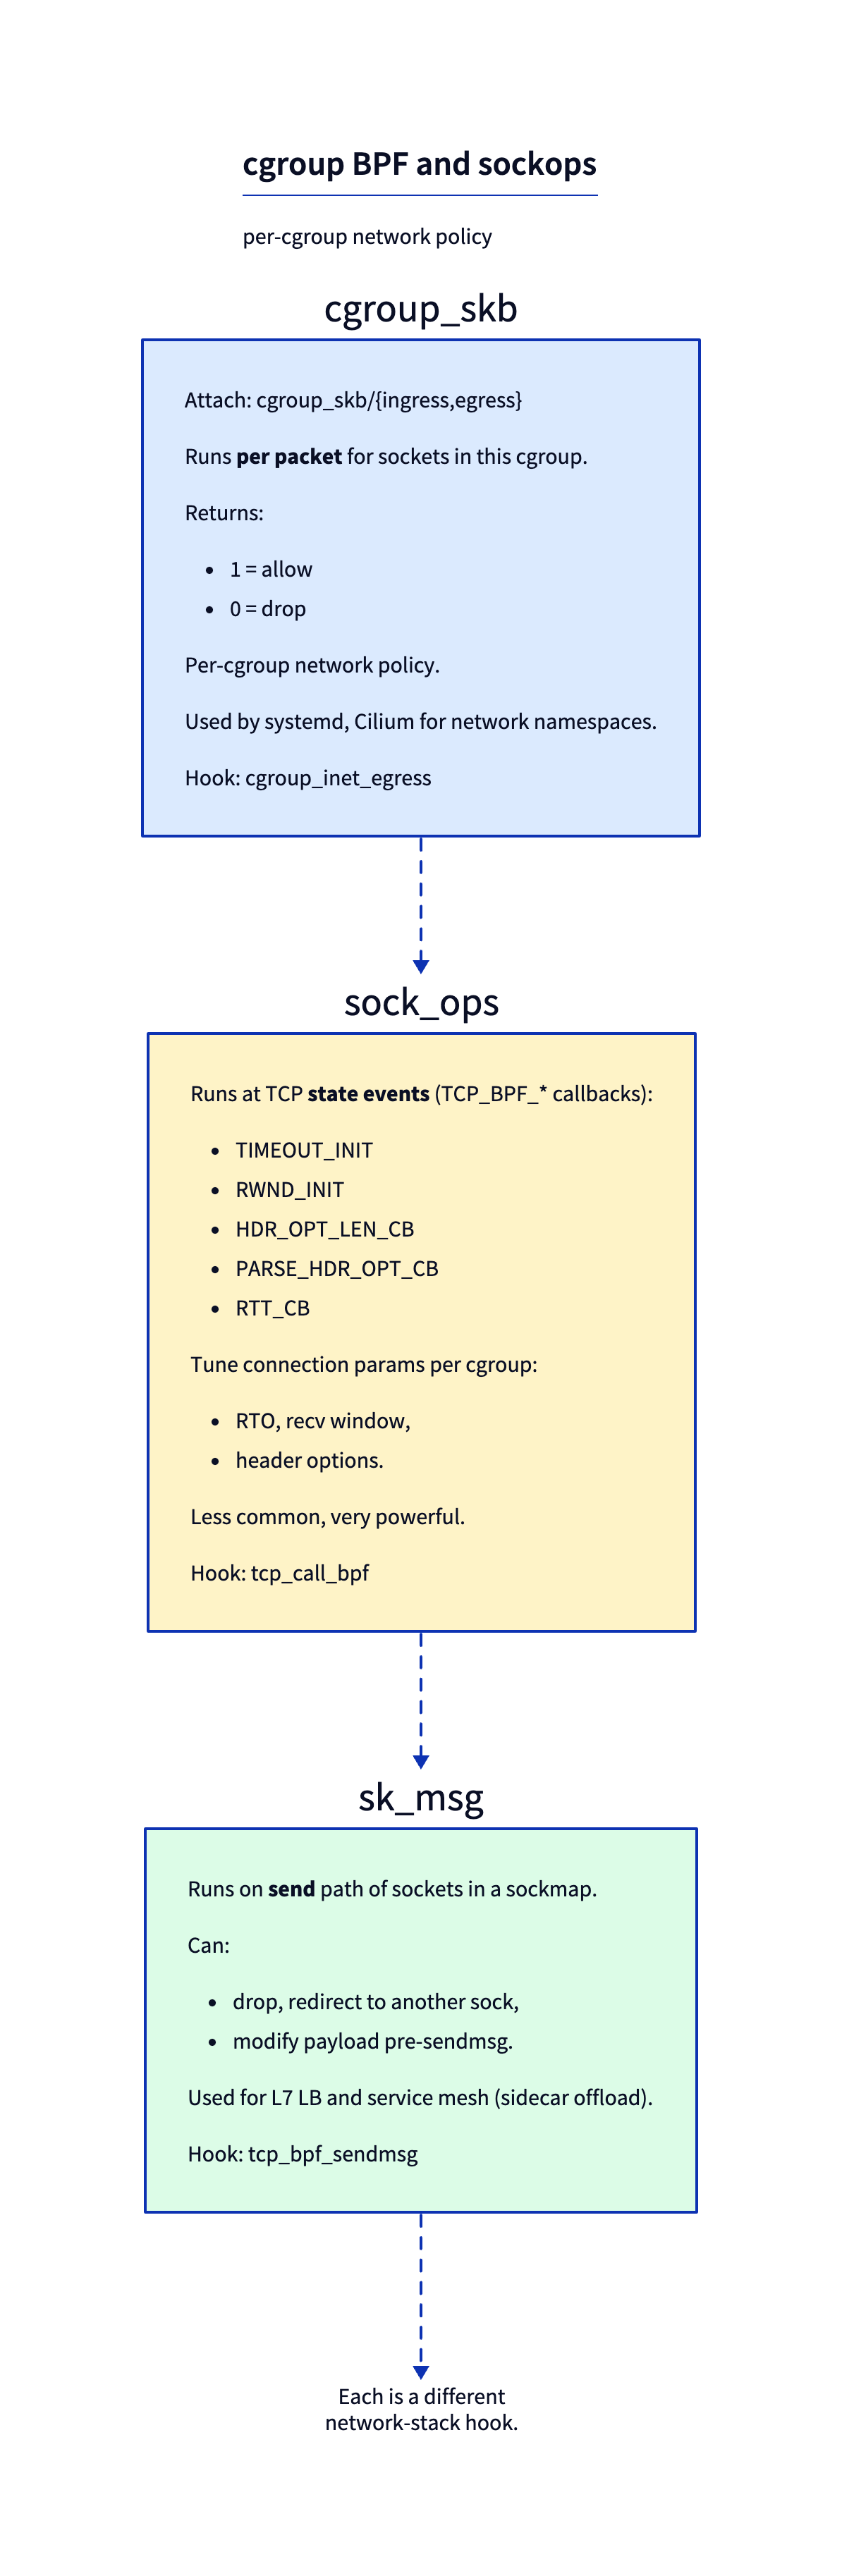
cgroup_skb— fires per-packet for sockets in a cgroup. Returns 0 (drop) or 1 (allow). Used for namespaced firewalls.sock_ops— fires at TCP state-machine events (connect, ESTABLISHED, RTT updates, header option negotiation). Tune connection params per cgroup.sk_msg— fires onsendmsgfor sockets in a sockmap; used for L7 load balancing (Cilium service mesh).cgroup_sock_addr— fires onconnect(),bind(),sendmsg()to UDP, etc. Modify sockaddr (do socket-level NAT).
These programs run in process context with the full non-sleepable helper set, so they can call helpers like bpf_setsockopt. (They are not sleepable — see can_be_sleepable() in the verifier if you ever need the exact list of program types that are.)
But every one of those program types rests on a single idea this chapter has to make solid first: a cgroup. Everything else today — why a packet’s egress program knows which policy applies to it, why a process that joins a directory is instantly subject to a firewall, why you can pick BBR for one set of connections and CUBIC for another — falls out of one fact about how Linux ties a socket to a cgroup. So we start there.
What a cgroup v2 actually is
You have heard “cgroups partition resources (CPU, memory, IO, network)” a hundred times. That sentence is true and useless. Here is the part that matters for BPF.
A cgroup v2 hierarchy is a single tree of directories, mounted once at /sys/fs/cgroup with filesystem type cgroup2. That word single is the whole point. Old cgroup v1 had a separate tree per controller — one mount for cpu, another for memory, another for net_cls — and a process could sit in different places in each tree at once. v2 collapsed all of that into one unified hierarchy: every process lives at exactly one node in one tree, and all controllers (cpu, memory, io, …) are just knobs enabled on the nodes of that one tree. When you mount | grep cgroup2 and see cgroup2 on /sys/fs/cgroup type cgroup2, you are looking at the root of that single tree.
Each directory is a cgroup. Membership is a file. Make a directory under /sys/fs/cgroup and you have created a child cgroup. Inside it the kernel materializes control files — cgroup.procs, cgroup.controllers, and so on. The one that matters today is cgroup.procs: writing a PID into a cgroup’s cgroup.procs file moves that task (and all its threads) into that cgroup. That is literally all membership is — a number written into a file. When a controlled child runs echo $$ > "$CG/cgroup.procs", $$ is that child shell’s PID and the write relocates only that child into the owned cgroup. Membership can be changed again with another cgroup.procs write, but this lab deliberately leaves your interactive shell untouched.
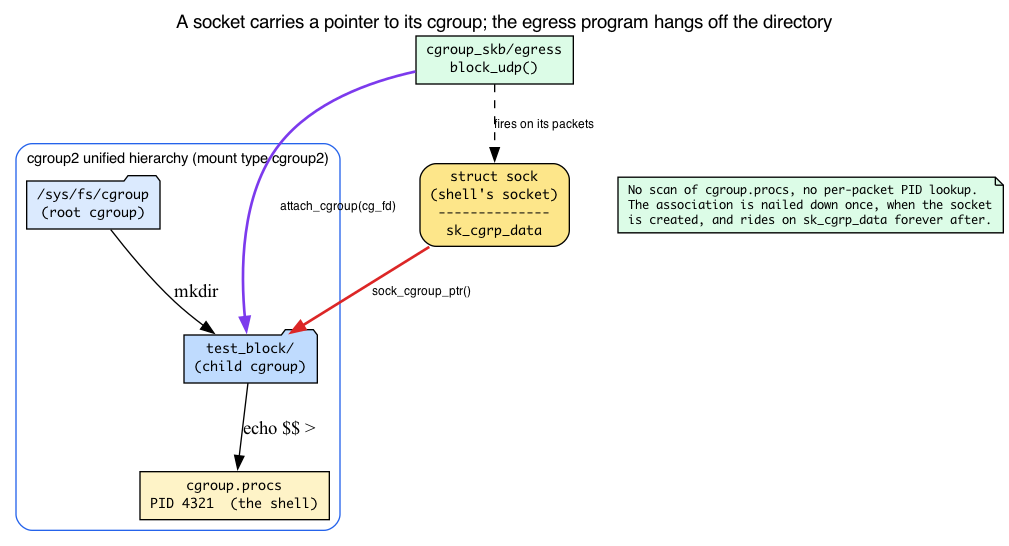
How a packet’s program knows which cgroup it belongs to
Here is the question the old version of this chapter waved away. The “Dumb Questions” answer below asserts “the kernel knows which cgroup the destination socket belongs to.” How? It is not magic, and it is not a lookup. It is a pointer stored on the socket.
Every socket records the cgroup of the task that created it. The kernel embeds a small struct directly inside struct sock:
/* include/linux/cgroup-defs.h:920 */
/* sock_cgroup_data is embedded at sock->sk_cgrp_data and contains
* per-socket cgroup information except for memcg association. */
So struct sock carries a struct sock_cgroup_data sk_cgrp_data field, and the helper sock_cgroup_ptr() resolves it to the owning struct cgroup *. When a packet leaves a socket, the cgroup BPF dispatch path does exactly this:
/* kernel/bpf/cgroup.c:1574, inside __cgroup_bpf_run_filter_skb() */
cgrp = sock_cgroup_ptr(&sk->sk_cgrp_data);
That single line is “the kernel knows which cgroup the socket belongs to.” It dereferences a pointer the socket has been carrying since birth, gets the cgroup, and runs that cgroup’s attached programs. There is no scan of cgroup.procs, no per-packet PID lookup — the association was nailed down once, when the socket was created, and rides along on the socket forever after.
One guard sits right above that line: cgroup_skb only applies to IP sockets.
/* kernel/bpf/cgroup.c:1571 */
if (sk->sk_family != AF_INET && sk->sk_family != AF_INET6)
return 0;
A Unix-domain socket or a netlink socket sails straight through your egress firewall untouched — the hook returns 0 (allow) before your program ever runs. Good to know before you wonder why your “block everything” program let the X server talk to its clients.
How you attach, and what “hierarchical” means
A cgroup BPF program does not attach to an interface or a PID. It attaches to a cgroup directory’s file descriptor. That is why the loader does open(cg_path, O_RDONLY | O_DIRECTORY) — it is opening the explicitly supplied directory to get an fd, and bpf_program__attach_cgroup hands that fd to the kernel. From then on the program fires for every socket whose sk_cgrp_data points at that cgroup (or a descendant of it). This is why a process that joins the cgroup after you attach is immediately covered: it inherits the cgroup, its new sockets get sk_cgrp_data pointing there, and the dispatch path finds your program. Nothing has to be re-attached.
Attachment is hierarchical: a program on a parent cgroup also covers its children. When more than one level wants a program, v7.1 gives you attach flags to choose how they combine:
/* include/uapi/linux/bpf.h:1200-1219 */
/* BPF_F_ALLOW_OVERRIDE: a child's program yields to / replaces the parent's. */
/* BPF_F_ALLOW_MULTI: programs from multiple levels all run, in FIFO order
* (child programs first, then this cgroup, then parent). */
You will not need either today — libbpf’s attach_cgroup uses the default single-program semantics (one program per cgroup, NONE flags). But know multi-attach exists: it is how a node-level agent and a pod-level policy can coexist on the same socket.
Why cgroups, for BPF specifically
Now the one-liner finally lands. BPF cgroup hooks let you attach policy to a cgroup directory that runs only for the sockets of processes in that cgroup — because those sockets carry a pointer back to the cgroup. This is how systemd, Cilium, and Kubernetes sidecars implement per-pod or per-service network rules without iptables overhead: a pod is a cgroup, so “this pod’s traffic” is just “sockets whose sk_cgrp_data points here.”
sockops example: per-cgroup TCP tuning
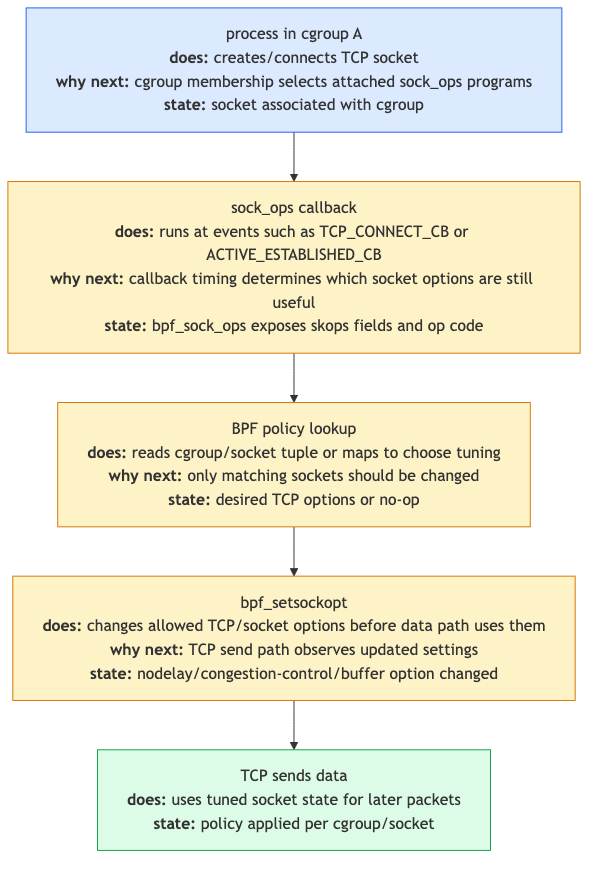
When a TCP connection event fires (e.g., BPF_SOCK_OPS_TCP_CONNECT_CB), your BPF program can call bpf_setsockopt(skops, ..., TCP_CONGESTION, "bbr", 3) to set BBR for this socket. Combined with cgroup attachment, you’ve got “all sockets from cgroup X use BBR; all sockets from cgroup Y use CUBIC.” We’ll unpack what bpf_setsockopt and TCP_CONGESTION actually are below, right before Part B uses them.
There are no Dumb Questions
Q: When does
cgroup_skbrun vstc?A:
cgroup_skb/ingressruns after IP routing decided this packet is for a local socket; the kernel knows which cgroup the destination socket belongs to.cgroup_skb/egressruns after the socket sent — kernel knows the source socket’s cgroup. tc runs at L2/L3, before/after socket layer. Use cgroup_skb when policy is “this cgroup’s traffic” rather than “this interface’s traffic.”Q: How is sock_ops different from setting sysctls?
A: Sysctls are global; sock_ops is per-socket and conditional. You can set RTO_MIN to 500ms for cgroup A and 5ms for cgroup B without touching sysctls. The conditional check happens in BPF, evaluated per connection.
Q: Are these used much in practice?
A: Yes — Cilium uses cgroup_sock_addr extensively for socket-level service translation (kube-proxy replacement). Service meshes use sk_msg for L7 routing. Most users don’t touch them directly because tools abstract them.
The lab — two parts
Part A: cgroup_skb firewall
Create a test cgroup and block egress UDP for any process in it.
Prerequisite: cgroup v2 (unified hierarchy) mounted at
/sys/fs/cgroup— verify withmount | grep cgroup2(expectcgroup2 on /sys/fs/cgroup type cgroup2 ...) — and a kernel built withCONFIG_CGROUP_BPF=y(checkzgrep CGROUP_BPF /proc/config.gzor/boot/config-$(uname -r)). On cgroup v1 / hybrid hosts the path and attach semantics differ.
CG=/sys/fs/cgroup/practical-ebpf-day19-$$
sudo mkdir "$CG"
Do not move your interactive shell. Each trigger below starts a short-lived child shell, writes only that child’s PID to $CG/cgroup.procs, and then execs the test command. Every socket that controlled child opens has sk_cgrp_data pointing at the owned cgroup; your terminal and SSH connection stay in the root cgroup.
fw.bpf.c:
#include "vmlinux.h"
#include <bpf/bpf_helpers.h>
#include <bpf/bpf_endian.h>
char LICENSE[] SEC("license") = "GPL";
SEC("cgroup_skb/egress")
int block_udp(struct __sk_buff *skb)
{
void *data = (void *)(long)skb->data;
void *end = (void *)(long)skb->data_end;
struct iphdr *ip = data;
if (ip + 1 > end) return 1; /* allow if can't parse */
if (ip->protocol == IPPROTO_UDP) return 0; /* drop UDP */
return 1;
}
Wait — why does data point straight at the IP header here? Recall from Day 16 that __sk_buff exposes data/data_end for bounds-checked direct packet access: every read you make must be proven in-range before the verifier accepts it (that’s why the if (ip + 1 > end) check is mandatory before touching ip->protocol). Same discipline applies here. But there’s a difference Day 16 didn’t prepare you for, and it would trip you up if nobody flagged it.
On Day 16 the tc program saw the Ethernet header first — data pointed at an ethhdr, and you had to parse past it before reaching the IP header. Here there is no ethhdr parse step at all: fw.bpf.c casts data straight to struct iphdr *. That is not a bug. For cgroup_skb, the data pointer starts at the network (IP) header, because the hook runs at the socket layer, not the L2 framing layer. The kernel arranges this explicitly before invoking your program:
/* kernel/bpf/cgroup.c:1561-1577, __cgroup_bpf_run_filter_skb() */
unsigned int offset = -skb_network_offset(skb);
...
__skb_push(skb, offset); /* move data back to the IP header */
bpf_compute_and_save_data_end(skb, &saved_data_end);
__skb_push rewinds skb->data to the network header, then bpf_compute_and_save_data_end sets the data/data_end window your program sees. So for cgroup_skb, [data, data_end) spans from the IP header onward — cast and go. (Contrast Day 16’s tc code, which had to parse ethhdr first because tc runs below the socket, where L2 framing is still present.)
Note: cgroup_skb/ingress returns 1 = allow, 0 = drop. cgroup_skb/egress is wider — the verifier enforces a return range of 0-3: 0=drop, 1=keep, 2=drop and notify TCP of congestion (cn), 3=keep and cn. Returning anything outside that range is rejected at load time. (We dissect exactly where that range is enforced and how it becomes a packet verdict in Break 1 — it is the chapter’s headline mechanism, and worth understanding before you trust it.)
Userspace attach. Compile this loader with the day’s Makefile (same skeleton-driven pattern as earlier days) and keep it running while you test — bpf_program__attach_cgroup returns a struct bpf_link * whose lifetime is tied to the process. When the loader exits, the link is freed and UDP egress is allowed again:
int cg_fd = open(cg_path, O_RDONLY | O_DIRECTORY); /* explicit DIRECTORY fd */
struct fw_bpf *skel = fw_bpf__open_and_load();
struct bpf_link *l = bpf_program__attach_cgroup(skel->progs.block_udp, cg_fd);
printf("attached, Ctrl-C to detach\n");
pause(); /* keep the process (and the link) alive */
Notice the attach target is cg_fd, the cgroup directory fd — not an interface, not a PID. That is the attachment model from the cgroup section made concrete: the program now fires for every socket whose sk_cgrp_data points at $CG.
A production policy can pin the link to a uniquely owned bpffs path, but this lab intentionally keeps it process-owned: stopping the exact loader PID is guaranteed to detach it. The trigger itself is a controlled child placed in $CG.
The complete loader (fw.c) wraps that sketch with signal handling and safe cgroup-argument handling: it requires an explicit cgroup-v2 directory path and opens it with O_DIRECTORY, so it cannot silently attach to a fixed or unexpected cgroup. Build it with make -C ebpf/labs fw:
#include <errno.h>
#include <fcntl.h>
#include <signal.h>
#include <stdio.h>
#include <string.h>
#include <unistd.h>
#include <bpf/libbpf.h>
#include "fw.skel.h"
static volatile sig_atomic_t exiting;
static void handle_signal(int signal_number)
{
(void)signal_number;
exiting = 1;
}
static int install_signal_handlers(void)
{
const struct sigaction action = {
.sa_handler = handle_signal,
};
if (sigaction(SIGINT, &action, NULL) != 0 ||
sigaction(SIGTERM, &action, NULL) != 0) {
fprintf(stderr, "failed to install signal handlers: %s\n",
strerror(errno));
return -errno;
}
return 0;
}
/* Open the cgroup v2 directory whose fd is the cgroup-BPF attach target.
* O_DIRECTORY makes a non-directory (or missing) path fail cleanly instead
* of attaching to something unexpected. Empty arguments are rejected. */
static int open_cgroup_dir(const char *path)
{
int fd;
if (path == NULL || path[0] == '\0') {
fprintf(stderr, "cgroup path must be a non-empty directory\n");
return -1;
}
fd = open(path, O_RDONLY | O_DIRECTORY | O_CLOEXEC);
if (fd < 0) {
fprintf(stderr, "failed to open cgroup dir '%s': %s\n", path,
strerror(errno));
return -1;
}
return fd;
}
int main(int argc, char **argv)
{
const char *cg_path;
struct fw_bpf *skel = NULL;
struct bpf_link *link = NULL;
int cg_fd = -1;
int err;
setvbuf(stdout, NULL, _IOLBF, 0);
if (argc != 2) {
fprintf(stderr, "usage: %s <owned-cgroup-v2-directory>\n", argv[0]);
return 2;
}
cg_path = argv[1];
err = install_signal_handlers();
if (err)
return 1;
cg_fd = open_cgroup_dir(cg_path);
if (cg_fd < 0)
return 1;
skel = fw_bpf__open_and_load();
if (!skel) {
fprintf(stderr, "failed to open/load fw BPF skeleton\n");
err = 1;
goto cleanup;
}
link = bpf_program__attach_cgroup(skel->progs.block_udp, cg_fd);
if (!link) {
err = -errno;
fprintf(stderr, "failed to attach cgroup_skb/egress to '%s': %s\n",
cg_path, strerror(errno));
goto cleanup;
}
printf("attached cgroup_skb/egress UDP filter to %s; Ctrl-C to detach\n",
cg_path);
while (!exiting)
pause();
err = 0;
cleanup:
bpf_link__destroy(link);
fw_bpf__destroy(skel);
if (cg_fd >= 0)
close(cg_fd);
return err != 0;
}
Test. Use a UDP probe whose success/failure is visible — dig defaults to UDP/53, exactly the protocol/port the filter drops, so the timeout-vs-answer contrast is unambiguous (raw nc -u would hang identically in both cases and reveal nothing):
make -C ebpf/labs day19
sudo ebpf/labs/.output/day19/fw "$CG" &
FW_PID=$!
trap 'sudo kill -INT "$FW_PID" 2>/dev/null || true; wait "$FW_PID" 2>/dev/null || true; sudo rmdir "$CG" 2>/dev/null || true' EXIT
sleep 0.5
# only this controlled child enters the cgroup (UDP/53 is dropped):
sudo sh -c 'echo $$ > "$1/cgroup.procs"; exec dig +tries=1 +timeout=2 @1.1.1.1 example.com' _ "$CG"
# -> communications error / no servers could be reached
sudo sh -c 'echo $$ > "$1/cgroup.procs"; exec ping -c 3 1.1.1.1' _ "$CG"
# -> works: ICMP is not UDP
# this ordinary process remains outside the cgroup and receives an answer:
dig +tries=1 +timeout=2 @1.1.1.1 example.com
The ordinary process sees its packets sail through because its sockets’ sk_cgrp_data points at the root cgroup, not $CG — the program is simply not in their dispatch path. This ties back to the chapter’s own check question: DNS over UDP/53 is exactly what a cgroup_skb/egress UDP drop kills.
Teardown is the trap installed above: it signals the exact loader PID, waits for skeleton destruction to detach the link, and removes only $CG. The trigger commands exec, so their temporary cgroup is already empty when they exit. Your interactive shell never moved and needs no recovery step.
Part B: sock_ops TCP tuning
Part A fired your program once per packet. sock_ops is a different animal: one program, invoked many times over the life of a single connection, once at each interesting TCP event. To read the example you need two pieces of background the old chapter skipped — what the bpf_sock_ops context is, and what bpf_setsockopt/TCP_CONGESTION actually do.
The bpf_sock_ops context and the op state-machine
A sock_ops program is handed a struct bpf_sock_ops *, and its very first field tells you why you were called:
/* include/uapi/linux/bpf.h:6900 */
struct bpf_sock_ops {
__u32 op; /* WHICH event fired — your switch key */
union { __u32 args[4]; __u32 reply; ... }; /* per-op in/out values */
__u32 family;
__u32 remote_ip4, local_ip4;
__u32 remote_port, local_port;
__u32 is_fullsock;
__u32 snd_cwnd;
__u32 srtt_us; /* smoothed RTT << 3, microseconds */
__u32 state; /* a TCP_* state (TCP_ESTABLISHED = 1, …) */
...
__u64 bytes_acked;
...
};
The program is a giant switch on op. The kernel re-enters the same program at each step of the TCP state machine — active connect, passive/active establishment, RTT sample, retransmit, state change, header-option parse/write — each time with a different op. The op values are a UAPI enum; the three this lab cares about:
/* include/uapi/linux/bpf.h:7048 */ BPF_SOCK_OPS_TCP_CONNECT_CB /* right before an active connect */
/* include/uapi/linux/bpf.h:7051 */ BPF_SOCK_OPS_ACTIVE_ESTABLISHED_CB /* SYN-ACK finished an outbound 3WHS */
/* include/uapi/linux/bpf.h:7055 */ BPF_SOCK_OPS_PASSIVE_ESTABLISHED_CB/* ACK finished an inbound 3WHS */
tune.bpf.c below checks all three because it wants to set the congestion control once the socket is usable, no matter how the connection came to be — whether this host dialed out (active) or accepted a connection (passive).
Beyond op, the context exposes live TCP state you may read: family, remote/local ip+port, state (a TCP_* value — TCP_ESTABLISHED = 1 per include/net/tcp_states.h:13), srtt_us, snd_cwnd, bytes_acked, and more. So a real policy can be conditional on connection properties — “use BBR only for long-haul connections with srtt > 20ms” — not just “always set BBR.” The args[4]/reply union lets some op callbacks pass arguments in and return a value out (RTO/RWND-init ops return a value that way); for our setsockopt use-case the program just returns 0.
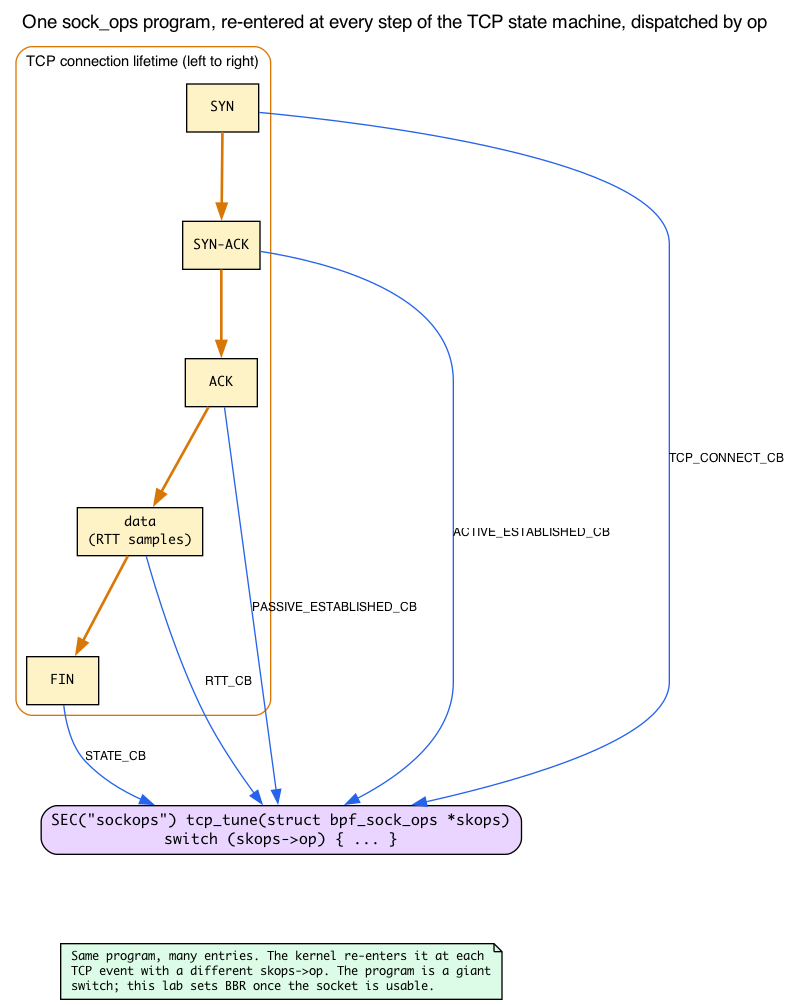
What bpf_setsockopt and TCP_CONGESTION do
bpf_setsockopt(ctx, level, optname, optval, optlen) is the kernel-internal twin of the userspace setsockopt(2) syscall. Same level/optname constants (SOL_TCP, TCP_CONGESTION), same effect — but called from inside a BPF program, on the very socket the hook is firing for, with no syscall boundary to cross. It is offered only to socket-context program types (sock_ops, cgroup_sock_addr, …), which is exactly why this hook family can tune connections at all. The kernel wires it into the sock_ops helper set explicitly:
/* net/core/filter.c:8597, in sock_ops_func_proto() */
case BPF_FUNC_setsockopt: return &bpf_sock_ops_setsockopt_proto;
and the implementation behind it is __bpf_setsockopt(struct sock *sk, int level, int optname, ...) at net/core/filter.c:5598 — it operates directly on the struct sock, no copy from userspace.
TCP_CONGESTION (#define TCP_CONGESTION 13, include/uapi/linux/tcp.h:107) takes a string naming a registered congestion-control module — "bbr", "cubic", "reno", "dctcp". The kernel looks the name up in its CC registry, so "bbr" only resolves if tcp_bbr is built in or modprobe’d (the prerequisite below). The modules really are separate files: net/ipv4/tcp_bbr.c, net/ipv4/tcp_cubic.c. An unknown name returns -ENOENT (the CC registry lookup misses) — and a BPF helper reports that as a return value, not an exception, which is why Break 3’s failure is silent.
Brief framing only — we do not teach the algorithm here (that’s Days 22–23, struct_ops congestion control): congestion control is the pluggable kernel logic that decides how big the send window may grow. CUBIC is the default; BBR is rate/RTT-based. The point for Day 19 is that you can pick a different one per socket / per cgroup without touching the global net.ipv4.tcp_congestion_control sysctl. That per-socket selectability is the entire value proposition of this hook.
tune.bpf.c (the full file adds the usual vmlinux.h/bpf_helpers.h includes, the GPL LICENSE, and fallback SOL_TCP/TCP_CONGESTION defines — those UAPI constants are #defines, not BTF types, so vmlinux.h does not supply them):
SEC("sockops")
int tcp_tune(struct bpf_sock_ops *skops)
{
if (skops->op == BPF_SOCK_OPS_TCP_CONNECT_CB ||
skops->op == BPF_SOCK_OPS_PASSIVE_ESTABLISHED_CB ||
skops->op == BPF_SOCK_OPS_ACTIVE_ESTABLISHED_CB) {
/* Set BBR for connections in this cgroup */
char cc[] = "bbr";
bpf_setsockopt(skops, SOL_TCP, TCP_CONGESTION, cc, sizeof(cc));
}
return 0;
}
Attach to a cgroup:
struct bpf_link *l = bpf_program__attach_cgroup(skel->progs.tcp_tune, cg_fd);
The complete loader (tune.c) shares fw.c’s safe cgroup-argument handling — required explicit cgroup path plus O_DIRECTORY — and attaches tcp_tune instead. Build it with make -C ebpf/labs tune:
#include <errno.h>
#include <fcntl.h>
#include <signal.h>
#include <stdio.h>
#include <string.h>
#include <unistd.h>
#include <bpf/libbpf.h>
#include "tune.skel.h"
static volatile sig_atomic_t exiting;
static void handle_signal(int signal_number)
{
(void)signal_number;
exiting = 1;
}
static int install_signal_handlers(void)
{
const struct sigaction action = {
.sa_handler = handle_signal,
};
if (sigaction(SIGINT, &action, NULL) != 0 ||
sigaction(SIGTERM, &action, NULL) != 0) {
fprintf(stderr, "failed to install signal handlers: %s\n",
strerror(errno));
return -errno;
}
return 0;
}
/* Open the cgroup v2 directory whose fd is the cgroup-BPF attach target.
* O_DIRECTORY makes a non-directory (or missing) path fail cleanly instead
* of attaching to something unexpected. Empty arguments are rejected. */
static int open_cgroup_dir(const char *path)
{
int fd;
if (path == NULL || path[0] == '\0') {
fprintf(stderr, "cgroup path must be a non-empty directory\n");
return -1;
}
fd = open(path, O_RDONLY | O_DIRECTORY | O_CLOEXEC);
if (fd < 0) {
fprintf(stderr, "failed to open cgroup dir '%s': %s\n", path,
strerror(errno));
return -1;
}
return fd;
}
int main(int argc, char **argv)
{
const char *cg_path;
struct tune_bpf *skel = NULL;
struct bpf_link *link = NULL;
int cg_fd = -1;
int err;
setvbuf(stdout, NULL, _IOLBF, 0);
if (argc != 2) {
fprintf(stderr, "usage: %s <owned-cgroup-v2-directory>\n", argv[0]);
return 2;
}
cg_path = argv[1];
err = install_signal_handlers();
if (err)
return 1;
cg_fd = open_cgroup_dir(cg_path);
if (cg_fd < 0)
return 1;
skel = tune_bpf__open_and_load();
if (!skel) {
fprintf(stderr, "failed to open/load tune BPF skeleton\n");
err = 1;
goto cleanup;
}
link = bpf_program__attach_cgroup(skel->progs.tcp_tune, cg_fd);
if (!link) {
err = -errno;
fprintf(stderr, "failed to attach sockops to '%s': %s\n",
cg_path, strerror(errno));
goto cleanup;
}
printf("attached sockops TCP tuner to %s; Ctrl-C to detach\n", cg_path);
while (!exiting)
pause();
err = 0;
cleanup:
bpf_link__destroy(link);
tune_bpf__destroy(skel);
if (cg_fd >= 0)
close(cg_fd);
return err != 0;
}
Verify. There’s nothing to observe until a fresh TCP connection fires sockops from inside the cgroup, and BBR must actually be available — otherwise bpf_setsockopt(...,"bbr",...) fails silently (that’s Break 3). Also scope ss to the target so you don’t match unrelated sockets (e.g. your SSH session, which may itself be on BBR):
# prerequisite: BBR must be available
sudo modprobe tcp_bbr 2>/dev/null # no-op if built in
sysctl net.ipv4.tcp_available_congestion_control
# stop Part A's exact loader, then attach sockops to the same owned cgroup:
sudo kill -INT "$FW_PID"; wait "$FW_PID" || true
sudo ebpf/labs/.output/day19/tune "$CG" &
TUNE_PID=$!
trap 'sudo kill -INT "$TUNE_PID" 2>/dev/null || true; wait "$TUNE_PID" 2>/dev/null || true; sudo rmdir "$CG" 2>/dev/null || true' EXIT
sleep 0.5
# only this short-lived child enters the cgroup and opens the fresh TCP socket:
sudo sh -c 'echo $$ > "$1/cgroup.procs"; exec curl -s https://speed.cloudflare.com/__up -T /dev/zero --max-time 4' _ "$CG" >/dev/null &
CLIENT_PID=$!
sleep 1
ss -ti dst :443 | grep bbr
wait "$CLIENT_PID" || true
Expected: the in-cgroup connection’s ss -i info line contains bbr. A socket opened from a shell not in the cgroup shows the host default CC instead — which differs from your per-cgroup choice as long as the default isn’t already bbr (on this devbox the default happens to be bbr, so to see the contrast pick a non-default name like "cubic" in tune.bpf.c). Same reason as Part A: a non-cgroup socket’s cgroup pointer doesn’t name $CG, so tcp_tune never runs for it. If ss is empty, either no fresh connection was made from the cgroup, or BBR is not loaded (the bpf_setsockopt failed silently — Break 3).
What to break, in order
Break 1 — Out-of-range return
Return 5 (or any value > 3) from a cgroup_skb/egress program. The verifier rejects it at load: egress return values must fall in retval_range(0, 3) (kernel/bpf/verifier.c). The defined values are 0=drop, 1=keep, 2=drop+cn, 3=keep+cn — so returning TC_ACT_SHOT (which is 2) actually loads and runs, but it means “drop and signal congestion,” not “allow.” It’s a defined egress value, not a coincidental pass. On ingress the range is just 0/1. Don’t borrow tc’s TC_ACT_* constants here — the conventions only overlap by accident.
This is the chapter’s headline mechanism, so let’s ground every word of it in the source. Two stages enforce the contract.
Stage 1 — the verifier clamps the range at load time, per program type. The default exit range for any program is 0-1; the CGROUP_SKB egress attach type widens it to 0-3:
/* kernel/bpf/verifier.c:16747 — default */
*range = retval_range(0, 1);
...
/* kernel/bpf/verifier.c:16772-16773 — CGROUP_SKB egress only */
if (env->prog->expected_attach_type == BPF_CGROUP_INET_EGRESS)
*range = retval_range(0, 3);
So return 5 is rejected before the program ever runs — that is exactly Break 1. Ingress never hits that if, so it keeps the default 0-1: drop/allow, no widening. The asymmetry is deliberate, not an oversight.
Stage 2 — at runtime the kernel maps your 0-3 to a NET_XMIT_* code. Before the egress branch even sees a value, the run-array loop splits your 0-3 return bit-by-bit:
/* kernel/bpf/cgroup.c:81-87, in bpf_prog_run_array_cg() */
func_ret = run_prog(prog, ctx);
if (ret_flags) {
*(ret_flags) |= (func_ret >> 1); /* bit 1 -> the cn flag */
func_ret &= 1; /* bit 0 -> keep(1)/drop(0) */
}
if (!func_ret && !IS_ERR_VALUE((long)run_ctx.retval))
run_ctx.retval = -EPERM; /* drop becomes a negative err */
This is where your 0-3 is split: bit 0 is the keep/drop decision, bit 1 is the cn flag. A drop (bit 0 = 0) sets retval to -EPERM — that is the negative value the egress branch below then maps. So the ret and flags the next snippet reads are not your raw return value; they are already this post-split pair.
The egress branch of __cgroup_bpf_run_filter_skb() then does the final translation into a NET_XMIT_* code. Heads up — the integers in this kernel comment are the post-conversion NET_XMIT_* result codes, a different namespace from your program’s 0-3 return values. Your return 1 (keep) converts to NET_XMIT_SUCCESS=0; your return 2 (drop+cn) becomes NET_XMIT_DROP=1; return 3 (keep+cn) becomes NET_XMIT_CN=2; return 0 (drop) becomes a negative -err:
/* kernel/bpf/cgroup.c:1589-1610 (egress branch) */
/* left column = the post-conversion NET_XMIT result, NOT your return value:
* 0: NET_XMIT_SUCCESS skb should be transmitted
* 1: NET_XMIT_DROP skb should be dropped and cn
* 2: NET_XMIT_CN skb should be transmitted and cn
* 3: -err skb should be dropped */
cn = flags & BPF_RET_SET_CN;
if (ret && !IS_ERR_VALUE((long)ret))
ret = -EFAULT;
if (!ret) ret = (cn ? NET_XMIT_CN : NET_XMIT_SUCCESS);
else ret = (cn ? NET_XMIT_DROP : ret);
with the codes themselves defined at include/linux/netdevice.h:119-121:
#define NET_XMIT_SUCCESS 0x00 /* transmit */
#define NET_XMIT_DROP 0x01 /* drop + congestion-notify */
#define NET_XMIT_CN 0x02 /* transmit + congestion-notify */
The “cn” bit is a separate channel (BPF_RET_SET_CN), which is the source of truth behind “2 = drop+cn, 3 = keep+cn.” Mind the namespace trap in the box above, though: that left column (0..3) is the resulting NET_XMIT_* code, not the value your program returned. The two spaces do not line up one-to-one. bpf_prog_run_array_cg() (cgroup.c:81-87, the Stage-2 snippet above) splits your return value bit-by-bit before this branch ever runs — the low bit is keep(1)/drop(0), the high bit becomes the cn flag — so program-return 2 (drop+cn) converts to NET_XMIT_DROP, and the NET_XMIT_CN result is instead produced by program-return 3 (keep+cn). That still confirms the subtle point: TC_ACT_SHOT == 2 “works” on egress only because 2 is a defined program-return value there (drop+cn), not because tc and cgroup share a convention — and emphatically not because it equals NET_XMIT_CN. They overlap by accident. Ingress, by contrast, is the simple branch — range 0/1, no cn channel — matching the note on the egress code box and the Bullet Points below.

Break 2 — Forget the IPPROTO check
Drop all packets in cgroup_skb/egress (return 0 always). The controlled child in $CG loses network access; your terminal does not. Recover by signaling the exact loader PID, which destroys the link, or simply let the child exit and the trap remove the now-empty owned cgroup. This is why the lab never moves your interactive shell into a policy it is deliberately breaking.
Break 3 — TCP CC not loaded
bpf_setsockopt(..., "bbr_invalid", ...). The kernel looks "bbr_invalid" up in its CC registry, finds nothing, and returns -ENOENT (tcp_set_congestion_control() in net/ipv4/tcp_cong.c sets err = -ENOENT when tcp_ca_find* returns NULL) — but bpf_setsockopt surfaces that as a return value, not a fault, so nothing crashes and nothing logs. The connection still succeeds with the system default. Symptom: your sockops “doesn’t work” — it’s running, but the helper failed silently. Always check return values: if (bpf_setsockopt(...) < 0) { /* handle */ }.
Break 4 — Use cgroup_sock_addr for socket-level NAT
SEC("cgroup/connect4")
int rewrite_connect(struct bpf_sock_addr *ctx)
{
if (ctx->user_port == bpf_htons(8080)) {
ctx->user_port = bpf_htons(80);
return 1;
}
return 1;
}
This attaches as BPF_CGROUP_INET4_CONNECT (include/uapi/linux/bpf.h:1108) and rewrites the destination port inside the connect() syscall, before the SYN is built. Now connections from this cgroup to port 8080 are silently redirected to port 80. The bpf_sock_addr context fields (user_port, user_ip4, …) are real (include/uapi/linux/bpf.h:6871). This is how Cilium’s “socket-level service translation” works — kube-proxy without iptables, done one cgroup at a time using the same socket-carries-its-cgroup mechanism you learned this chapter.
What to read in the kernel
kernel/bpf/cgroup.c— the cgroup BPF infrastructure. ~2750 lines. Read the dispatch path__cgroup_bpf_run_filter_skb(thesock_cgroup_ptr→ run-array →NET_XMIT_*mapping you just dissected).include/linux/bpf-cgroup.h— interface and program types.net/core/filter.c— searchsock_ops_func_proto(:8588). Helpers available to sockops, includingbpf_setsockopt.tools/testing/selftests/bpf/progs/sockopt_*.c— sockops examples.Documentation/bpf/prog_cgroup_sockopt.rst— official docs.
Bullet Points
- A cgroup v2 is one unified tree mounted at
/sys/fs/cgroup(typecgroup2); each directory is a cgroup and writing a PID into itscgroup.procsfile moves that task in. v1 had a separate tree per controller; v2 has exactly one. - A socket carries its cgroup.
struct sockembedssk_cgrp_data;sock_cgroup_ptr(&sk->sk_cgrp_data)(cgroup.c:1574) resolves it to the owning cgroup. That pointer — set when the socket was created — is how the kernel “knows” which cgroup a packet’s program belongs to. No scan, no lookup. - Cgroup programs attach to a cgroup directory fd, fire for every socket whose
sk_cgrp_datanames that cgroup (or a descendant), and are hierarchical (BPF_F_ALLOW_OVERRIDE/MULTIfor multi-level). cgroup_skb only applies toAF_INET/AF_INET6(cgroup.c:1571). cgroup_skbruns per-packet for sockets in a cgroup. Ingress returns 1=allow/0=drop; egress allows 0-3 (0=drop, 1=keep, 2=drop+cn, 3=keep+cn), verifier-enforced. The verifier widens the range to 0-3 only forBPF_CGROUP_INET_EGRESS(verifier.c:16772); the kernel maps it toNET_XMIT_*atcgroup.c:1588.- For cgroup_skb,
skb->datastarts at the IP header (kernel does__skb_push(skb, -skb_network_offset(skb))), not the Ethernet header — unlike tc on Day 16. Same Day 16 bounds-check discipline still applies. sock_opsis one program re-entered at each TCP event;skops->opselects which (TCP_CONNECT_CB,ACTIVE/PASSIVE_ESTABLISHED_CB, …). The context also exposes live state (state,srtt_us,snd_cwnd,bytes_acked) for conditional policy.bpf_setsockoptis the in-kernel twin ofsetsockopt(2), available to socket-context programs (filter.c:8597).TCP_CONGESTION(tcp.h:107) takes a CC name string resolved against the kernel’s CC registry — so per-socket/per-cgroup CC without touching the global sysctl. Unknown name → silent-ENOENT.cgroup_sock_addrlets you rewrite sockaddrs atconnect/bind— socket-level NAT (BPF_CGROUP_INET4_CONNECT).- These hooks run in process context — full non-sleepable helper set, can call
bpf_setsockopt. - Used heavily in production: Cilium, systemd, Kubernetes service meshes.
Check question
You attach a cgroup_skb/egress program that returns 0 (drop) for every packet. A process in the cgroup runs wget google.com. Does the DNS lookup happen?
Click to reveal answer
Answer: No. DNS uses UDP/53; both UDP and TCP egress are filtered by cgroup_skb. The lookup socket(), connect(), and sendmsg() all succeed (cgroup_skb fires later, on packet send), but the actual UDP packet leaving the cgroup is dropped by your program. wget times out. To allow DNS specifically, gate by destination port in BPF.
End of Phase 3
You can now write BPF programs at every layer of the network stack: XDP at the driver, tc/tcx at the skb layer, AF_XDP for kernel bypass, cgroup_skb for per-cgroup filtering, sock_ops for TCP tuning, sk_msg for L7. That’s the full surface — and you now know the one fact that ties the cgroup hooks together: a socket carries a pointer to its cgroup, and every policy decision hangs off that pointer.
Phase 4 (Days 20–24) shifts to modern primitives: kfuncs, kptrs, struct_ops, BTF spelunking. The infrastructure that makes 2024–2026 BPF feel different from 2019 BPF. (Days 22–23 in particular pick up the congestion-control thread we deliberately left dangling here — you’ll write a CC algorithm as a struct_ops, not just select one by name.)
Day 20 — kfuncs: the modern kernel-extension mechanism
Today’s mission: call a kfunc from BPF, understand the acquire/release reference-counting semantics that the verifier enforces, learn what a kernel refcount actually is and why a task carries two of them, and know why new BPF features ship as kfuncs rather than helpers. Total time: ~100 minutes.
Phase 4 starts here. Days 20–24 cover the modern primitives that distinguish 2024+ BPF from the older days: kfuncs, kptrs, struct_ops, and BTF spelunking.
What a kfunc is
You met the helper-vs-kfunc split on Day 7: helpers are frozen UAPI (a fixed number and signature in enum bpf_func_id, a forever commitment), while kfuncs are ordinary in-tree kernel functions matched by name against kernel BTF and explicitly allowed to evolve. That’s why the kernel community stopped adding helpers around 2022 and ships new capabilities as kfuncs. Today we actually call one and learn the reference-counting semantics the verifier enforces around it.
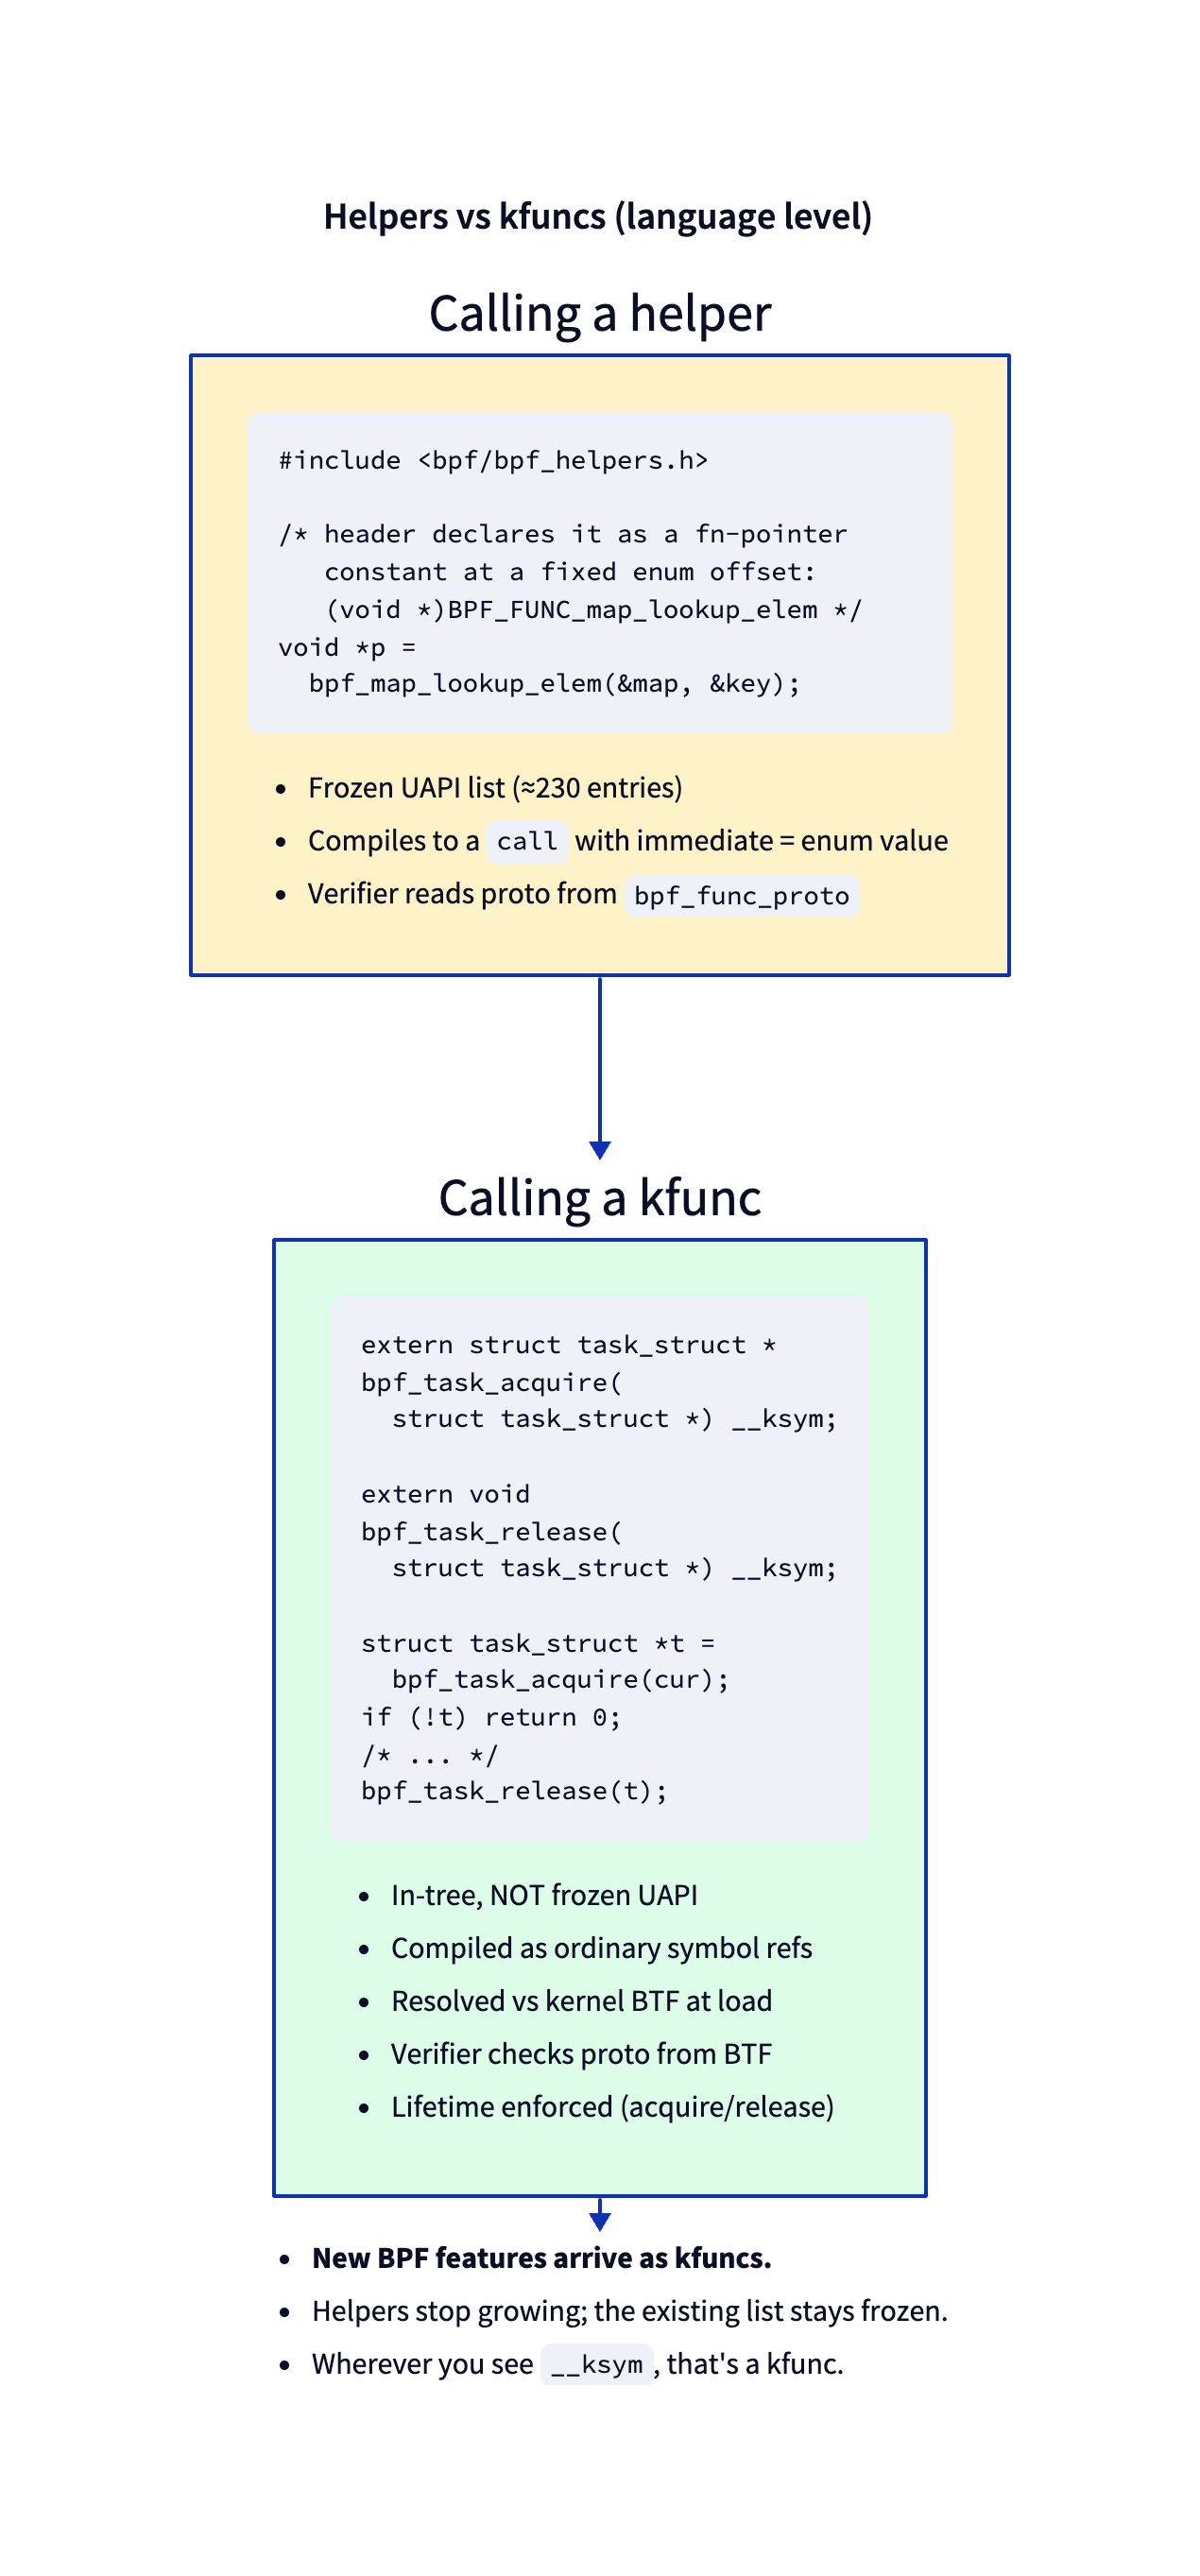
Concretely, a kfunc is a regular C function in the kernel, marked with __bpf_kfunc, registered against a BTF_KFUNCS_START/BTF_KFUNCS_END block, and resolved by name (against kernel BTF) at BPF program load time.
/* In kernel/bpf/helpers.c — line 2733 */
__bpf_kfunc struct task_struct *bpf_task_acquire(struct task_struct *p)
{
/* take a refcount on p */
if (refcount_inc_not_zero(&p->rcu_users))
return p;
return NULL;
}
/* line 2744 */
__bpf_kfunc void bpf_task_release(struct task_struct *p)
{
put_task_struct_rcu_user(p);
}
/* And later, registered: */
BTF_KFUNCS_START(generic_btf_ids)
BTF_ID_FLAGS(func, bpf_task_acquire, KF_ACQUIRE | KF_RCU | KF_RET_NULL)
BTF_ID_FLAGS(func, bpf_task_release, KF_RELEASE)
/* ... */
BTF_KFUNCS_END(generic_btf_ids)
register_btf_kfunc_id_set(BPF_PROG_TYPE_TRACING, &kfunc_set);
The flags annotate the function’s behavior for the verifier:
KF_ACQUIRE— returns a refcounted resource. Verifier tracks it; you must release.KF_RELEASE— releases a previously-acquired resource. Verifier marks the ref id closed.KF_TRUSTED_ARGS— argument pointers must bePTR_TO_BTF_ID | PTR_TRUSTED(not from arbitrary load).KF_RCU— argument is RCU-protected; valid for the duration of the program’s RCU read section.KF_SLEEPABLE— only callable from sleepable BPF programs.KF_RET_NULL— return value may be NULL; the verifier requires checking.
These flags are how the verifier knows what safety properties to check.
Notice that the two-line bodies above are doing something — refcount_inc_not_zero, put_task_struct_rcu_user — and those operations, not the flags, are the real subject of today’s chapter. The flags are a static checker the verifier layers on top of a runtime mechanism that already lives in the kernel. To understand why bpf_task_acquire can return NULL, why it carries KF_RET_NULL, and why the release function is named put_task_struct_rcu_user and not plain put_task_struct, we have to look at that runtime mechanism: the kernel reference count.
What a refcount actually is (and why a task has two)
Recall the
sk_bufftwo-refcount model from linux-net Day 1 —skb->userscounting holders of the descriptor anddatarefcounting sharers of the data buffer. Atask_structdoes exactly the same thing with two counters namedusageandrcu_users. If that split is fresh in your mind, this section is mostly “tasks do it too, here’s the BPF-specific twist.”
A refcount_t is a single atomic integer that answers one question: how many independent holders currently need this shared object to stay alive? The contract is dead simple, and it is the same contract skb->users followed on Day 1:
- A holder that wants to keep the object alive increments the counter (
refcount_inc) — “I’m using this, don’t free it.” - When that holder is done it decrements (
refcount_dec_and_test) — “I’m done.” - The decrement that drives the count to 0 is the one that actually frees the object. The last holder out turns off the lights.
refcount_t is not just a bare atomic_t: it is saturating and overflow-/underflow-protected. If a buggy code path over-increments toward wraparound, or decrements below zero, the kernel’s refcount API catches it and warns rather than silently corrupting the count — which would be a use-after-free or a leak. This is the runtime contract. The verifier’s KF_ACQUIRE/KF_RELEASE tracking is a static enforcement of exactly this contract, applied to references a BPF program holds.
refcount_inc_not_zero: the detail behind KF_RET_NULL
Look again at the body of bpf_task_acquire. It does not call refcount_inc. It calls refcount_inc_not_zero:
if (refcount_inc_not_zero(&p->rcu_users))
return p;
return NULL;
refcount_inc_not_zero increments the counter only if it is currently greater than zero, and returns a bool telling you whether the bump happened. Its signature is even marked __must_check so you cannot accidentally ignore the result:
/* include/linux/refcount.h:333 */
static inline __must_check bool refcount_inc_not_zero(refcount_t *r);
Why “not zero”? Because a count of 0 means the object is already being torn down. Remember the contract: the holder that drops the count to 0 is the one freeing the object. If you came along and blindly incremented from 0 to 1, you’d be claiming a reference to memory that is mid-destruction — a classic use-after-free. refcount_inc_not_zero refuses: it returns false, the increment doesn’t happen, and bpf_task_acquire therefore returns NULL.
This is the whole reason bpf_task_acquire carries KF_RET_NULL. You just saw two things stated separately — the verifier rule “the return value may be NULL — you must check it,” and the body that can return NULL — and they are the same fact: the task you tried to acquire might already be dying, the refcount might already be 0, the bump might fail. KF_RET_NULL is the verifier forcing you to handle that exact case at load time.
Two refcounts on one task: usage vs rcu_users
Here is the BPF-specific wrinkle. A task_struct carries two independent refcount_t fields, guarding two different lifetimes:
/* include/linux/sched.h:840 */
refcount_t usage;
/* include/linux/sched.h:1564 */
refcount_t rcu_users;
usageguards thetask_structallocation itself. Whileusage > 0, the memory holding the struct will not be freed.rcu_usersguards an RCU-grace-period extension of the task’s lifetime — it keeps the task reachable and valid across an RCU read-side section.
bpf_task_acquire deliberately bumps rcu_users, not usage. And bpf_task_release calls put_task_struct_rcu_user — the matching drop for that counter:
/* kernel/exit.c:234 */
void put_task_struct_rcu_user(struct task_struct *task)
{
if (refcount_dec_and_test(&task->rcu_users))
call_rcu(&task->rcu, delayed_put_task_struct);
}
See the contract in action: refcount_dec_and_test decrements and returns true exactly when the count reached 0; on that last drop it schedules the real free (call_rcu(...delayed_put_task_struct)). So while any holder keeps rcu_users > 0, the task stays alive — indefinitely, for as long as the reference is held. Only when the last holder drops rcu_users to 0 does refcount_dec_and_test fire and call_rcu defer the actual free until after the next RCU grace period. “Kept alive while held” and “freed one grace period after the final drop” are two distinct windows.
This is also why the release function is put_task_struct_rcu_user and not a plain put_task_struct: the two functions drop two different counters.
What about the KF_RCU flag on the registration (helpers.c:4725)? It is not a statement about the reference this kfunc returns or about the choice of rcu_users. As the flag list above already noted, KF_RCU constrains the input argument: it tells the verifier the passed-in p may be only RCU-protected (MEM_RCU) rather than fully trusted. An RCU-protected pointer is guaranteed not to be freed under you, but — per kfuncs.rst §2.5.6 — “the object’s refcount could have reached zero.” That is the real upstream reason the body must call refcount_inc_not_zero (the bump can fail) and the kfunc must carry KF_RET_NULL. The docs say it almost verbatim: “a KF_ACQUIRE kfunc that is KF_RCU should very likely also be KF_RET_NULL.” The causal chain is KF_RCU (arg may be RCU-only, refcount possibly 0) → refcount_inc_not_zero → bump may fail → KF_RET_NULL. The decision to bump rcu_users rather than usage is a separate, body-internal lifetime choice, invisible to the verifier and unrelated to the KF_RCU bit.
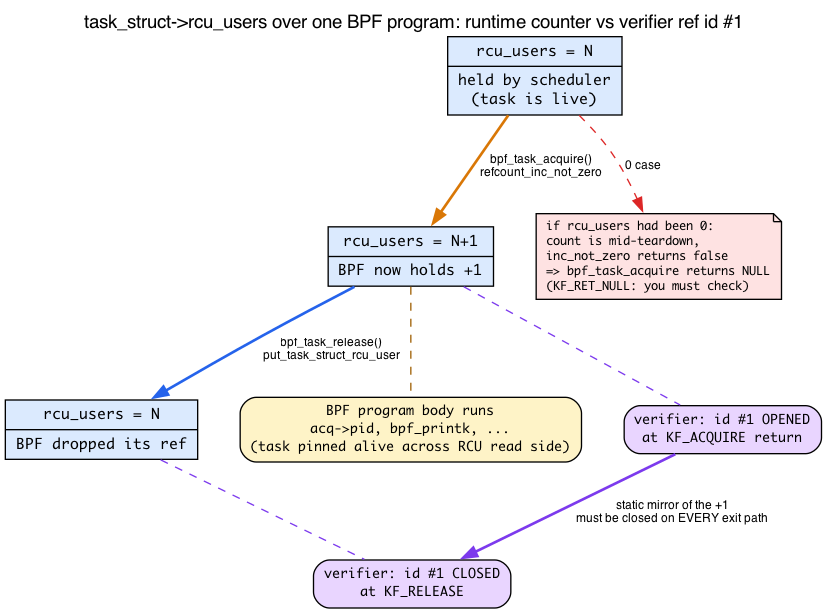
Why this makes BPF safer than hand-written kernel C
Now you can see exactly why the verifier makes BPF safer than ordinary kernel code in the reference-management dimension, in terms of the two functions above:
- In ordinary kernel C, forgetting a
put_task_struct_rcu_userleaks the task — the count never reaches 0, the memory is never freed. These leaks are notoriously hard to find because nothing crashes; memory just slowly disappears. - In ordinary kernel C, forgetting to NULL-check the result of
refcount_inc_not_zerois a use-after-free — you proceed to use a task that was already being destroyed.
Both bugs are classic and painful. The verifier turns both into load-time rejections: forget the release and you get Unreleased reference id=N; use an unacquired reference and you get reference has not been acquired before. That conversion of two whole bug classes into compile-time errors is the payoff this chapter is reaching for. Keep these two functions and the two counters in mind — everything below is the verifier mechanizing the contract you just learned.
Calling a kfunc from BPF
Declare it in your BPF source as an extern with __ksym:
extern struct task_struct *bpf_task_acquire(struct task_struct *p) __ksym;
extern void bpf_task_release(struct task_struct *p) __ksym;
The __ksym attribute tells libbpf “look this up by name in the kernel’s BTF at load time.” If the name doesn’t resolve, the load fails — no silent miss. (You met __ksym on Day 7; nothing new here.)
Use:
struct task_struct *cur = bpf_get_current_task_btf(); // Day 3
struct task_struct *acq = bpf_task_acquire(cur);
if (!acq) return 0; // KF_RET_NULL: must check (refcount may have been 0)
/* now we hold a refcount on acq; verifier knows ref id #1 is open */
bpf_printk("acquired pid=%d", acq->pid);
bpf_task_release(acq); // closes ref id #1
return 0;
That if (!acq) return 0; is not boilerplate — it is the load-bearing handling of the refcount_inc_not_zero-returned-false case you just learned. Skip it and the verifier rejects the program.
The verifier’s reference tracking
The single most important kfunc-related verifier behavior is the acquire/release lifetime check.
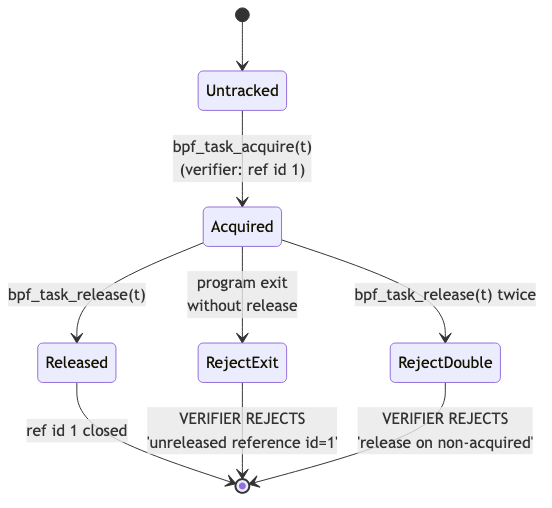
When you call a KF_ACQUIRE function, the verifier:
- Creates a fresh reference id (an integer, e.g., id #1).
- Marks the return-value register with that id.
- Tracks the id through your program’s flow: copies, branches, stores into maps.
- At every program exit point, requires the id to be either released or transferred to a place where the kernel can release it (e.g., a kptr-typed map slot).
The ref id is the verifier’s static stand-in for the runtime rcu_users increment: id #1 is “open” for exactly the span during which the real counter is sitting at +1. Closing the id corresponds to the put_task_struct_rcu_user that drops it back.
If you forget to release on any path:
Unreleased reference id=1 alloc_insn=2
If you release a non-acquired pointer:
kfunc bpf_task_release#0 reference has not been acquired before
If you release twice:
kfunc bpf_task_release#0 reference has not been acquired before
(The second release sees the ref id as already closed; same error.)
These are checked at load time, not runtime — runtime is safe.
Why reference tracking is necessary
This is the leak-on-forget / corrupt-on-stray-release pair from the refcount section — a BPF program that takes a reference but never releases it leaks kernel memory, and one that releases a reference it didn’t acquire drives the count toward 0 prematurely and frees an object other holders still use. Verifier-time tracking is what turns both into load-time rejections, making BPF safer than hand-written kernel C in this dimension. See the refcount section above for the full argument.
Per-program-type registration
Not every kfunc is available in every BPF program type. The registration is explicit:
register_btf_kfunc_id_set(BPF_PROG_TYPE_TRACING, &generic_kfunc_set);
register_btf_kfunc_id_set(BPF_PROG_TYPE_STRUCT_OPS, &cpumask_kfunc_set);
Tracing programs (fentry, fexit, etc.) get the generic set. struct_ops programs get the cpumask set. XDP also gets the generic set (it’s registered for BPF_PROG_TYPE_XDP too), so bpf_task_acquire does load in an XDP program — but it’s semantically meaningless there, because XDP runs in NIC-driver softirq context with no meaningful current task. The cpumask family, by contrast, is registered only for TRACING/STRUCT_OPS/SYSCALL, so calling bpf_cpumask_create from XDP genuinely fails the verifier with calling kernel function bpf_cpumask_create is not allowed.
Discovery: what kfuncs exist?
Three approaches:
-
Kernel source. Grep
BTF_KFUNCS_STARTblocks inkernel/bpf/and elsewhere:cd ~/code/linux grep -rn 'BTF_KFUNCS_START' kernel/bpf net/ drivers/ | headEach block lists kfuncs in one logical family.
-
Documentation.
Documentation/bpf/kfuncs.rstlists categories: cpumask, dynptr, lists, refcount, task, etc. -
bpftool BTF dump:
sudo bpftool btf dump file /sys/kernel/btf/vmlinux | grep "FUNC.*bpf_" | head -30Filters all
FUNCentries withbpf_prefix. Many are kfuncs (and many are helpers, mixed in).
Day 24 covers BTF spelunking in detail.
The lab
Continue in the repository’s ebpf/labs directory. make kfunc_demo compiles the exact anchored listing shown below.
kfunc_demo.bpf.c:
#include "vmlinux.h"
#include <bpf/bpf_helpers.h>
#include <bpf/bpf_tracing.h>
char LICENSE[] SEC("license") = "GPL";
extern struct task_struct *bpf_task_acquire(struct task_struct *p) __ksym;
extern void bpf_task_release(struct task_struct *p) __ksym;
SEC("fentry/filename_unlinkat")
int BPF_PROG(on_unlink)
{
struct task_struct *cur = bpf_get_current_task_btf();
struct task_struct *acq = bpf_task_acquire(cur);
if (!acq)
return 0; /* KF_RET_NULL: refcount may have been 0 */
bpf_printk("acquired pid=%d", acq->pid);
bpf_task_release(acq); /* KF_ACQUIRE -> must release on every path */
return 0;
}
The userspace loader (kfunc_demo.c) is the same skeleton-driven open/load/attach pattern as earlier days; it attaches the fentry and then waits for Ctrl-C while the program writes to trace_pipe.
#include <errno.h>
#include <signal.h>
#include <stdio.h>
#include <string.h>
#include <unistd.h>
#include <bpf/libbpf.h>
#include "kfunc_demo.skel.h"
static volatile sig_atomic_t exiting;
static void handle_signal(int signal_number)
{
(void)signal_number;
exiting = 1;
}
static int install_signal_handlers(void)
{
const struct sigaction action = {
.sa_handler = handle_signal,
};
if (sigaction(SIGINT, &action, NULL) != 0 ||
sigaction(SIGTERM, &action, NULL) != 0) {
fprintf(stderr, "failed to install signal handlers: %s\n",
strerror(errno));
return -errno;
}
return 0;
}
int main(void)
{
struct kfunc_demo_bpf *skel = NULL;
int err;
setvbuf(stdout, NULL, _IOLBF, 0);
err = install_signal_handlers();
if (err)
return 1;
skel = kfunc_demo_bpf__open();
if (!skel) {
fprintf(stderr, "failed to open kfunc_demo BPF skeleton\n");
return 1;
}
err = kfunc_demo_bpf__load(skel);
if (err) {
fprintf(stderr, "failed to load kfunc_demo BPF programs: %s\n",
strerror(-err));
goto cleanup;
}
err = kfunc_demo_bpf__attach(skel);
if (err) {
fprintf(stderr, "failed to attach kfunc_demo BPF programs: %s\n",
strerror(-err));
goto cleanup;
}
puts("Attached fentry/filename_unlinkat; watch trace_pipe. "
"Press Ctrl-C to detach.");
while (!exiting)
pause();
err = 0;
cleanup:
kfunc_demo_bpf__destroy(skel);
return err != 0;
}
Build, load, attach, observe:
make kfunc_demo
sudo ./.output/day20/kfunc_demo & # loads + attaches the fentry
sudo cat /sys/kernel/debug/tracing/trace_pipe & # stream events live
for i in 1 2 3; do touch /tmp/x$i && rm /tmp/x$i; done
You should see one acquired pid=N line per delete:
rm-12345 [001] ...1 842.713604: bpf_trace_printk: acquired pid=12345
rm-12348 [000] ...1 842.714902: bpf_trace_printk: acquired pid=12348
rm-12351 [001] ...1 842.716071: bpf_trace_printk: acquired pid=12351
filename_unlinkat fires once per rm, so the count of lines matches the number of deletes. The loader must stay backgrounded while you observe — killing it detaches the fentry. When done, tear everything down:
sudo pkill -f trace_pipe # stop the streaming cat
sudo pkill kfunc_demo # detach the fentry (loader was started with sudo)
What to break
Forget release
Comment out bpf_task_release(acq). Verifier rejects:
Unreleased reference id=1 alloc_insn=2
The number tells you which acquire was leaked (multiple acquires get distinct ids). In runtime terms: you bumped rcu_users and never dropped it — exactly the leak the static check exists to forbid.
Conditional release
if (acq->pid > 1000)
bpf_task_release(acq);
return 0;
Verifier rejects — there’s an exit path (when pid <= 1000) where the ref is leaked. The rejection is the same class of leak error as the forget-release case:
Unreleased reference id=1 alloc_insn=2
The id is 1 because there is only a single acquire in this program. The verifier requires release on every exit path. Fix: release before any conditional return:
__u32 pid = acq->pid;
bpf_task_release(acq);
if (pid > 1000) return 0;
Double release
bpf_task_release(acq);
bpf_task_release(acq);
Rejected: the second call sees the id as already closed. (Statically this is the verifier refusing; at runtime an unchecked double-drop would push rcu_users below the live set and free a task other holders still use.)
Call a kfunc the program type isn’t allowed
extern struct bpf_cpumask *bpf_cpumask_create(void) __ksym;
extern void bpf_cpumask_release(struct bpf_cpumask *cm) __ksym;
SEC("xdp")
int xdp_prog(struct xdp_md *ctx) {
struct bpf_cpumask *cm = bpf_cpumask_create();
if (cm) bpf_cpumask_release(cm);
return XDP_PASS;
}
Unlike the three breaks above, this one can’t be reproduced by editing the fentry lab — cpumask kfuncs are allowed for tracing programs, so the edit has to be a separate, complete XDP object with its own loader (the program above is loadable as written). The cpumask kfunc family is registered only for TRACING, STRUCT_OPS, and SYSCALL program types (kernel/bpf/cpumask.c), not XDP. The verifier rejects at the call site — before it ever reaches the return-path or reference-leak checks — with:
calling kernel function bpf_cpumask_create is not allowed
(Note: the generic set — including bpf_task_acquire — is registered for XDP, so that one would load; it’s just meaningless there. The cpumask family is the one that genuinely isn’t in XDP’s allowance set.)
There are no Dumb Questions
Q: Why does
bpf_task_acquirebumprcu_usersinstead ofusage? Wouldn’tusagekeep the struct alive too?A: Both counters keep the allocation alive, but they express different intents.
usageguards the raw allocation;rcu_usersguards the task’s reachability across an RCU grace period — which is the lifetime model BPF programs run under (RCU read sides). Bumpingrcu_userskeeps the task valid for exactly as long as a BPF program is allowed to look at it, and the matching drop,put_task_struct_rcu_user, schedules the real free viacall_rcuonly after a grace period. Usingusagewould be the wrong lifetime for the RCU-based access pattern. (Don’t confuse this body-internal choice with theKF_RCUflag — that flag is about the input argument’s trust level, not which counter the body bumps.)Q: If the verifier guarantees I release every reference, why does
refcount_tstill need runtime overflow/underflow protection?A: Because BPF is not the only thing touching that counter. The same
rcu_usersis incremented and decremented by ordinary kernel code throughout the task’s life.refcount_t’s saturation is a defense-in-depth property of the counter itself, independent of who holds it. The verifier proves your BPF program is balanced; therefcount_tAPI protects the counter against bugs anywhere in the kernel.Q: The error says
reference has not been acquired beforefor both a stray release and a double release. Are they really the same thing?A: To the verifier, yes. It tracks open ref ids; a release either closes an open id or it doesn’t. A double release closes the id on the first call, so the second call is releasing something with no matching open id — indistinguishable from releasing a pointer you never acquired. Same internal condition, same message.
What to read in the kernel
-
Documentation/bpf/kfuncs.rst— official categories and flags. Read top to bottom; ~10 pages. The reference for what each KF_* flag means. -
kernel/bpf/helpers.c:2733and surrounding —bpf_task_acquire,bpf_task_release, and friends. Real kfunc implementations. Note the__bpf_kfuncannotation and how short these are — kfuncs are usually thin wrappers around kernel APIs (here, aroundrefcount_inc_not_zeroandput_task_struct_rcu_user). -
include/linux/refcount.h:333—refcount_inc_not_zero. Read the comment block above it: the “increment unless zero” rule and the__must_checkannotation are the runtime reasonbpf_task_acquirecan return NULL. -
include/linux/sched.h:840and:1564— the two task refcounts,usageandrcu_users. See them declared side by side; notercu_userssits next tostruct rcu_head rcu. -
kernel/exit.c:234—put_task_struct_rcu_user. Six lines:refcount_dec_and_testthencall_rcu. The release half of the contract. -
kernel/bpf/helpers.c:4703—BTF_KFUNCS_START(generic_btf_ids). The big “general purpose” kfunc set;bpf_task_acquireis registered at:4725withKF_ACQUIRE | KF_RCU | KF_RET_NULL. Skim the list — it’s the catalog of what a tracing program can call. -
kernel/bpf/cpumask.c— a complete kfunc family in one file (~530 lines). Read top to bottom. Notice the pattern: short C functions + aBTF_KFUNCS_STARTblock + aregister_btf_kfunc_id_setcall at module init. This is the template for adding new kfuncs. -
kernel/bpf/btf.c:8996—register_btf_kfunc_id_set. The registration entry. Short function (~15 lines). Note the per-enum bpf_prog_typeregistration. -
kernel/bpf/verifier.c— searchKF_ACQUIRE. The verifier check that creates a new ref id. Trace forward to see howacquire_reference_stateinteracts withrelease_reference_state. -
tools/testing/selftests/bpf/progs/task_kfunc_*.c— test programs exercising every aspect of acquire/release/store-in-map. Real, working examples.
Bullet Points
- A
refcount_tis a saturating, overflow-protected atomic counter the kernel uses to decide when to free a shared object: holders increment on acquire, drop on release, and the drop that reaches 0 frees. The verifier’s acquire/release tracking statically enforces this runtime contract. refcount_inc_not_zeroincrements only if the count is > 0. A 0 count means the object is already dying, so the bump fails andbpf_task_acquirereturns NULL — which is exactly why it carriesKF_RET_NULL. “Must check for NULL” and “refcount could be zero” are the same fact.- A
task_structhas two refcounts:usage(sched.h:840) guards the allocation;rcu_users(sched.h:1564) guards the RCU-grace-period lifetime.bpf_task_acquirebumpsrcu_users;bpf_task_releasecallsput_task_struct_rcu_user. Separately,KF_RCUon the registration constrains the input arg (it may be RCU-only, so its refcount could be 0) — which is why the body needsrefcount_inc_not_zeroand the kfunc needsKF_RET_NULL. - kfuncs are in-tree kernel functions exposed to BPF via BTF. Not UAPI; can evolve.
- Marked
__bpf_kfunc, registered inBTF_KFUNCS_STARTblocks. KF_ACQUIRE/KF_RELEASEflags drive verifier reference-tracking.- Declare in BPF code with
extern T name(args) __ksym;. - The verifier statically tracks reference lifetimes — leaks (
Unreleased reference id=N) and stray releases (reference has not been acquired before) are rejected at load time, turning two classic kernel-C bug classes into compile errors. - Per-program-type registration: not all kfuncs everywhere.
- Discover: kernel source
BTF_KFUNCS_START,Documentation/bpf/kfuncs.rst,bpftool btf dump. - New BPF features (cpumask, dynptr, lists, refcount, …) ship as kfuncs, not helpers.
Check question
Why does the verifier check release lifetimes statically rather than at runtime?
Click to reveal answer
Answer: Static checking is fast and total. A runtime ref-leak detector would either (a) impose per-call overhead on every BPF program (fail at scale where BPF is in the data path), or (b) only catch leaks after the fact, which is too late — by then the rcu_users increment has already happened and the kernel resource is unrecoverable.
Static analysis catches every leak at load time, before the program ever runs. The cost is paid by the author (writing release-correct code) instead of by every kernel that runs the program. The verifier already tracks every register’s type, so adding reference-id tracking — one ref id per KF_ACQUIRE return, closed by the matching KF_RELEASE — is a small extension of the existing analysis. The tradeoff is well-understood: more friction at load time in exchange for guaranteed safety at runtime.
The same principle drives the rest of the verifier — bounds checks, pointer types, register typing — all done statically. BPF’s safety story is: prove it before running it. And it goes one step further than ordinary kernel C: the very refcount_t operations that a kernel developer must balance by hand (forget one and you leak; double one and you corrupt) become things the verifier proves balanced for you.
Tomorrow
Day 21: store an acquired kptr in a map across program invocations.
Day 21 — kptrs in maps: cross-invocation refcounted state
Today’s mission: save a
task_struct *into a hash map at one event, retrieve it later in another, and use the fields — all with refcounts that the verifier proves correct end to end. Along the way you’ll learn three things:
- the one mechanism behind “auto-release on map delete” (the kernel’s
btf_record),- why a release kfunc is necessary-but-not-sufficient to stash a pointer,
- and exactly why the slot op must be an atomic exchange and not a plain store.
Total time: ~110 minutes.
The problem with raw pointers
Day 20’s lab acquired and released a kernel pointer within a single BPF program invocation. That’s safe because the resource’s lifetime is bounded by the function call — you ran in the task’s own context, so the task was trivially alive the whole time.
But often you need to save a pointer across invocations. Examples:
- A tracing program that tags an outgoing connection with the originating task, looks the task up later when the connection completes.
- A sched_ext program that remembers a task’s last-seen state across enqueue and dispatch.
- A networking program that associates an L2 socket with the parent process.
Naively saving an acquired task_struct * into a plain (non-__kptr) map value field fails — the verifier rejects storing the referenced pointer:
R1 leaks addr into map
(the real message, verifier.c:6355). The verifier doesn’t trust that the pointer will remain valid. The task could be freed between the save and the read; reading would be a use-after-free. That last sentence is the whole problem, and to believe today’s solution defuses it you need to know exactly what keeps a task_struct alive — so let’s pin that down before we reach for the fix.
Refresher: the rcu_users refcount that keeps an exited task readable
Day 20 walked through the mechanics: bpf_task_acquire does refcount_inc_not_zero(&p->rcu_users) and bpf_task_release calls put_task_struct_rcu_user(p). The one new point that makes cross-invocation stashing sound is what that dedicated rcu_users count (refcount_t rcu_users; at include/linux/sched.h:1564) buys you: it keeps the task_struct allocation alive for safe reading even after the thread has called do_exit(). So between your fentry-time save and your fexit-time read (or a read minutes later), the traced thread may exit — and the bytes your stashed pointer points at are still a valid task_struct, not freed-and-reused memory.
Two consequences fall out of this:
- The NULL check on acquire isn’t ceremony.
refcount_inc_not_zeroreturns false if the task is already at zerorcu_users— i.e. fully dying. That’s whybpf_task_acquireisKF_RET_NULL(Day 20) and the lab below checksif (!acq) return 0;. The NULL case is literally “task already gone.” - Releasing can free the struct. When the last
rcu_usersref drops — whether via yourbpf_task_releaseor via the destructor the kernel runs at map-delete time —put_task_struct_rcu_userschedules the final free (after an RCU grace period). The stashed ref genuinely participates in the task’s lifetime; the kptr machinery isn’t a side-channel.
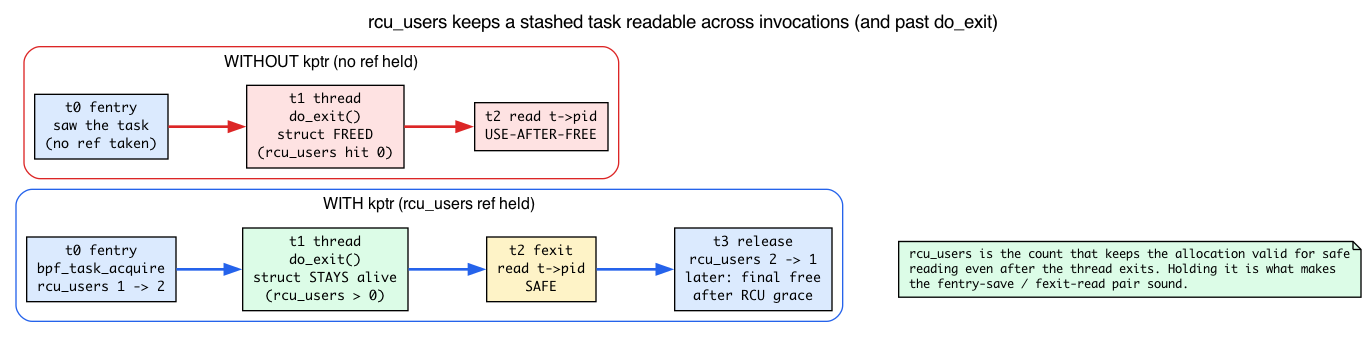
So the lifetime guarantee is real. What we need now is a way to hold that rcu_users ref inside a map slot, and to drop it correctly later — even if no BPF program is running when “later” arrives.
kptrs: refcounted pointer slots
The solution is __kptr — a struct annotation that tells the verifier “this slot holds a refcounted kernel pointer; track it like the kfunc machinery does, but stored persistently in a map.”
struct val {
struct task_struct __kptr *t;
};
struct {
__uint(type, BPF_MAP_TYPE_HASH);
__uint(max_entries, 1024);
__type(key, __u32);
__type(value, struct val);
} stash SEC(".maps");
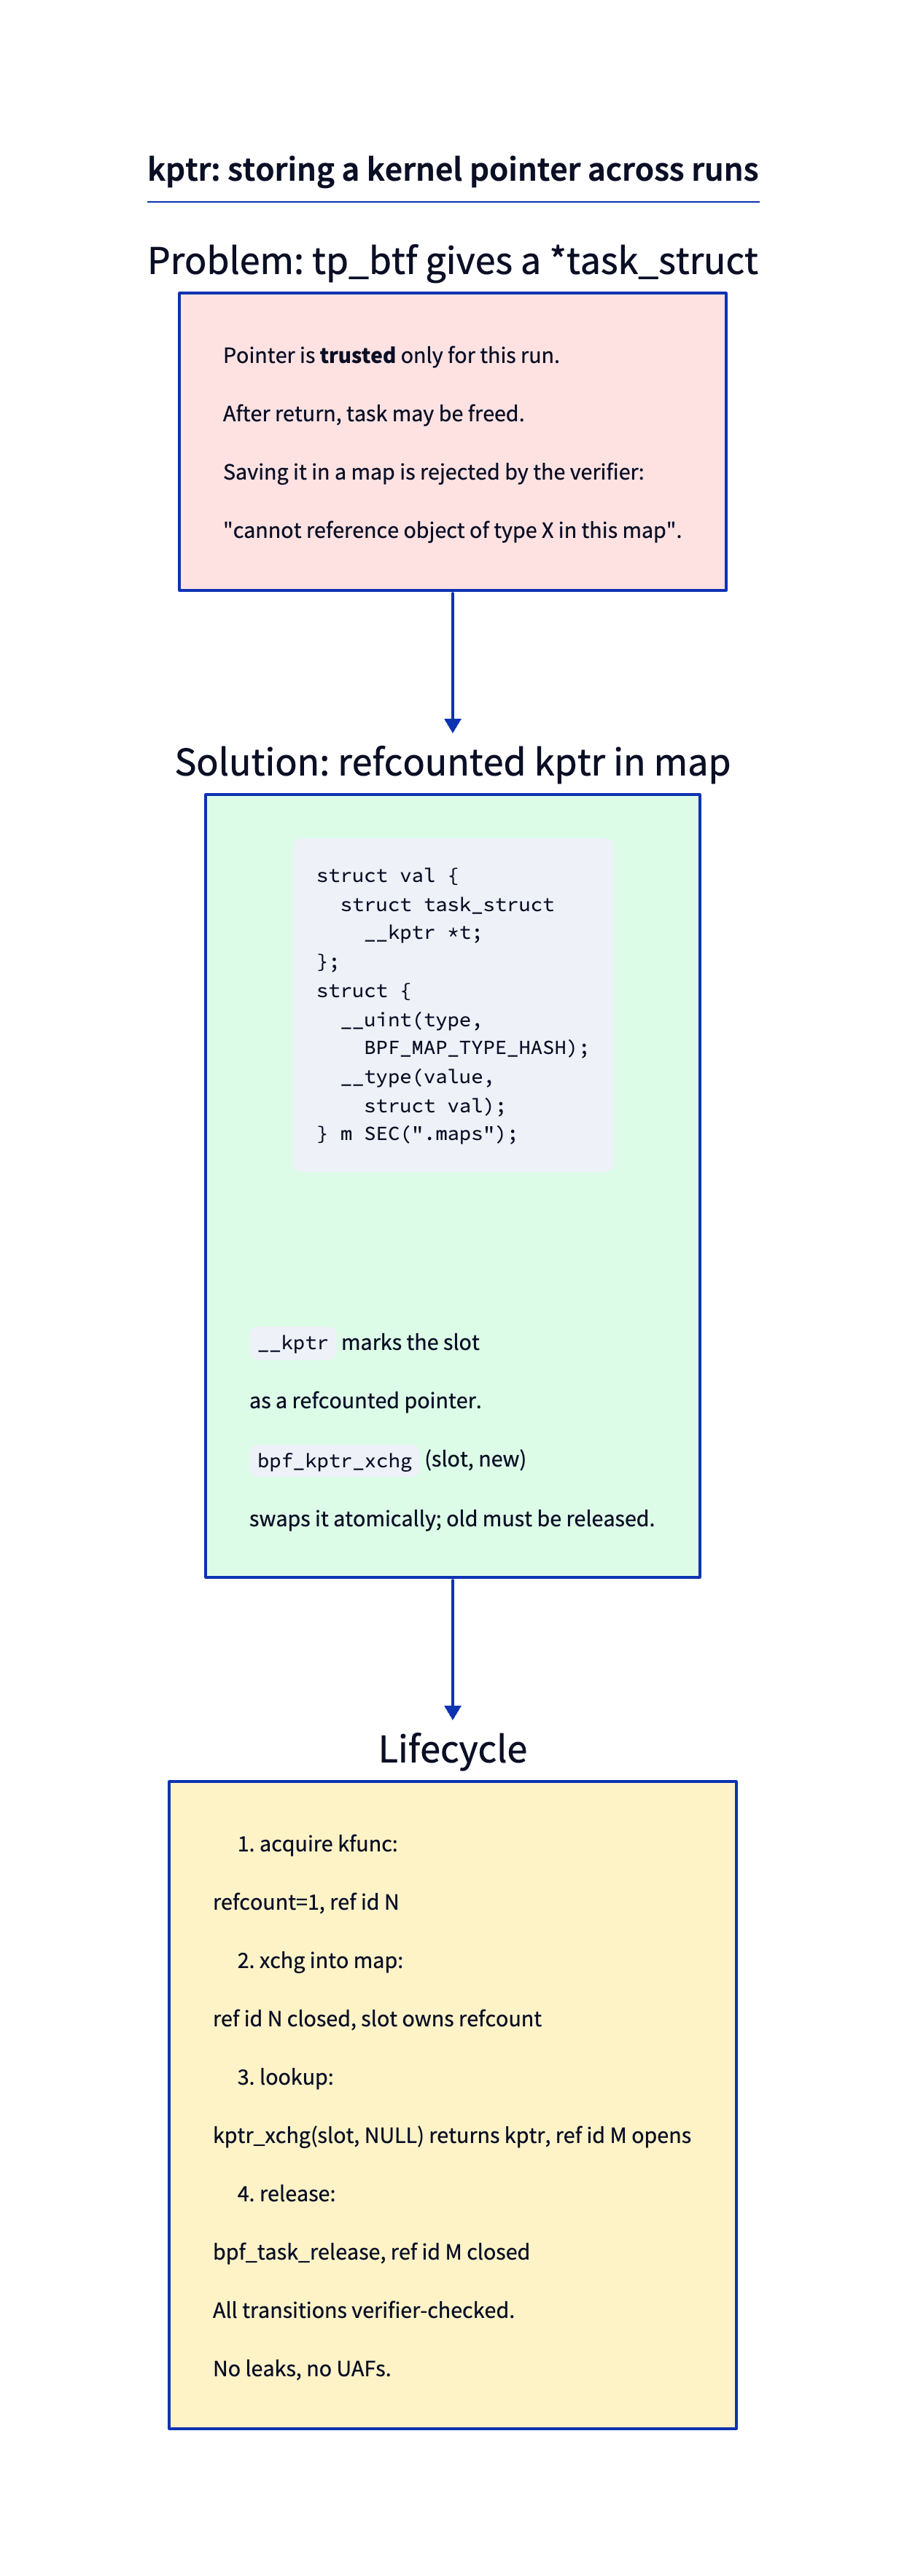
The __kptr annotation modifies the field: the verifier and the BPF runtime both treat that 8-byte slot as a refcounted pointer that may be NULL or may hold a valid kernel object. The runtime knows how to release it (via the kptr’s registered destructor) when the map entry is deleted.
Two flavors:
__kptr— the slot owns a refcount. Inserting must consume an acquired reference; reading must take ownership atomically. (Older code may use__kptr_ref, but that spelling was removed — current libbpf defines__kptr,__kptr_untrusted,__percpu_kptr, and__uptrintools/lib/bpf/bpf_helpers.h:193-196, each abtf_type_tagattribute.)__kptr_untrusted— an untrusted kptr: no refcount, no liveness guarantee. It may be stored with a plain assignment and loaded directly, but the loaded pointer is markedPTR_UNTRUSTED, so dereferences are treated as potentially-faulting (probe-read) accesses rather than trusted ones.
We focus on __kptr (refcounted).
But “the runtime knows how to release it” is doing a lot of work in that paragraph. How does the runtime know that one particular 8-byte field, out of all the bytes in your value struct, is special? And how does it know which function to call to free it? That’s the mechanism the rest of this chapter is built on, so we’ll teach it before the lab — not after.
How the kernel knows a field is special: btf_record
Here is the central idea, and once you have it the whole “auto-release on delete” story stops being magic.
When you create a map whose value type contains a __kptr (or a bpf_spin_lock, a bpf_timer, a bpf_list_head, …), the kernel parses the value’s BTF once, at map-creation time, and builds a small table called a btf_record. The record lists each “special” field: its byte offset, its type tag, and — for kptrs — the destructor to call when the field is freed.
A __kptr is not a language feature the runtime understands intrinsically. It is just one entry in a general “this field needs special handling” framework. The field-type tags live in enum btf_field_type (include/linux/bpf.h:194):
/* include/linux/bpf.h:194 */
enum btf_field_type {
BPF_SPIN_LOCK = (1 << 0), /* :195 */
BPF_TIMER = (1 << 1), /* :196 */
BPF_KPTR_UNREF = (1 << 2), /* :197 — the __kptr_untrusted slot */
BPF_KPTR_REF = (1 << 3), /* :198 — refcounted; what THIS chapter uses */
BPF_KPTR_PERCPU = (1 << 4), /* :199 */
BPF_KPTR = BPF_KPTR_UNREF | BPF_KPTR_REF | BPF_KPTR_PERCPU, /* :200 */
BPF_LIST_HEAD = (1 << 5), /* :201 */
/* ... timers, lists, rbtrees, refcount, workqueue ... */
};
The builder is btf_parse_fields() (kernel/bpf/btf.c:4072). It walks the value struct’s members and recognizes the btf_type_tag("kptr") that the __kptr macro emits; when it finds one it records {offset, BPF_KPTR_REF, dtor}. This is the deep reason a plain v->t = ptr is meaningless to the runtime: the slot is “special” precisely because it appears in the btf_record, and only operations the verifier routes through that knowledge (the xchg, the free walker) honor it.
Now the payoff. On every element free — userspace map delete, whole-map destroy, hashtab eviction — the kernel calls bpf_obj_free_fields(record, value) (kernel/bpf/syscall.c:810), which loops the record and dispatches per field type:
/* kernel/bpf/syscall.c:810 — bpf_obj_free_fields, abridged */
for (i = 0; i < rec->cnt; i++) {
...
switch (fields[i].type) {
case BPF_SPIN_LOCK: break; /* nothing to free */
case BPF_TIMER: bpf_timer_cancel_and_free(...); break;
case BPF_KPTR_UNREF: WRITE_ONCE(*(u64 *)field_ptr, 0); break; /* just zero it */
case BPF_KPTR_REF:
case BPF_KPTR_PERCPU:
xchgd_field = (void *)xchg((unsigned long *)field_ptr, 0); /* atomic-take */
if (xchgd_field)
field->kptr.dtor(xchgd_field); /* call the registered destructor */
break;
...
}
}
This loop is the “automatic release.” Notice three things:
- It’s the same loop that cancels timers and drains lists — kptrs are not a special case, they’re one
casein a general walker. - For a refcounted kptr it does an
xchg-to-NULL first, then callsfield->kptr.dtor— the destructor thatbtf_parse_fieldsstored in the record at map-creation time. - It runs unconditionally on free. That is the precise reason you can’t leak by deleting: whether userspace deletes one entry, the map is torn down, or your program crashed and userspace drains the map afterward, every path routes through
bpf_obj_free_fields. You can see the hashtab call sites for yourself atkernel/bpf/hashtab.c:475, 852, 1022, 1032, 1040— per-element free and delete all funnel here.
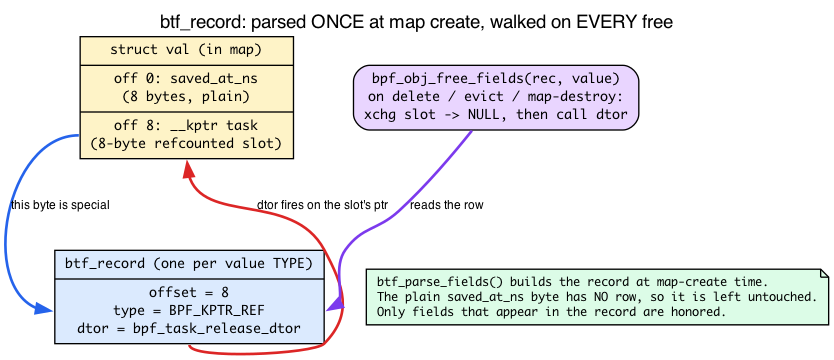
There are no Dumb Questions
Q: Is the
btf_recordper-map or per-entry?A: Per-map (really per value type). It’s built once when the map is created and shared by every entry. An entry is just bytes; the record is the schema that says which of those bytes are special and how to free them.
Q: What if my value struct has no special fields?
A: Then
btf_parse_fieldsreturns a NULL/empty record, andbpf_obj_free_fieldsearly-returns (IS_ERR_OR_NULL(rec)). Plain maps pay nothing. The machinery only kicks in when you actually declare a kptr (or spinlock, timer, list, …).
What you can store — and the destructor registration table
So bpf_obj_free_fields calls field->kptr.dtor. Where does that function pointer come from, and why can you stash a task_struct but not a struct sock? This is the part that trips up everyone fresh off Day 20.
Day 20 taught acquire/release kfuncs (KF_ACQUIRE / KF_RELEASE). Those govern refcount handling within a single program run — a BPF program calls bpf_task_release itself, on the stack, before it exits. Stashing a kptr needs something extra: the kernel must be able to drop the ref later, from bpf_obj_free_fields, with no BPF program on the stack at all. That requires a separate, independently-registered lookup table mapping type → destructor function.
That table is installed by register_btf_id_dtor_kfuncs(dtors, count, module) (kernel/bpf/btf.c:9083, EXPORT_SYMBOL_GPL at :9156). It takes an array of {btf_id, kfunc_btf_id} pairs meaning “for objects of this struct type, call this function to release one ref.” Only types that appear in some registered dtor table can be a __kptr (BPF_KPTR_REF) map slot. If btf_parse_fields finds a kptr field whose type has no registered destructor, it rejects the map.
There’s a subtle shape difference worth seeing. The destructor entry point is a thin void(void *) wrapper, distinct from the typed release kfunc:
/* kernel/bpf/helpers.c:2744 — the typed kfunc BPF programs call */
__bpf_kfunc void bpf_task_release(struct task_struct *p)
{
put_task_struct_rcu_user(p);
}
/* kernel/bpf/helpers.c:2749 — the void* destructor the kernel calls generically */
__bpf_kfunc void bpf_task_release_dtor(void *p)
{
put_task_struct_rcu_user(p);
}
CFI_NOSEAL(bpf_task_release_dtor); /* :2753 */
The void * shape is what bpf_obj_free_fields can call without knowing the type; the typed bpf_task_release is what your program calls. They drop the same rcu_users ref — which ties back to the refresher above: “auto-release on map delete” and your in-program release are the identical operation, reached two different ways.
The pairing is built from a BTF id list (kernel/bpf/helpers.c):
/* helpers.c:4768 area */
BTF_ID(struct, task_struct) /* :4769 */
BTF_ID(func, bpf_task_release_dtor) /* :4770 */
#ifdef CONFIG_CGROUPS
BTF_ID(struct, cgroup) /* :4772 */
BTF_ID(func, bpf_cgroup_release_dtor)/* :4773 */
#endif
and registered as generic_dtors[] (helpers.c:4877) via register_btf_id_dtor_kfuncs(generic_dtors, ...) at helpers.c:4896.
The supported set (and the sock/nf_conn gotcha)
The stashable set is assembled across subsystems, each calling register_btf_id_dtor_kfuncs at init — which is why “the list grows each release.” As of 7.x:
struct task_struct __kptr *— released bybpf_task_release(dtorbpf_task_release_dtor, registered inkernel/bpf/helpers.c).struct cgroup __kptr *— released bybpf_cgroup_release(dtor athelpers.c:2779).struct bpf_cpumask __kptr *— released bybpf_cpumask_release(registered inkernel/bpf/cpumask.c:529).struct sk_buff __kptr *— released bybpf_kfree_skb_dtor(net/sched/bpf_qdisc.c:205, registered atbpf_qdisc.c:471, BTF id at:458).struct bpf_crypto_ctx __kptr *— released by the crypto dtor (registered inkernel/bpf/crypto.c:394).
Note: struct sock is released by a legacy helper (bpf_sk_release, BPF_FUNC_sk_release — a BPF_CALL_1 at net/core/filter.c:7199, not a KF_RELEASE kfunc), while struct nf_conn is released by a release kfunc (bpf_ct_release, KF_RELEASE, net/netfilter/nf_conntrack_bpf.c:513). Different mechanisms — but neither type is registered as a kptr destructor via register_btf_id_dtor_kfuncs, so neither is stashable in a __kptr map slot. “Has a release helper/kfunc” and “is registered as a kptr destructor” are two different registrations. bpf_sk_release/bpf_ct_release exist and are callable in-program; nobody registered a struct sock → destructor or struct nf_conn → destructor entry, so btf_parse_fields finds no dtor and rejects the field. Acquire/release within a single program works; cross-invocation map storage does not.
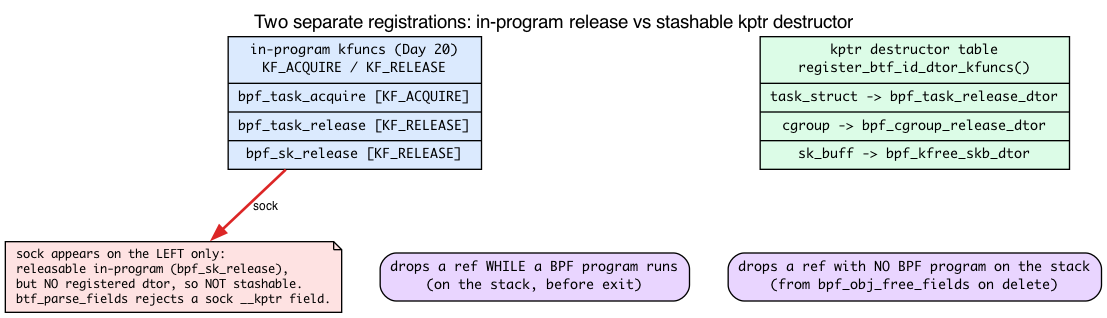
The list grows with each kernel release. Check Documentation/bpf/kfuncs.rst for the current set.
How operations work: the xchg-only API
The only legal operations on a __kptr slot are via bpf_kptr_xchg:
struct task_struct *bpf_kptr_xchg(struct task_struct **dst, struct task_struct *new);
It atomically swaps *dst with new and returns the old value. Plain stores (v->t = ptr;) are rejected. Before we list the rules, let’s understand why it must be an atomic exchange — because that “why” is exactly what the Check question at the end leans on.
Why an atomic exchange, not a plain store
Recall from Day 2 that a map slot is shared kernel memory, readable and writable concurrently across CPUs — that’s why bumping a counter there needs an atomic __sync_fetch_and_add. The same is true of a kptr slot: two program invocations on different CPUs can touch the same 8-byte field at the same instant.
Here’s the kptr-specific twist Day 2 didn’t cover: ownership of a refcount must move atomically. xchg(slot, new) reads the old pointer and writes the new one in a single, indivisible instruction, so exactly one caller observes each old value. Picture the alternative — two steps, “read old” then “store new”:
- Two CPUs both read the same non-NULL old pointer, both call
bpf_task_releaseon it → double-free (thercu_userscount drops twice for one ref). - Or a store clobbers a pointer whose ref nobody released → leak (an
rcu_usersref stranded forever).
A plain store v->t = ptr is rejected at verify time for exactly this reason: it writes the new pointer but never hands back the old one, so the previous occupant’s refcount is silently dropped on the floor — and it isn’t indivisible anyway. bpf_kptr_xchg is the only op because it’s the only one that both transfers ownership and surfaces the previous owner for you to release.
The “take” direction is the same trick: bpf_kptr_xchg(&slot, NULL) atomically lifts the pointer out and zeroes the slot, so a concurrent taker on another CPU gets NULL instead of a second copy of the same ref. That’s what makes the retrieve path in the lab safe.
The implementation is literally one instruction (kernel/bpf/helpers.c:1731):
/* kernel/bpf/helpers.c:1731 — bpf_kptr_xchg */
BPF_CALL_2(bpf_kptr_xchg, void *, dst, void *, ptr)
{
unsigned long *kptr = dst;
return xchg(kptr, (unsigned long)ptr);
}
All the safety is in the hardware atomicity plus the verifier’s insistence that you account for the returned old value.
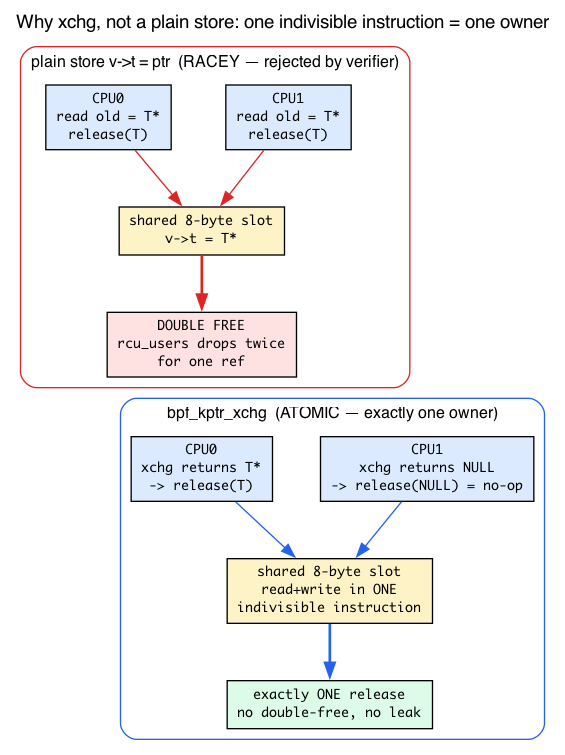
The ref-tracking rules
- To store an acquired pointer into the slot:
bpf_kptr_xchg(&v->t, acq). The verifier transfers the ref id fromacq(your local variable) to the map slot. The slot now owns the refcount. - The return value of
bpf_kptr_xchgis the previous occupant. You must release it. If non-NULL, callbpf_task_release(old). - To take the pointer out:
bpf_kptr_xchg(&v->t, NULL)— atomic-take, leaving slot empty. The returned pointer carries a fresh ref id you must release later. - If the map entry is deleted while the slot is non-NULL, the kernel automatically calls the registered destructor (
bpf_task_release_dtorfor tasks) on the slot’s pointer atbpf_obj_free_fieldstime — the walker we dissected above. No manual cleanup needed; you can’t leak by deleting.
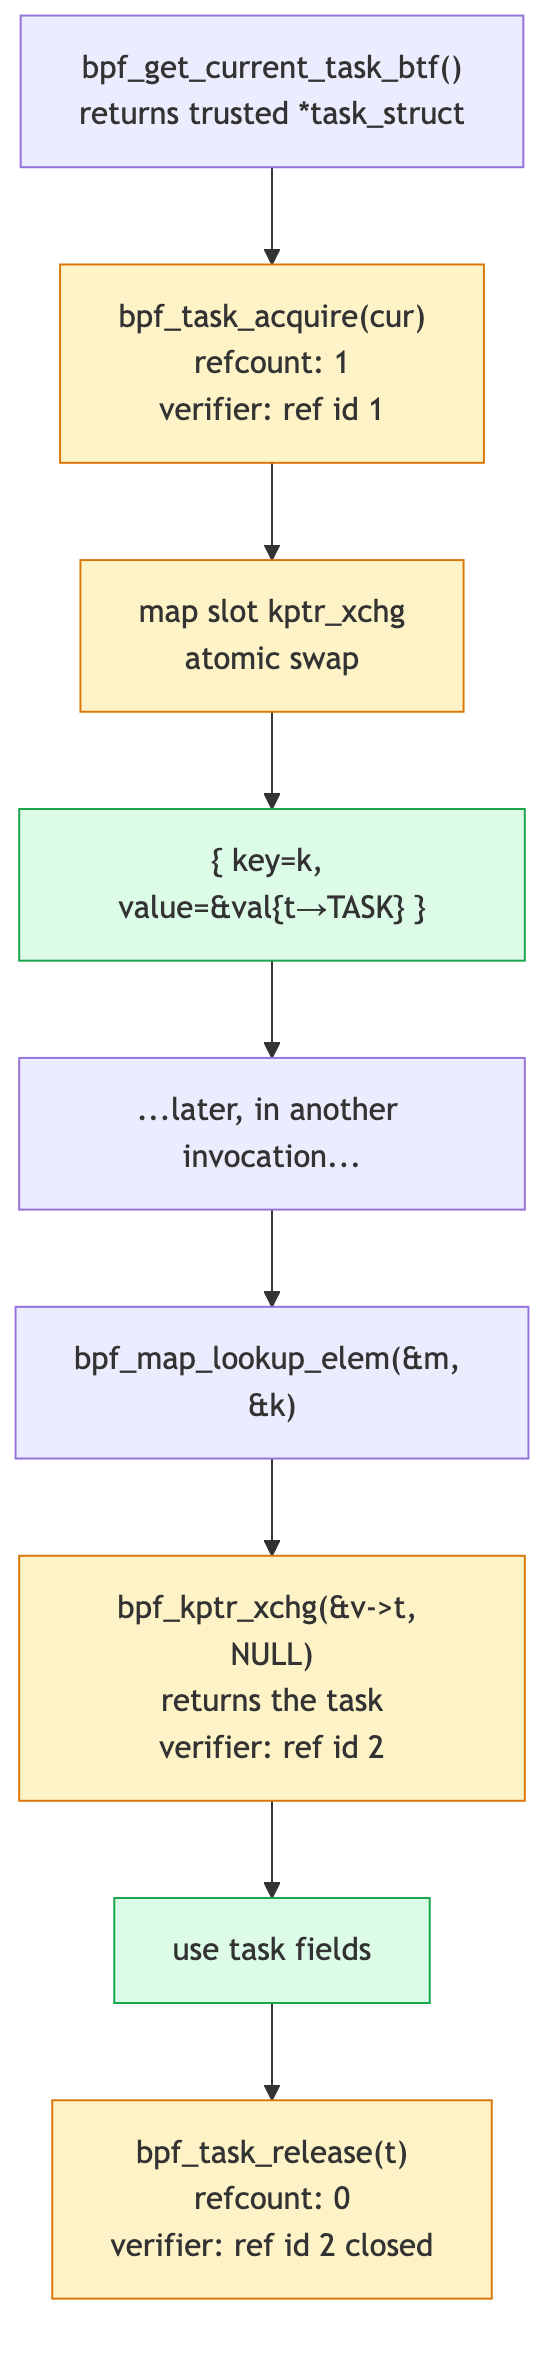
Multiple kptrs in one value struct
You can have multiple kptr fields in the same value:
struct val {
struct task_struct __kptr *task;
struct cgroup __kptr *cg;
__u64 saved_at_ns;
};
Each is exchanged independently. The btf_record for this value type has two kptr entries (one per offset) plus nothing for saved_at_ns — which is plain memory. When the map entry is destroyed, bpf_obj_free_fields walks the record and releases every kptr field in turn; the non-kptr bytes are ignored. Same mechanism, two rows in the table.
The lab
#include "vmlinux.h"
#include <bpf/bpf_helpers.h>
#include <bpf/bpf_tracing.h>
char LICENSE[] SEC("license") = "GPL";
extern struct task_struct *bpf_task_acquire(struct task_struct *p) __ksym;
extern void bpf_task_release(struct task_struct *p) __ksym;
struct val {
struct task_struct __kptr *task;
__u64 saved_at_ns;
};
struct {
__uint(type, BPF_MAP_TYPE_HASH);
__uint(max_entries, 1024);
__type(key, __u32);
__type(value, struct val);
} stash SEC(".maps");
SEC("fentry/filename_unlinkat")
int BPF_PROG(on_unlink)
{
struct task_struct *cur = bpf_get_current_task_btf();
struct task_struct *acq = bpf_task_acquire(cur);
if (!acq)
return 0;
__u32 tid = bpf_get_current_pid_tgid() & 0xffffffff;
/* Initial map upsert with NULL kptr + timestamp */
struct val v = { .task = NULL, .saved_at_ns = bpf_ktime_get_ns() };
bpf_map_update_elem(&stash, &tid, &v, BPF_ANY);
/* Lookup the slot to xchg the kptr in */
struct val *vp = bpf_map_lookup_elem(&stash, &tid);
if (!vp) {
bpf_task_release(acq); /* couldn't insert; release manually */
return 0;
}
/* Move acq into the map slot. xchg returns previous occupant. */
struct task_struct *old = bpf_kptr_xchg(&vp->task, acq);
if (old)
bpf_task_release(old);
return 0;
}
SEC("fexit/filename_unlinkat")
int BPF_PROG(on_unlink2)
{
/* Genuinely "later": fexit fires on the function's *return*, after the
* fentry program above has already stashed the task on entry. */
__u32 tid = bpf_get_current_pid_tgid() & 0xffffffff;
struct val *vp = bpf_map_lookup_elem(&stash, &tid);
if (!vp)
return 0;
struct task_struct *t = bpf_kptr_xchg(&vp->task, NULL);
if (!t)
return 0; /* slot was empty */
bpf_printk("retrieved pid=%d, was saved %llu ns ago",
t->pid, bpf_ktime_get_ns() - vp->saved_at_ns);
bpf_task_release(t);
return 0;
}
Why filename_unlinkat? It’s a real, stable function — int filename_unlinkat(int dfd, struct filename *name) at fs/namei.c:5536 — on the path of every rm/unlink. The fentry program runs on the way in and stashes; the fexit program runs on the way out (the function’s return) and retrieves. So the save and the read are genuinely separated in time by the body of filename_unlinkat, which is the cross-invocation scenario this whole chapter is about.
Note the manual-release path inside the failed-lookup branch: if the bpf_map_lookup_elem right after the upsert somehow returns NULL, acq still holds an rcu_users ref that the map never took ownership of, so you must bpf_task_release(acq) yourself or leak it. The kptr machinery only auto-frees what actually made it into a slot.
Build and run (the loader is the standard skeleton open/load/attach pattern and attaches both the fentry and fexit programs):
#include <errno.h>
#include <signal.h>
#include <stdio.h>
#include <string.h>
#include <unistd.h>
#include <bpf/libbpf.h>
#include "task_assoc.skel.h"
static volatile sig_atomic_t exiting;
static void handle_signal(int signal_number)
{
(void)signal_number;
exiting = 1;
}
static int install_signal_handlers(void)
{
const struct sigaction action = {
.sa_handler = handle_signal,
};
if (sigaction(SIGINT, &action, NULL) != 0 ||
sigaction(SIGTERM, &action, NULL) != 0) {
fprintf(stderr, "failed to install signal handlers: %s\n",
strerror(errno));
return -errno;
}
return 0;
}
int main(void)
{
struct task_assoc_bpf *skel = NULL;
int err;
setvbuf(stdout, NULL, _IOLBF, 0);
err = install_signal_handlers();
if (err)
return 1;
skel = task_assoc_bpf__open();
if (!skel) {
fprintf(stderr, "failed to open task_assoc BPF skeleton\n");
return 1;
}
err = task_assoc_bpf__load(skel);
if (err) {
fprintf(stderr, "failed to load task_assoc BPF programs: %s\n",
strerror(-err));
goto cleanup;
}
err = task_assoc_bpf__attach(skel);
if (err) {
fprintf(stderr, "failed to attach task_assoc BPF programs: %s\n",
strerror(-err));
goto cleanup;
}
puts("Attached fentry+fexit/filename_unlinkat; watch trace_pipe. "
"Press Ctrl-C to detach.");
while (!exiting)
pause();
err = 0;
cleanup:
task_assoc_bpf__destroy(skel);
return err != 0;
}
make task_assoc
sudo ./.output/day21/task_assoc &
touch /tmp/x && rm /tmp/x # fentry stashes on entry, fexit retrieves on return
sudo cat /sys/kernel/debug/tracing/trace_pipe
You’ll see one line per filename_unlinkat showing the retrieved task and elapsed time.
When you’re done watching, stop the loader so the fentry/fexit programs detach:
sudo pkill -f task_assoc # or, since it's job 1: kill %1
What to break
Plain store
vp->task = acq;
Verifier rejects with a distinct message — not the leak-class Unreleased reference of the next two items, but:
store to referenced kptr disallowed
The kptr field can only be assigned via bpf_kptr_xchg. As the atomic-exchange section explained, a plain store writes the new pointer but never hands back the old one — so it would leak a refcount by overwriting, and it isn’t indivisible against a racing CPU. The check lives in check_map_kptr_access (kernel/bpf/verifier.c:4721); the rejection of any non-load store class targeting a BPF_KPTR_REF/BPF_KPTR_PERCPU field — store to referenced kptr disallowed, returning -EACCES — is at verifier.c:4747.
Forget to release the previous occupant
bpf_kptr_xchg(&vp->task, acq);
/* discarded the return value */
Verifier rejects with Unreleased reference id=N alloc_insn=M. The xchg returned a (possibly non-NULL) old value with its own ref id; discarding that id is a leak.
The pattern is always:
struct task_struct *old = bpf_kptr_xchg(&vp->task, acq);
if (old) bpf_task_release(old);
Forget to release the retrieved kptr
struct task_struct *t = bpf_kptr_xchg(&vp->task, NULL);
if (!t) return 0;
return 0; /* leak: t still holds a refcount */
Rejected at exit: Unreleased reference id=N alloc_insn=M.
Map deletion releases automatically
When userspace deletes a map entry whose kptr slot is still populated, the kernel runs the registered destructor (bpf_task_release_dtor → put_task_struct_rcu_user for tasks) on the slot’s pointer at bpf_obj_free_fields time — the exact BPF_KPTR_REF case of the walker we read earlier. No leak, no manual cleanup, even if your program terminates abnormally and userspace drains the map afterward: the free walker runs whether or not any BPF program is on the stack.
The trouble with demonstrating this in the lab as written: the fexit handler already bpf_kptr_xchg’s the slot back to NULL on return (the struct task_struct *t = bpf_kptr_xchg(&vp->task, NULL) block through bpf_task_release(t) in on_unlink2), so by the time any userspace delete runs, the slot is empty and deletion frees nothing. To actually see the destructor fire, temporarily comment out that fexit retrieval in on_unlink2 so entries stay populated, then delete them from userspace:
/* userspace — fd and key are real, not placeholders */
int fd = bpf_map__fd(skel->maps.stash);
/* tid is a per-rm-process key you don't know a priori, so iterate: */
__u32 key = 0, next;
struct val v;
while (bpf_map_get_next_key(fd, &key, &next) == 0) {
bpf_map_lookup_and_delete_elem(fd, &next, &v); /* delete fires the kptr dtor */
key = next;
}
Observe the destructor firing — in a second terminal, before you delete:
sudo bpftrace -e 'kprobe:bpf_task_release_dtor { @releases = count(); printf("dtor fired\n"); }'
Probe bpf_task_release_dtor, not bpf_task_release — they are the two distinct symbols we dissected above (the void * destructor the kernel calls generically vs. the typed kfunc your program calls). The map-delete path runs bpf_obj_free_fields → field->kptr.dtor, which is bpf_task_release_dtor; it does not go through the typed bpf_task_release. So this probe fires only on the kernel’s auto-release path.
Expected result: @releases increments once per deleted populated slot — that is the kernel invoking the registered kptr destructor on your behalf. Without the kptr machinery you would leak one task refcount per stashed entry.
Nice consequence: because bpf_task_release_dtor is a separate symbol from the typed bpf_task_release(t) your fexit path calls, this probe naturally isolates the map-delete releases — it does not count the in-program release at all, so there’s no need to disable the fexit path or compare counts. (If you instead probe kprobe:bpf_task_release, you’d catch the in-program release and miss the dtor entirely — the opposite of what you want here.) To confirm the slots were populated before deleting, dump the live map first with sudo bpftool map dump pinned /sys/fs/bpf/stash (if you pin the map).
What to read in the kernel
-
kernel/bpf/helpers.c:1731—bpf_kptr_xchg. The implementation. Tiny — it’s justxchg()plus return. The complexity is in the type checking, not the runtime. -
include/linux/bpf.h:194—enum btf_field_type. The catalog of “special” field tags (BPF_KPTR_REFat:198, plus spinlocks, timers, lists). A kptr is one entry in this general framework. -
kernel/bpf/btf.c:4072—btf_parse_fields. Walks struct fields, identifies kptrs (and other special types), builds thebtf_record— looking up each kptr’s destructor at parse time and storing it. Read this to understand what makes a struct field “special.” -
kernel/bpf/btf.c:9083—register_btf_id_dtor_kfuncs. Thetype → destructorregistration entry point. Grep for its callers (helpers.c:4896,cpumask.c:529,crypto.c:394,bpf_qdisc.c:471) to see the stashable set assembled across subsystems. -
kernel/bpf/syscall.c:810—bpf_obj_free_fields. The destructor walker. When a map entry is deleted, this iterates the value’sbtf_recordand dispatches per field type —xchg-to-NULL then dtor forBPF_KPTR_REF. This is what frees your kptrs at map-delete time; the hashtab call sites are athashtab.c:475, 852, 1022, 1032, 1040. -
kernel/bpf/verifier.c—check_map_kptr_access(:4721) for the store-rejection logic; searchmark_btf_ld_regfor how the verifier types kptr fields at use sites, and tracecheck_kfunc_callfor the acquire/release reference-tracking logic. -
tools/testing/selftests/bpf/progs/cpumask_*.c— extensive kptr tests, including kptr-in-map patterns.
Bullet Points
- kptrs let BPF programs store refcounted kernel pointers in maps across invocations.
- Annotation:
__kptrin the value struct. - The kernel knows a field is a kptr because
btf_parse_fieldsbuilds abtf_recordat map-creation time — a table of{offset, type, dtor}for each special field. A kptr is one entry inenum btf_field_type, alongside spinlocks/timers/lists. - On every element free,
bpf_obj_free_fieldswalks that record and fires each kptr’s destructor — the same loop that cancels timers and drains lists. That is the “automatic release”; it runs with no BPF program on the stack. - A type is stashable only if some subsystem registered a
type → destructorpair viaregister_btf_id_dtor_kfuncs— a separate registration from Day 20’s acquire/release kfuncs. (sock/nf_connhave release kfuncs but no registered dtor, so they’re not stashable.) - The destructor (
bpf_task_release_dtor) and the in-program release (bpf_task_release) drop the samercu_usersref — the count that keeps atask_structreadable even after the thread exits. - All access via
bpf_kptr_xchg(atomic exchange). Plain stores rejected — onlyxchgboth transfers ownership and surfaces the previous owner for you to release; a plain store would leak or race into a double-free. - xchg returns the old value — you must release if non-NULL.
- Map deletion automatically releases stored kptrs (registered destructor invoked) — you can’t leak by deleting.
- Multiple kptrs per value are independent — each is its own
btf_recordrow, released individually on free. - Supported types (registered kptr destructors): task_struct, cgroup, bpf_cpumask, sk_buff, bpf_crypto_ctx; more added each release.
Check question
You xchg a new task into a map slot but don’t capture the return value. The slot was previously empty. Why does the verifier still reject this?
Click to reveal answer
Answer: Because the verifier doesn’t know statically that the slot was empty. Even if your program logic guarantees the slot was just initialized to NULL, the verifier has to assume the slot might hold a previously-stored kptr (e.g., from another concurrent invocation that ran in a different CPU context — the lookup-then-xchg pattern is only “atomic” at the xchg, not over the whole sequence).
So bpf_kptr_xchg(&v->t, acq) may return a non-NULL refcounted pointer, and the verifier requires every possible non-NULL return to be released. The check is conservative (over-rejects in cases where you happen to know the slot was empty) but it’s the only way to be sound — the alternative is “trust the programmer’s analysis” which has historically gone badly for kernel safety.
The runtime cost is a no-op when the slot is empty: bpf_task_release(NULL) is a NULL-check-then-skip, ~1 ns. The verifier requirement adds zero runtime cost; it just demands you write the conditional.
Tomorrow
Day 22: struct_ops. Replace a kernel function-pointer table with BPF programs.
Day 22 — struct_ops: BPF replaces kernel vtables
Today’s mission: load a BPF-implemented TCP congestion control algorithm and use it on a real connection. But first, understand the machine underneath: what a kernel vtable is and how the kernel calls through one, what TCP congestion control actually does as an algorithm, and where a connection’s per-socket scratch state lives. Then watch struct_ops turn BPF from “tracing hooks” into “kernel extension language.” Total time: ~120 minutes.
For 21 days, every BPF program you wrote was an observer. A kprobe fires, you read some state, you return. An XDP program inspects a packet, you decide pass or drop. Even when you modified things — rewrote a packet, set a sockopt — you were standing at a fixed call site the kernel had pre-drilled for you, doing your thing, and handing control back. The kernel did its job; your program watched and nudged.
Today that flips. Today your BPF program becomes the kernel’s job. It doesn’t watch the congestion-control algorithm run — it is the congestion-control algorithm. To see how that’s even possible, we need to understand the mechanism the kernel already uses to swap algorithms in and out of itself: the vtable.
We’ll teach three pieces of background before the lab, because without them the canonical example (bpf_dctcp.c, which the kernel ships and which this chapter tells you to read end to end) is just opaque slot names:
- What a vtable is — a struct full of function pointers — and how the kernel calls through one to get runtime polymorphism in plain C.
- What TCP congestion control means —
cwnd,ssthresh, slow-start, and the per-ACK callback rhythm — so the slot namesssthresh/cong_avoid/undo_cwndstop being noise. - Where a CC algorithm keeps its per-connection state — the inline
icsk_ca_privscratch buffer that everybpf_dctcpcallback reaches viainet_csk_ca(sk).
We’ll teach each as we hit the part of struct_ops that depends on it.
What a vtable is: function-pointer tables and runtime polymorphism in C
Start with a problem the kernel faces constantly. There is one TCP stack, but there are many congestion-control algorithms — CUBIC, BBR, Reno, DCTCP — and a given connection uses exactly one of them, chosen at runtime. The stack’s fast path can’t if (using_cubic) … else if (using_bbr) … at every ACK; that’s unmaintainable and slow. C has no classes, no virtual methods. So how does one call site invoke many different implementations?
The answer is a struct of function pointers — a vtable. You declare a struct whose members are pointers-to-functions, one per operation. Each algorithm fills in a separate instance of that struct, pointing each member at its own implementation. To swap behavior, you don’t change the call site — you repoint the object at a different filled-in struct. One call site, many implementations, selected by which table you’re pointing at. That is C’s way of doing what C++ would call runtime polymorphism.
The kernel’s congestion-control vtable is struct tcp_congestion_ops. Here it is with fields reordered and trimmed for first reading:
/* include/net/tcp.h:1316 — fields reordered/trimmed for readability;
* the real layout puts fast-path callbacks first and init/release LAST */
struct tcp_congestion_ops {
u32 (*ssthresh)(struct sock *sk);
void (*cong_avoid)(struct sock *sk, u32 ack, u32 acked);
void (*set_state)(struct sock *sk, u8 new_state);
void (*cwnd_event)(struct sock *sk, enum tcp_ca_event ev);
void (*in_ack_event)(struct sock *sk, u32 flags);
void (*pkts_acked)(struct sock *sk, const struct ack_sample *sample);
u32 (*undo_cwnd)(struct sock *sk);
/* ... ~10 callbacks ... */
char name[TCP_CA_NAME_MAX];
/* ... */
void (*init)(struct sock *sk); /* private-data setup, called last */
void (*release)(struct sock *sk); /* private-data teardown */
};
That ordering is honest about being rearranged: in the real include/net/tcp.h:1316, the struct opens with a comment saying “fast path fields are put first to fill one cache line,” the fast-path callbacks (cong_avoid, cong_control, ssthresh) come first, the control/slow-path fields and init/release come last, and the whole struct ends ____cacheline_aligned_in_smp — the same cache-line discipline you met for sk_buff on Day 1, now applied to a vtable.
How the kernel actually calls through it
A vtable is useless until something dispatches through it. Each TCP socket carries one pointer to the tcp_congestion_ops it’s currently using:
/* include/net/inet_connection_sock.h:97 */
const struct tcp_congestion_ops *icsk_ca_ops; /* "Pluggable congestion control hook" */
Selecting an algorithm for a connection is nothing more than pointing icsk_ca_ops at that algorithm’s table. And the TCP fast path calls operations indirectly, through that pointer, never naming a concrete algorithm:
/* net/ipv4/tcp_input.c:2570 — on a loss/ECN event, ask the CC for the new threshold */
WRITE_ONCE(tp->snd_ssthresh, icsk->icsk_ca_ops->ssthresh(sk));
/* net/ipv4/tcp_input.c:3517 — per ACK, let the CC advance the window */
icsk->icsk_ca_ops->cong_avoid(sk, ack, acked);
/* net/ipv4/tcp_input.c:3864 — or, if the CC took full control, hand it everything */
icsk->icsk_ca_ops->cong_control(sk, ack, flag, rs);
Read icsk->icsk_ca_ops->ssthresh(sk) slowly. It means: follow the socket’s CC pointer to a table, load the ssthresh slot out of that table, and call whatever function lives there. If icsk_ca_ops points at CUBIC’s table, this calls CUBIC’s C function. If it points at BBR’s, it calls BBR’s. The call site never changes; the target does. That indirection — the dereference-then-call through a per-object table pointer — is the entire trick, and it is exactly the seam struct_ops plugs BPF into.
Registration is how a table joins the pool of selectable algorithms: tcp_register_congestion_control() adds the table to a global list (tcp_cong_list) so it can later be looked up by name and assigned to a socket’s icsk_ca_ops.
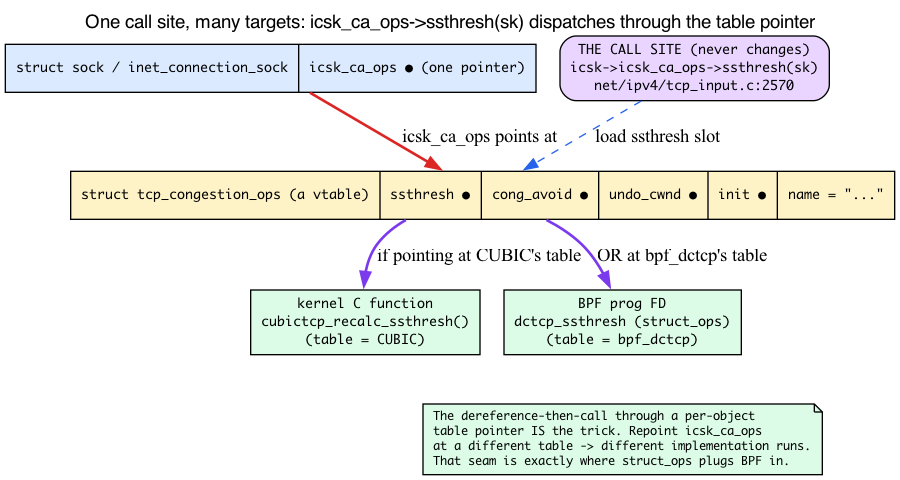
Why this is “kernel extension,” not “tracing”
Hold the two models side by side, because this is the whole thesis of the day:
- A tracing hook (kprobe, tracepoint, fentry — everything up to Day 21) observes at a fixed, pre-drilled call site. The kernel reaches the site, runs its own logic, and on the way past lets your program peek. Your program is a spectator with write access.
- A struct_ops program becomes the call target. There is no separate “kernel logic” running alongside it — when
icsk_ca_ops->ssthresh(sk)fires, your BPF program is the function that runs. You’re not watching the algorithm. You are the algorithm.
That is why this earns the name kernel extension language rather than tracing. And it ties back to BTF, which you’ve leaned on since Day 1’s vmlinux.h and CO-RE (Day 3): the kernel publishes the layout of struct tcp_congestion_ops in its own BTF, so when you supply BPF programs for the slots, the verifier can match each callback’s signature slot by slot against the C struct’s declared types. The vtable’s shape is the contract; BTF is how both sides agree on it.
The classic example is exactly this — TCP congestion control. CUBIC, BBR, Reno, DCTCP are all implementations of tcp_congestion_ops in C, each registered via tcp_register_congestion_control(). Now you can write one in BPF.
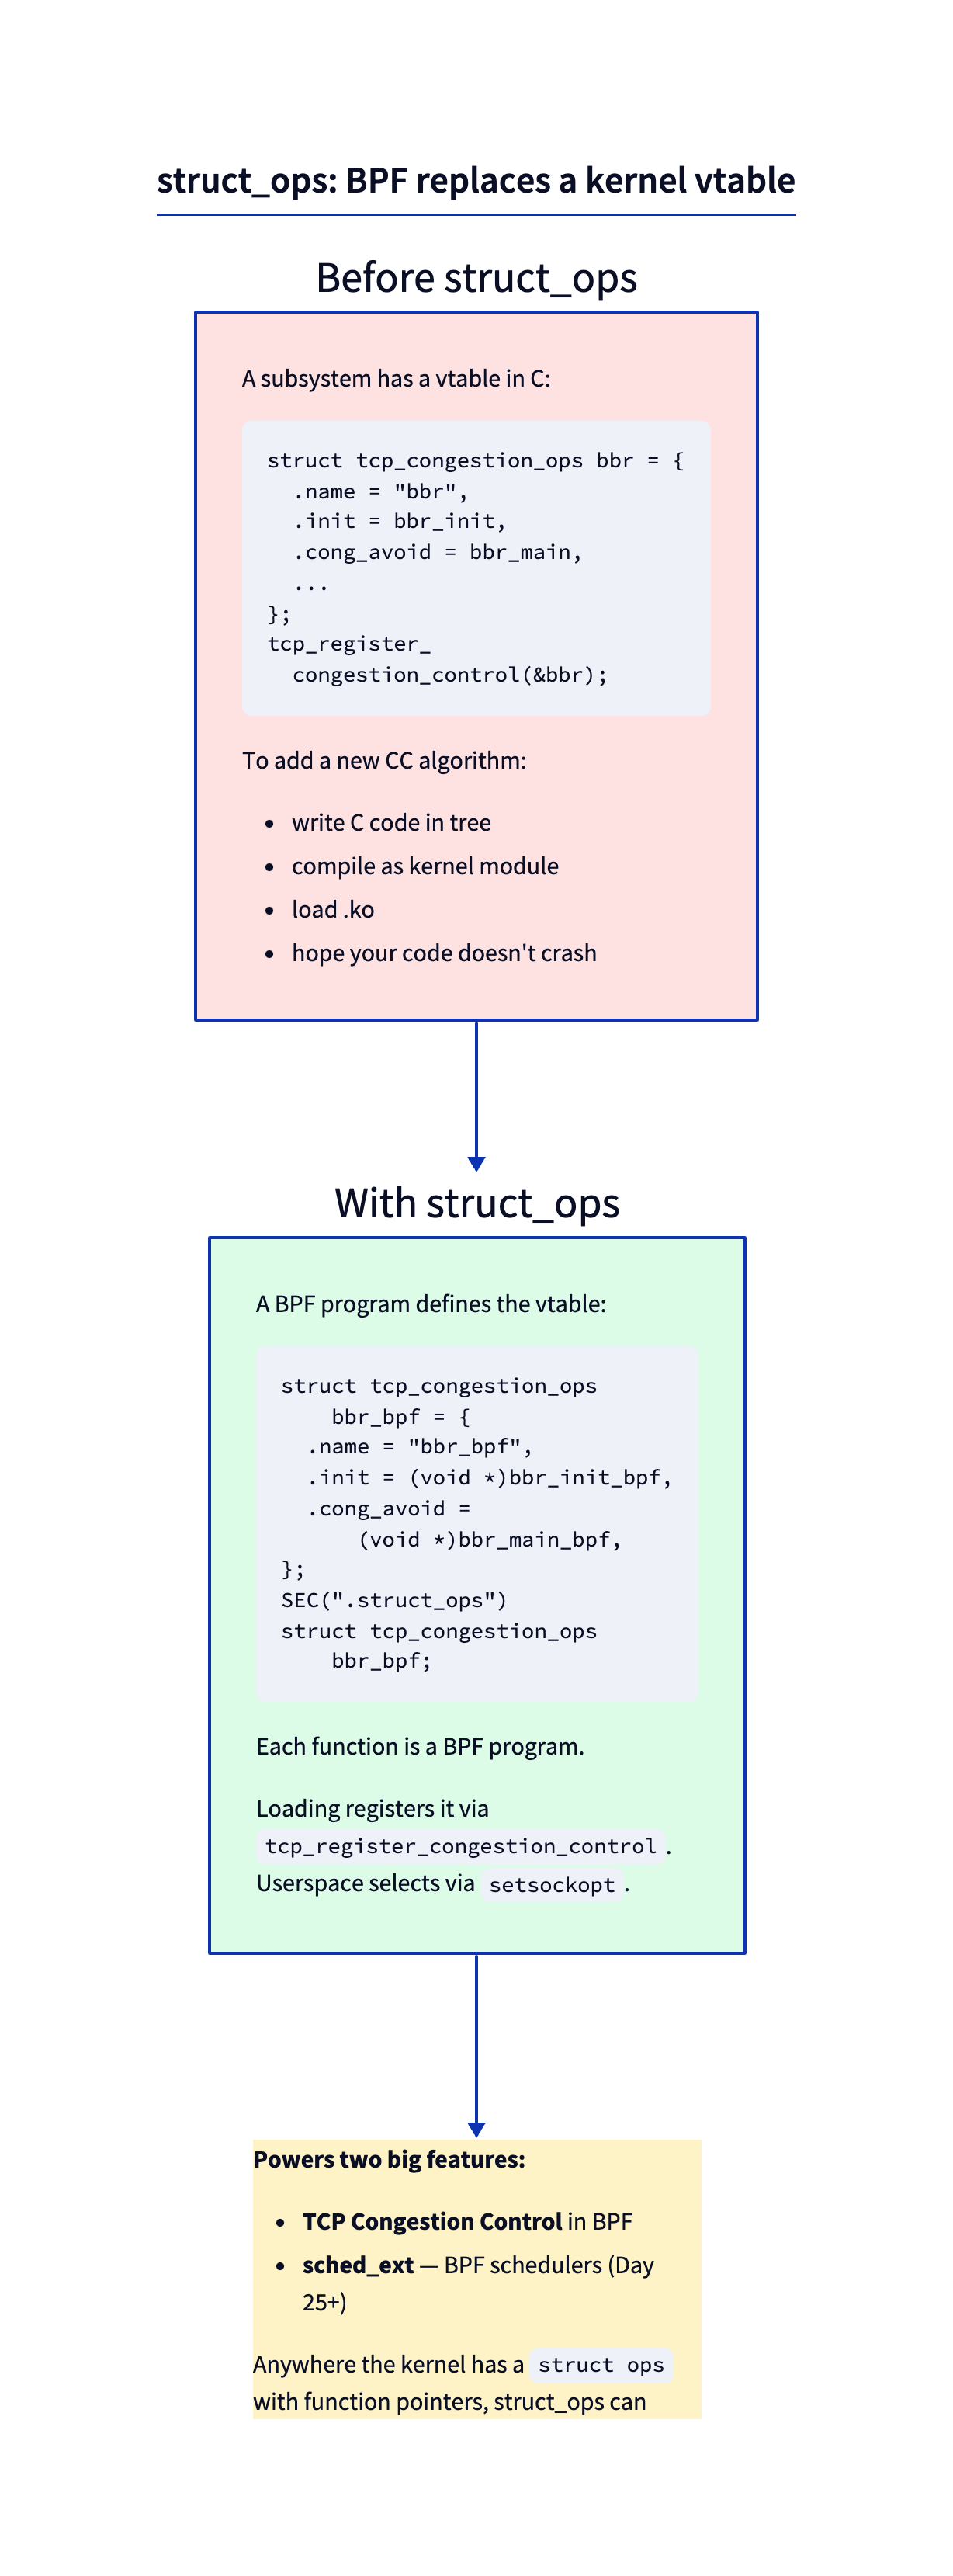
What TCP congestion control actually does
The slot names above (ssthresh, cong_avoid, undo_cwnd) are opaque until you know what the algorithm they implement is for. The ebpf book hasn’t taught congestion control — Day 19 only named one via bpf_setsockopt(..., "bbr"). So here’s exactly enough to read bpf_dctcp.c without a networking textbook.
The problem CC solves. A TCP sender can’t see the network. It doesn’t know how much bandwidth is free or how deep the queues are. If it sends too fast, routers drop packets and everyone’s throughput collapses; too slow and the link sits idle. Congestion control is the sender’s guessing game: probe the network, react to feedback, converge on a sending rate.
cwnd — the congestion window. This is the sender’s self-imposed cap on how many segments (MSS-sized packets) it will let be “in flight” (sent but not yet ACKed) at once. (Linux’s tp->snd_cwnd and tcp_snd_cwnd() count segments, not bytes — RFCs define cwnd in bytes conceptually, but the field and the tooling are in segments.) It’s TCP’s running guess at how much the network can absorb. cwnd is literally what ss -ti prints as cwnd:10 in today’s lab — cwnd:10 means 10 segments, the algorithm’s current guess.
ssthresh — the slow-start threshold. cwnd grows in two different regimes, and ssthresh is the boundary between them:
-
Below
ssthresh: slow-start.cwndgrows roughly exponentially — it ramps up fast to find the network’s ceiling quickly. You can see the ceiling enforced directly:/* net/ipv4/tcp_cong.c:456 — tcp_slow_start() */ u32 cwnd = min(tcp_snd_cwnd(tp) + acked, tp->snd_ssthresh);Every ACK bumps
cwndby the number of newly-ACKed segments (acked), but it’s clamped tosnd_ssthresh. The momentcwndwould cross the threshold, slow-start ends. -
Above
ssthresh: congestion avoidance.cwndgrows roughly linearly — cautious probing, one segment per round-trip-ish, because we’re now near the suspected limit.
The ssthresh callback is invoked when the network signals trouble (a loss, or an ECN congestion mark) to compute the new threshold to drop down to. Reno’s is the textbook “cut in half”:
/* net/ipv4/tcp_cong.c:515 — tcp_reno_ssthresh() */
return max(tcp_snd_cwnd(tp) >> 1U, 2U); /* halve cwnd, floor at 2 */
That’s why ssthresh is required: a CC algorithm must be able to say how far to back off on congestion. No back-off, no congestion control.
cong_avoid — the per-ACK heartbeat. Recall the dispatch site icsk->icsk_ca_ops->cong_avoid(sk, ack, acked) fires on every eligible ACK (whenever the CC doesn’t provide cong_control), and the callback itself picks the regime — slow-start below ssthresh, linear growth above it. Reno’s reference implementation routes through slow-start below the threshold and the linear tcp_cong_avoid_ai() above it (tcp_cong.c:496). This is why the framework requires either cong_avoid or cong_control: you either let the core stack drive (cong_avoid does just the cwnd math, the stack handles pacing/ECN/idle for you), or you take the wheel completely (cong_control gets every delivered-packet event and owns all of it). One or the other — that disjunction is real, and it’s the literal subject of today’s check question.
undo_cwnd — reverse a mistake. Sometimes TCP cuts cwnd for a “loss” that turns out to be spurious (the packet was just reordered, not dropped). undo_cwnd restores cwnd afterward (tcp_cong.c:523). It’s required so the framework can always reverse a reduction it later regrets.
Now the kernel’s required-ops gate reads as plain English — and this exact function is the answer to today’s check question:
/* net/ipv4/tcp_cong.c:78 — tcp_validate_congestion_control() */
if (!ca->ssthresh || !ca->undo_cwnd ||
!(ca->cong_avoid || ca->cong_control)) {
pr_err("%s does not implement required ops\n", ca->name);
return -EINVAL;
}
A minimal real vtable fills exactly those three required slots — here’s Reno, the whole thing:
/* net/ipv4/tcp_cong.c:531 */
struct tcp_congestion_ops tcp_reno = {
.flags = TCP_CONG_NON_RESTRICTED,
.name = "reno",
.owner = THIS_MODULE,
.ssthresh = tcp_reno_ssthresh, /* required */
.cong_avoid = tcp_reno_cong_avoid, /* required: cong_avoid OR cong_control */
.undo_cwnd = tcp_reno_undo_cwnd, /* required */
};
The rhythm and the timing. These callbacks fire on the data-path ACK processing, which runs in softirq context. That’s why — recall Day 12 — congestion-control struct_ops programs are non-sleepable: you cannot block on the ACK fast path. Keep that in mind; it shows up again in “What’s verified.”
DCTCP specifically. Data Center TCP reacts to ECN CE marks (explicit congestion notification set by switches before they drop) rather than waiting for actual loss, and it adjusts a fractional alpha estimate of how congested the path is. That’s why bpf_dctcp.c implements set_state, in_ack_event (to fold in ECN feedback), and a cong_avoid that leans on Reno’s — enough context now to read it without a textbook.
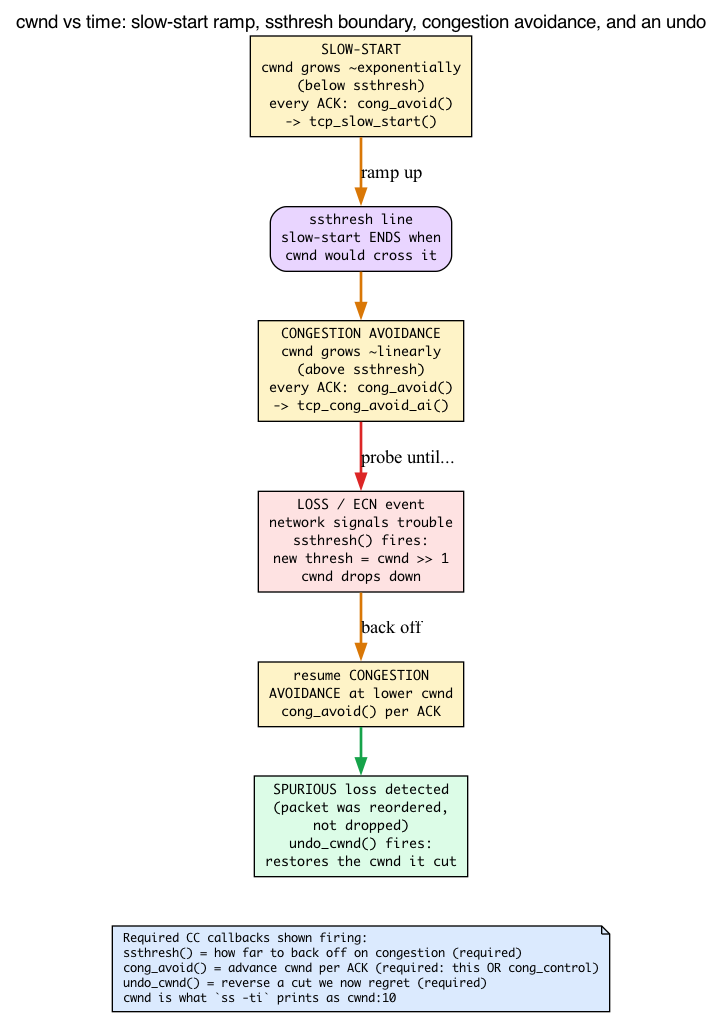
Where a connection keeps its CC state: inet_csk_ca()
One more piece, because every callback in bpf_dctcp.c opens with the same line and you need to know what it touches:
struct bpf_dctcp *ca = inet_csk_ca(sk); /* the first line of nearly every callback */
DCTCP needs to remember things per connection — its alpha estimate, a CE-state flag, byte counters. Where does that live? Not in a separate allocation per socket — that’d be a malloc on every connection. Instead, every TCP socket reserves a fixed inline scratch buffer for whatever CC algorithm it currently uses:
/* include/net/inet_connection_sock.h:141 */
u64 icsk_ca_priv[104 / sizeof(u64)]; /* 104 bytes of inline per-socket CC scratch */
#define ICSK_CA_PRIV_SIZE sizeof_field(struct inet_connection_sock, icsk_ca_priv)
That’s 104 bytes sitting inside every inet_connection_sock, costing nothing extra to allocate. The accessor just hands back a pointer into it, reinterpreted as the algorithm’s private struct:
/* include/net/inet_connection_sock.h:153 */
static inline void *inet_csk_ca(const struct sock *sk)
{
return (void *)inet_csk(sk)->icsk_ca_priv;
}
So inet_csk_ca(sk) is just “give me this socket’s CC scratch, typed as my struct.” This is why the vtable has init and release slots, and why init is described as “called last”: when a socket adopts an algorithm, init runs to lay out that scratch (zero the counters, set initial alpha); release tears it down. The slots exist precisely to manage this inline buffer’s lifecycle.
There’s a hard constraint hiding here: the buffer is size-bounded by ICSK_CA_PRIV_SIZE (104 bytes). A CC algorithm’s private struct must fit. That bounds what a BPF struct_ops CC can stash per connection — worth one sentence of respect.
And it connects straight to the lab. bpf_dctcp.c declares:
/* tools/testing/selftests/bpf/progs/bpf_dctcp.c:40 */
struct bpf_dctcp {
__u32 old_delivered;
__u32 old_delivered_ce;
__u32 prior_rcv_nxt;
__u32 dctcp_alpha;
__u32 next_seq;
__u32 ce_state;
__u32 loss_cwnd;
};
That 28-byte struct is exactly what lands in icsk_ca_priv (well within the 104-byte cap). It’s the state init writes once, that cong_avoid/ssthresh/in_ack_event read and update on each ACK, and that release would tear down.
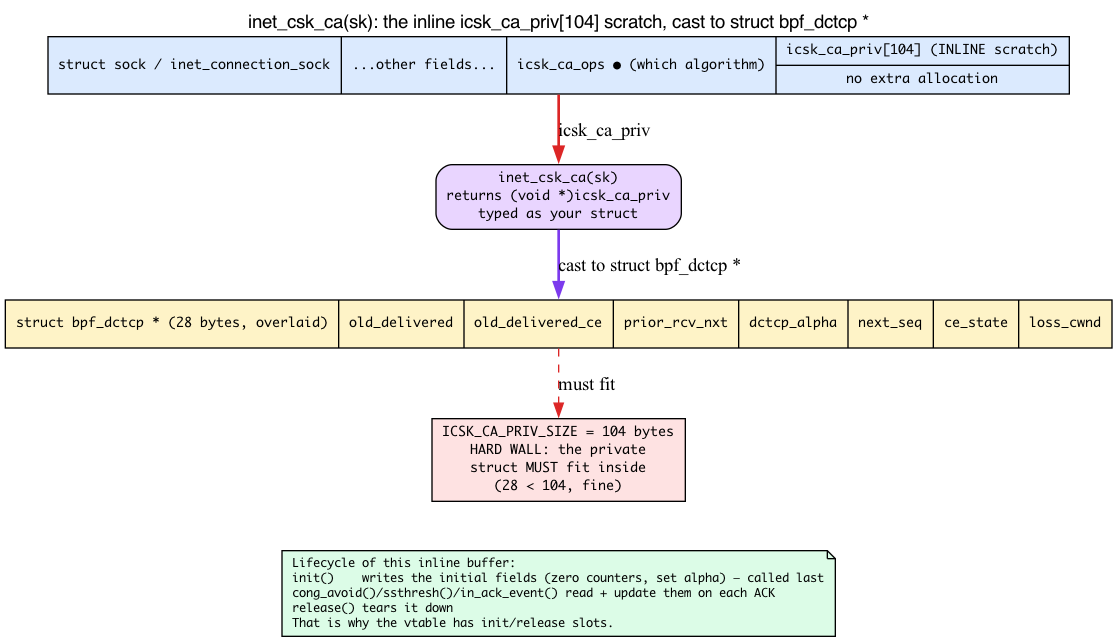
How struct_ops works
Now the mechanism. A struct_ops module has three parts in BPF source:
- Each callback is a separate BPF program with
SEC("struct_ops/<callback_name>"). - The vtable instance is declared in
SEC(".struct_ops")(orSEC(".struct_ops.link")for the modern link-based variant) — a struct of the right type with function pointers pointing at the BPF programs. - The kernel reads the BTF at load time, validates each callback’s signature against the vtable’s expected types (the slot-by-slot match we described), and calls
register_${subsystem}(e.g.,tcp_register_congestion_control) automatically.
Example skeleton:
SEC("struct_ops/dctcp_init")
void BPF_PROG(my_init, struct sock *sk) { /* ... */ }
SEC("struct_ops/dctcp_ssthresh")
u32 BPF_PROG(my_ssthresh, struct sock *sk) { return /* ... */; }
/* Reuse Reno's cwnd math without rewriting it: declare the kernel's
* exported function as a kfunc, then CALL it from a one-line BPF program. */
extern void tcp_reno_cong_avoid(struct sock *sk, __u32 ack, __u32 acked) __ksym;
SEC("struct_ops")
void BPF_PROG(my_cong_avoid, struct sock *sk, __u32 ack, __u32 acked)
{
tcp_reno_cong_avoid(sk, ack, acked); /* tail into Reno's linear growth */
}
/* ... other callbacks ... */
SEC(".struct_ops.link")
struct tcp_congestion_ops my_dctcp = {
.init = (void *)my_init,
.ssthresh = (void *)my_ssthresh,
.cong_avoid = (void *)my_cong_avoid, /* a BPF program that calls Reno */
.name = "my_dctcp",
};
Notice the .cong_avoid = (void *)my_cong_avoid line. A struct_ops slot always holds a BPF program — never a raw kernel function. So how do you “reuse” Reno’s existing C math? You don’t drop tcp_reno_cong_avoid into the slot; you declare it as a kfunc (extern ... __ksym;) and call it from inside a one-line BPF program (my_cong_avoid), then assign that BPF wrapper to the slot. The slot is BPF; the BPF body tail-calls into Reno’s linear-growth math. (This is exactly what the kernel’s own bpf_dctcp.c does at bpf_dctcp.c:231-236,253: extern ... tcp_reno_cong_avoid(...) __ksym;, a bpf_dctcp_cong_avoid program whose body is just tcp_reno_cong_avoid(sk, ack, acked);, and .cong_avoid = (void *)bpf_dctcp_cong_avoid.) Required and optional slots are subsystem-specific. TCP congestion control demands the required-ops gate from earlier (tcp_validate_congestion_control); other callbacks may be left NULL only if the TCP CC framework defines that as optional.
A note on the
SECsuffix. We writeSEC("struct_ops/dctcp_init")with a named suffix, but the suffix is optional — the kernel’s ownbpf_dctcp.cselftest uses a bareSEC("struct_ops")on every callback and lets the assignment in the.struct_opsvtable bind each program to its slot. Both work; libbpf resolves the binding from the vtable struct, not the section name. Don’t be confused if the source you’re comparing against omits the suffix.
The lifecycle
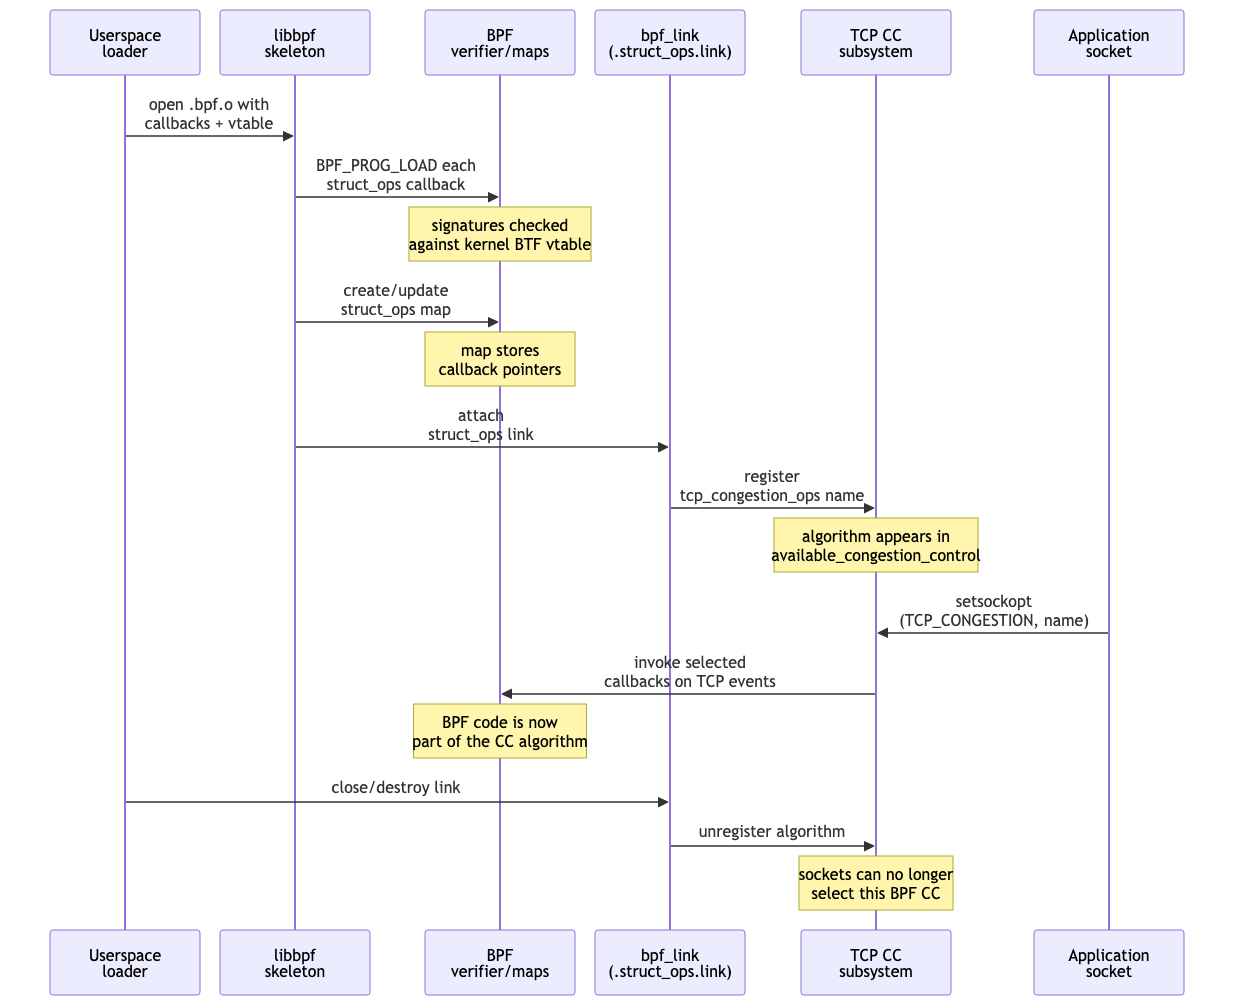
When you load a struct_ops object via libbpf:
- Each callback is loaded as a separate BPF program (separate prog FD).
- A struct_ops map is created — keyed by function-pointer slot, valued by the BPF program FDs that implement each. (This map is the in-kernel
tcp_congestion_opstable that a socket’sicsk_ca_opswill eventually point at.) - The kernel calls the registration function of the relevant subsystem. For TCP CC:
tcp_register_congestion_control(my_dctcp). The new algorithm name appears in/proc/sys/net/ipv4/tcp_available_congestion_control. - Userspace selects it via
setsockopt(TCP_CONGESTION, "my_dctcp")per socket, orsysctl tcp_congestion_control=my_dctcpsystem-wide — which, under the hood, repoints that socket’sicsk_ca_opsat your table.
When the BPF object is unloaded, the registration is reversed and the algorithm goes away.
What’s verified
The verifier does extensive checking on struct_ops modules:
- Each callback’s signature must match the kernel’s vtable definition. Mismatches are rejected at load time — this is the slot-by-slot BTF comparison from earlier.
- Each callback’s BPF program follows normal verifier rules (no unbounded loops, all pointers checked, etc.).
- Helper allowance is per-callback-context. A
struct_ops/dctcp_initcallback runs in TCP slow-path; certain helpers are allowed; XDP-only helpers aren’t. - Sleepable / non-sleepable is per-callback. TCP CC callbacks aren’t sleepable (they run in softirq on the ACK path, exactly as the CC section explained); some struct_ops vtables (sched_ext) have sleepable subsets.
The type matching uses BTF: the kernel knows struct tcp_congestion_ops from its own BTF, the BPF object’s BTF describes its callbacks’ signatures, and the framework (in bpf_struct_ops.c) walks the field-by-field comparison. The subsystem also gets a final say: bpf_struct_ops.c:861 calls st_ops->validate(kdata) before st_ops->reg(kdata, ...) at :883 — for TCP CC, validate is the very tcp_validate_congestion_control required-ops gate you read.
Why this is huge
It’s how sched_ext works. Sched_ext exposes struct sched_ext_ops — enqueue, dispatch, init, select_cpu, etc. A sched_ext BPF scheduler is just a struct_ops module against that vtable. Same plumbing as TCP CC, different vtable — the CPU scheduler’s dispatch loop calls through sched_ext_ops exactly the way TCP calls through icsk_ca_ops.
It’s how Cilium plans to do certain bits of advanced policy (still evolving). It’s how you’d implement a custom HMAC or compression algorithm. Anywhere the kernel has a function-pointer table, struct_ops can let BPF supply implementations.
The general structure of the kernel was already vtable-heavy (file_operations, net_device_ops, sched_class, …) — every one of those is a tcp_congestion_ops-shaped seam: a struct of function pointers the kernel dispatches through. struct_ops makes most of them potentially BPF-pluggable, given suitable kernel-side enabling and verifier rules. One plumbing, many vtables.
The lab — load BPF DCTCP
The kernel ships tools/testing/selftests/bpf/progs/bpf_dctcp.c — a BPF reimplementation of DCTCP that you can load directly. Everything you just learned is in there: the struct bpf_dctcp that lands in icsk_ca_priv, reached via the inet_csk_ca(sk) line each callback opens with, and the assembled tcp_congestion_ops vtable filling the required slots.
Because that program is part of the moving kernel tree, this repo does not copy it. Instead the lab ships thin wrappers under ebpf/labs/day22/ that compile the canonical in-tree object from the verified v7.1 source and drive its registration. They read the target’s locked identifiers from ebpf/labs/day22/config.env and resolve the kernel source through the shared scripts/linux-source.sh (which honors $LINUX_SRC if you set it, else the pinned/fetched default) — so nothing needs LINUX_SRC exported by hand.
Build and load
The build wrapper is what the lab dispatcher runs for this day (make -C ebpf/labs day22). It generates a narrow v7.1 TCP type header from the locked kernel tree, then builds the canonical bpf_dctcp.bpf.o into ebpf/labs/.output/day22/ with the pinned bpftool:
#!/usr/bin/env bash
# SPDX-License-Identifier: GPL-2.0
#
# build.sh — build wrapper for the Day 22 kernel-selftest DCTCP target.
#
# The central dispatcher (scripts/build-day.sh) execs this with no arguments for
# the "kernel-selftest" backend. It does not copy the upstream program; it builds
# the in-tree selftest from a verified v7.1 kernel source tree, resolved through
# scripts/linux-source.sh (which honors $LINUX_SRC if set, else the pinned/fetched
# default) — nothing needs LINUX_SRC exported by hand.
set -euo pipefail
HERE=$(cd -- "$(dirname -- "${BASH_SOURCE[0]}")" && pwd)
LABS=$(cd -- "$HERE/.." && pwd)
# shellcheck source=/dev/null
. "$HERE/config.env"
JOBS=${JOBS:-$(nproc 2>/dev/null || echo 1)}
fail() { printf 'day22-build: %s\n' "$*" >&2; exit 1; }
LINUX_SRC_DIR=$("$LABS/scripts/linux-source.sh" path) ||
fail "could not resolve a verified ${DAY22_KERNEL_TAG} kernel source (see scripts/linux-source.sh)"
SELFTEST_DIR="$LINUX_SRC_DIR/$DAY22_SELFTEST_DIR"
BUILD_DIR="$LABS/.output/day22"
[[ -f "$LINUX_SRC_DIR/$DAY22_DCTCP_SRC" ]] ||
fail "upstream DCTCP source missing: $LINUX_SRC_DIR/$DAY22_DCTCP_SRC"
VMLINUX_H=$("$LABS/scripts/kernel-btf.sh" tcp)
BPFTOOL=$("$LABS/scripts/linux-bpftool.sh")
mkdir -p "$BUILD_DIR"
printf 'day22-build: make -j%s OUTPUT=%s %s in %s\n' \
"$JOBS" "$BUILD_DIR" "$DAY22_DCTCP_OBJ" "$SELFTEST_DIR" >&2
# Request the generated DCTCP object directly. Building the monolithic
# test_progs runner also compiles hundreds of unrelated BPF programs and test
# modules; registration below only needs this canonical upstream object.
make -C "$SELFTEST_DIR" OUTPUT="$BUILD_DIR" \
BPFTOOL="$BPFTOOL" VMLINUX_BTF="$VMLINUX_H" VMLINUX_H="$VMLINUX_H" \
-j"$JOBS" "$BUILD_DIR/$DAY22_DCTCP_OBJ"
[[ -s "$BUILD_DIR/$DAY22_DCTCP_OBJ" ]] ||
fail "DCTCP BPF object was not produced: $BUILD_DIR/$DAY22_DCTCP_OBJ"
"$BPFTOOL" btf dump file "$BUILD_DIR/$DAY22_DCTCP_OBJ" >/dev/null ||
fail "DCTCP object has no readable BTF"
printf 'day22-build: verified %s\n' "$BUILD_DIR/$DAY22_DCTCP_OBJ" >&2
The operator wrapper drives that object. Its default selftest subcommand creates a PID-scoped pin directory, registers the valid DCTCP vtable, verifies bpf_dctcp appears, unregisters it, and removes the directory on every exit. The separate register/inspect/unregister commands manage an explicitly persistent registration in /sys/fs/bpf/dctcp:
#!/usr/bin/env bash
# SPDX-License-Identifier: GPL-2.0
#
# run.sh — Day 22 operator for the kernel's in-tree BPF DCTCP struct_ops
# selftest. It does not copy the upstream program; it drives the artifacts that
# day22/build.sh produced from a verified v7.1 kernel source tree (resolved via
# scripts/linux-source.sh — no need to export LINUX_SRC).
#
# Subcommands (each owns only what it creates):
# selftest (default) temporarily register the canonical DCTCP object,
# verify it appears, then unregister it and remove owned state
# available print tcp_available_congestion_control
# register register bpf_dctcp.bpf.o into the owned bpffs pin dir (persists)
# inspect bpftool struct_ops list / dump name dctcp
# unregister unregister the algorithm and remove the (empty) pin dir
#
# Privileged subcommands (selftest/register/inspect/unregister) are opt-in and
# require root, mirroring scripts/smoke.sh.
set -euo pipefail
HERE=$(cd -- "$(dirname -- "${BASH_SOURCE[0]}")" && pwd)
LABS=$(cd -- "$HERE/.." && pwd)
# shellcheck source=/dev/null
. "$HERE/config.env"
SELFTEST_DIR=
BUILD_DIR="$LABS/.output/day22"
SELFTEST_ACTIVE=0
SELFTEST_PIN=
log() { printf 'day22: %s\n' "$*" >&2; }
fail() { printf 'day22: %s\n' "$*" >&2; exit 1; }
require_priv() {
if [[ ${EBPF_LABS_ALLOW_PRIVILEGED:-0} != 1 ]]; then
fail 'set EBPF_LABS_ALLOW_PRIVILEGED=1 to acknowledge privileged BPF operations'
fi
(( EUID == 0 )) || fail 'run with sudo after setting EBPF_LABS_ALLOW_PRIVILEGED=1'
}
require_struct_ops() {
require_priv
[[ ${EBPF_LABS_ALLOW_STRUCT_OPS:-0} == 1 ]] ||
fail 'set EBPF_LABS_ALLOW_STRUCT_OPS=1 to acknowledge TCP struct_ops registration'
}
resolve_tree() {
[[ -n $SELFTEST_DIR ]] && return
local src
src=$("$LABS/scripts/linux-source.sh" path) ||
fail "could not resolve a verified ${DAY22_KERNEL_TAG} kernel source"
SELFTEST_DIR="$src/$DAY22_SELFTEST_DIR"
[[ -d $SELFTEST_DIR ]] || fail "selftest tree not found: $SELFTEST_DIR"
}
cleanup_selftest() {
local status=$?
trap - EXIT INT TERM
if (( SELFTEST_ACTIVE )); then
bpftool struct_ops unregister name "$DAY22_VTABLE_OK" 2>/dev/null || true
fi
[[ -z $SELFTEST_PIN ]] || rmdir "$SELFTEST_PIN" 2>/dev/null || true
exit "$status"
}
cmd_selftest() {
require_struct_ops
resolve_tree
[[ -s "$BUILD_DIR/$DAY22_DCTCP_OBJ" ]] ||
fail "run 'day22/build.sh' first: missing $BUILD_DIR/$DAY22_DCTCP_OBJ"
command -v bpftool >/dev/null 2>&1 || fail 'bpftool is required at runtime'
grep -qw "$DAY22_CC_NAME" /proc/sys/net/ipv4/tcp_available_congestion_control &&
fail "$DAY22_CC_NAME is already registered; refusing to unregister state this run does not own"
SELFTEST_PIN="${DAY22_PIN_DIR}-selftest-$$"
[[ ! -e $SELFTEST_PIN ]] || fail "owned pin directory already exists: $SELFTEST_PIN"
mkdir "$SELFTEST_PIN"
SELFTEST_ACTIVE=1
trap cleanup_selftest EXIT INT TERM
log "temporarily registering $DAY22_DCTCP_OBJ"
# The intentionally incomplete dctcp_nouse vtable can make bpftool return
# non-zero after the valid dctcp vtable has registered, so assert state.
bpftool struct_ops register "$BUILD_DIR/$DAY22_DCTCP_OBJ" "$SELFTEST_PIN" || true
grep -qw "$DAY22_CC_NAME" /proc/sys/net/ipv4/tcp_available_congestion_control ||
fail "$DAY22_CC_NAME did not appear in tcp_available_congestion_control"
bpftool struct_ops unregister name "$DAY22_VTABLE_OK"
SELFTEST_ACTIVE=0
rmdir "$SELFTEST_PIN"
SELFTEST_PIN=
! grep -qw "$DAY22_CC_NAME" /proc/sys/net/ipv4/tcp_available_congestion_control ||
fail "$DAY22_CC_NAME remained registered after cleanup"
trap - EXIT INT TERM
log "temporary registration verified and removed"
}
cmd_available() {
cat /proc/sys/net/ipv4/tcp_available_congestion_control
}
cmd_register() {
require_struct_ops
resolve_tree
[[ -f "$BUILD_DIR/$DAY22_DCTCP_OBJ" ]] ||
fail "run 'day22/build.sh' first: missing $BUILD_DIR/$DAY22_DCTCP_OBJ"
[[ ! -e $DAY22_PIN_DIR ]] ||
fail "refusing to adopt existing pin directory: $DAY22_PIN_DIR"
mkdir "$DAY22_PIN_DIR"
log "registering $DAY22_DCTCP_OBJ (the $DAY22_VTABLE_REJECT decoy is expected to be rejected)"
# bpftool prints a non-fatal error for the incomplete dctcp_nouse vtable and
# still registers the valid one, so tolerate its non-zero exit.
bpftool struct_ops register "$BUILD_DIR/$DAY22_DCTCP_OBJ" "$DAY22_PIN_DIR" || true
grep -qw "$DAY22_CC_NAME" /proc/sys/net/ipv4/tcp_available_congestion_control ||
fail "$DAY22_CC_NAME did not appear in tcp_available_congestion_control"
log "$DAY22_CC_NAME is now registered (run '$0 unregister' when done)"
}
cmd_inspect() {
require_priv
bpftool struct_ops list
bpftool struct_ops dump name "$DAY22_VTABLE_OK"
}
cmd_unregister() {
require_priv
log "unregistering $DAY22_VTABLE_OK and removing $DAY22_PIN_DIR"
bpftool struct_ops unregister name "$DAY22_VTABLE_OK" 2>/dev/null || true
if [[ -d $DAY22_PIN_DIR ]]; then
rmdir "$DAY22_PIN_DIR" ||
fail "pin directory is not empty; refusing recursive removal: $DAY22_PIN_DIR"
fi
}
case ${1:-selftest} in
selftest) cmd_selftest ;;
available) cmd_available ;;
register) cmd_register ;;
inspect) cmd_inspect ;;
unregister) cmd_unregister ;;
*)
printf 'usage: %s {selftest|available|register|inspect|unregister}\n' "$0" >&2
exit 2
;;
esac
So the build-and-load flow is:
make -C ebpf/labs day22 # dispatcher → day22/build.sh
EBPF_LABS_ALLOW_PRIVILEGED=1 EBPF_LABS_ALLOW_STRUCT_OPS=1 \
sudo --preserve-env=EBPF_LABS_ALLOW_PRIVILEGED,EBPF_LABS_ALLOW_STRUCT_OPS \
ebpf/labs/day22/run.sh selftest
You should see temporary registration verified and removed. The check loads the exact upstream BPF struct_ops object, asserts that its bpf_dctcp algorithm joined the available list, then tears it down before returning. Check afterward and you will see no bpf_dctcp:
ebpf/labs/day22/run.sh available
# reno cubic bbr
Note there’s no native dctcp in that list by default: on this kernel DCTCP is built as a loadable module (CONFIG_TCP_CONG_DCTCP=m) and isn’t loaded unless you sudo modprobe tcp_dctcp. Its absence here is expected, not a sign the lab failed. (If you do load the module, the dctcp you’d then see is the kernel’s native C implementation, net/ipv4/tcp_dctcp.c — not our BPF one; don’t mistake native dctcp for proof the BPF lab worked.)
To make the BPF version persist so the next steps have something to use, register the prebuilt object yourself. register installs the struct_ops map in the kernel, which is what keeps the algorithm alive after bpftool exits (this object’s vtable uses the map-based SEC(".struct_ops"), so nothing is actually pinned into the directory — it stays empty). The operator refuses to adopt an existing pin directory and runs bpftool struct_ops register ebpf/labs/.output/day22/bpf_dctcp.bpf.o /sys/fs/bpf/dctcp:
EBPF_LABS_ALLOW_PRIVILEGED=1 EBPF_LABS_ALLOW_STRUCT_OPS=1 \
sudo --preserve-env=EBPF_LABS_ALLOW_PRIVILEGED,EBPF_LABS_ALLOW_STRUCT_OPS \
ebpf/labs/day22/run.sh register
bpf_dctcp.bpf.o carries two vtables (dctcp → name bpf_dctcp, and dctcp_nouse → name bpf_dctcp_nouse). On v7.1 only bpf_dctcp registers — dctcp_nouse is intentionally incomplete (it defines only init/set_state, not the required ssthresh/undo_cwnd/cong_avoid), so tcp_validate_congestion_control rejects it with the does not implement required ops error and bpftool prints a non-fatal error while still registering the valid one (the wrapper tolerates that non-zero exit and then asserts bpf_dctcp actually appeared). This is the required-ops gate from earlier firing in real life:
# Error: can't register struct_ops dctcp_nouse: Invalid argument
# Registered tcp_congestion_ops dctcp id <id>
# ... and `available` now prints:
# reno cubic bbr bpf_dctcp
# (registration is purely additive — the base algorithms stay; bpf_dctcp is appended)
When you’re done with the whole lab, unregister the algorithm. Because bpf_dctcp.c uses the map-based SEC(".struct_ops") (not .struct_ops.link), register does not pin a link into the directory — so removing the directory alone does not unregister it. The operator’s unregister runs bpftool struct_ops unregister name dctcp and then removes the (empty) pin dir:
EBPF_LABS_ALLOW_PRIVILEGED=1 \
sudo --preserve-env=EBPF_LABS_ALLOW_PRIVILEGED ebpf/labs/day22/run.sh unregister
Use it on a connection
In a small C program:
int sock = socket(AF_INET, SOCK_STREAM, 0);
setsockopt(sock, IPPROTO_TCP, TCP_CONGESTION, "bpf_dctcp", 9);
/* now this connection's icsk_ca_ops points at our BPF table */
Or via iperf3 against a local loopback server (install iperf3 if it’s missing). This needs bpf_dctcp registered from the step above. An unprivileged setsockopt(TCP_CONGESTION) only accepts algorithms in tcp_allowed_congestion_control, which by default is a subset of the available list — so add bpf_dctcp to it first (save the original to restore later):
ORIG=$(cat /proc/sys/net/ipv4/tcp_allowed_congestion_control)
sudo sysctl -w net.ipv4.tcp_allowed_congestion_control="$ORIG bpf_dctcp"
In terminal 1:
iperf3 -s
In terminal 2, run a transfer long enough to inspect mid-flight, asking for the BPF CC:
iperf3 -c 127.0.0.1 -C bpf_dctcp -t 30
In terminal 3, while the transfer runs, confirm the socket actually negotiated it. ss -ti prints the congestion-control name at the start of each connection’s TCP-info line, so a substring match is enough — and the cwnd: field you’ll see there is the exact congestion window the CC section taught:
ss -ti dst 127.0.0.1 | grep bpf_dctcp
# bpf_dctcp wscale:7,7 rto:204 rtt:0.05/0.02 ... cwnd:10 ...
A hit proves this connection is running BPF-provided DCTCP — that socket’s icsk_ca_ops is pointing at a table whose slots are your BPF programs, and the kernel’s cong_avoid/ssthresh dispatch sites are calling into them on every ACK. (Don’t use grep -A1 — the CC name is inline on the info line, not the line after.) If iperf3 -c fails with unable to set TCP_CONGESTION: Supplied congestion control algorithm not supported on this host, the algorithm isn’t registered or isn’t in the allowed list — go back and run the bpftool struct_ops register and sysctl ... tcp_allowed_congestion_control steps. When you’re done, restore the allowed list: sudo sysctl -w net.ipv4.tcp_allowed_congestion_control="$ORIG".
Inspect
These need the struct_ops live, so run them only after the persistent register step above (after selftest exits, nothing is loaded and list prints nothing while dump returns []). The registered map takes the name of its SEC(".struct_ops") variable — dctcp — not the algorithm name bpf_dctcp set in .name, so dump name dctcp is what matches (and dctcp_nouse was rejected at register time). The operator’s inspect subcommand runs both bpftool struct_ops list and bpftool struct_ops dump name dctcp:
EBPF_LABS_ALLOW_PRIVILEGED=1 \
sudo --preserve-env=EBPF_LABS_ALLOW_PRIVILEGED ebpf/labs/day22/run.sh inspect
# <id>: dctcp tcp_congestion_ops
# ... followed by the field-by-field vtable dump
dump shows the vtable field-by-field, with each implemented function-pointer slot (ssthresh, cong_avoid, init, undo_cwnd, …) resolved to the BPF prog id that serves it. That’s the payoff, and it’s the literal picture from the start of the day: a kernel function-pointer table whose entries are BPF programs, ready for a socket’s icsk_ca_ops to point at.
There are no Dumb Questions
Q: If a vtable is just a struct of function pointers, what stops me from writing garbage into a slot and crashing the kernel?
A: The verifier and the BTF signature match. You don’t write a raw pointer — you supply a BPF program for each slot, and the kernel checks that program’s signature against the vtable field’s declared type (slot by slot, via BTF) before it’ll bind it. A type mismatch is rejected at load time. Then the subsystem’s own
validatecallback (bpf_struct_ops.c:861) gets a veto — for TCP CC that’stcp_validate_congestion_control, which rejects you for missing required ops. C lets kernel code stuff any function pointer into a vtable; struct_ops deliberately does not extend that trust to BPF.
Q: I want Reno’s
cong_avoidmath without rewriting it — can I just put.cong_avoid = (void *)tcp_reno_cong_avoidin the slot?A: No — a struct_ops slot can only hold a BPF program, never a raw kernel function. Writing the kernel symbol directly into the
.struct_opsvtable emits a relocation against an undefined extern, and the object fails to load (libbpf demands every slot resolve to aBPF_PROG_TYPE_STRUCT_OPSprogram). The trick is one level of indirection: declaretcp_reno_cong_avoidas a kfunc (extern void tcp_reno_cong_avoid(struct sock *sk, __u32 ack, __u32 acked) __ksym;), write a one-line BPF program whose body just calls it (tcp_reno_cong_avoid(sk, ack, acked);), and assign that BPF wrapper to the slot. So the slot holds your BPF trampoline; the dispatch site calls your BPF program, which tail-calls into Reno’s C math. That’s the kernel’s own pattern inbpf_dctcp.c.
Q: Where does my per-connection state actually live, and what bounds its size?
A: In the socket’s inline
icsk_ca_priv[104]buffer, reached viainet_csk_ca(sk). Your private struct (the BPFstruct bpf_dctcp) is overlaid onto those 104 bytes — no separate allocation. The hard cap isICSK_CA_PRIV_SIZE(104 bytes). If your CC needs more per-connection memory than that, you’d have to stash the overflow in a BPF map keyed by socket, not inicsk_ca_priv.
What to read in the kernel
-
kernel/bpf/bpf_struct_ops.c— the framework. ~1500 lines. Read top to bottom (it’s surprisingly readable). Key entry points:bpf_struct_ops_map_alloc_check(line 1021) — validates a struct_ops map type.bpf_struct_ops_map_alloc(line 1043) — creates the map and binds BPF prog FDs to vtable slots.st_ops->validatethenst_ops->reg(lines 861 / 883) — the subsystem’s signature/required-ops check, then the actual registration.bpf_struct_ops_link_create(line 1360) — forSEC(".struct_ops.link"), creates a bpf_link.bpf_struct_ops_test_run— used by selftests to invoke a callback in a controlled environment.
-
include/net/tcp.h:1316—struct tcp_congestion_ops. The vtable shape that BPF DCTCP implements. Read each callback’s docstring; that’s what your BPF program is expected to do. Note the “fast path fields first / control paths last” comments. -
net/ipv4/tcp_cong.c— the CC framework core. Readtcp_validate_congestion_control(line 78 — the required-ops gate),tcp_slow_start(line 456 — thessthreshceiling), and the Reno reference (tcp_reno_cong_avoid/tcp_reno_ssthresh/tcp_reno_undo_cwndat 496/515/523, assembled intotcp_renoat 531). This is the minimal real vtable to compare yours against. -
net/ipv4/tcp_dctcp.c— the C reference implementation of DCTCP. Compare againsttools/testing/selftests/bpf/progs/bpf_dctcp.cfield-by-field. The BPF version is a near-mechanical port; reading both side-by-side teaches the conversion idiom. -
tools/testing/selftests/bpf/progs/bpf_dctcp.c— the canonical BPF struct_ops example. Read end to end. Notice theinet_csk_ca(sk)line atop each callback (yourstruct bpf_dctcpoverlaid onicsk_ca_priv), the bareSEC("struct_ops")per callback, and theSEC(".struct_ops")containing the assembled vtable. -
kernel/sched/ext.c— sched_ext. ~10000 lines. The other big struct_ops user. Same pattern: a vtable (struct sched_ext_ops), per-callback BPF programs, dispatched through a function-pointer table. -
Documentation/bpf/struct_ops.rst— official guide. Brief but pointed. (Not present in the v7.1 tree; check the in-treeDocumentation/bpf/index for the current struct_ops write-up.)
Bullet Points
- A vtable is a struct of function pointers; the kernel keeps one pointer per operation and dispatches indirectly (
icsk_ca_ops->ssthresh(sk)) so one call site can invoke many implementations. Swapping behavior = repointing the table pointer. That indirection is the seam struct_ops fills. - Tracing observes; struct_ops becomes the target. A struct_ops BPF program is the function the kernel calls — that’s why it’s “kernel extension,” not “tracing.”
- TCP congestion control:
cwndis the in-flight cap in segments (thecwnd:10inss -ti= 10 segments);ssthreshis the slow-start→congestion-avoidance boundary;cong_avoidruns per ACK;undo_cwndreverses spurious cuts. CC callbacks run in softirq → non-sleepable. - Required ops (TCP CC):
ssthresh,undo_cwnd, and eithercong_avoidorcong_control— enforced bytcp_validate_congestion_control(tcp_cong.c:78). - Per-connection state lives in the socket’s inline
icsk_ca_priv[104]buffer, reached viainet_csk_ca(sk);init/releaseset it up and tear it down; it’s size-capped atICSK_CA_PRIV_SIZE. - struct_ops lets BPF supply implementations for kernel function-pointer tables. Each callback is a separate BPF program (
SEC("struct_ops/X")); the vtable struct lives inSEC(".struct_ops")or.struct_ops.link. - Loading the map auto-registers the implementation with the kernel subsystem (TCP CC, sched_ext, etc.). The verifier checks each callback’s signature against the kernel’s BTF for the vtable struct — mismatches caught at load time.
- Partial implementations are subsystem-specific: TCP CC requires the three ops above; optional slots may remain NULL. To reuse a kernel C routine like Reno’s
cong_avoid, you can’t put the C function in the slot — declare it as a kfunc and call it from a one-line BPF program assigned to the slot. - Used by: TCP CC, sched_ext, congestion-control modules, struct_ops growing per release. Inspect with
bpftool struct_ops list/dump.
Check question
If you load a BPF struct_ops module that defines only some callbacks (e.g., init and ssthresh but not cong_avoid), what happens to TCP connections using your CC?
Click to reveal answer
Answer: For TCP congestion control, that object is rejected unless the required callbacks are present — the required-ops gate from earlier (tcp_validate_congestion_control, net/ipv4/tcp_cong.c:78; the required-ops if is at :81-82) pr_errs does not implement required ops and returns -EINVAL. (That’s exactly why dctcp_nouse in the lab — which defines only init/set_state — fails to register.) If you want Reno’s cong_avoid behavior, you can’t drop the C function into the slot: declare tcp_reno_cong_avoid as a kfunc and call it from a one-line BPF cong_avoid program, then assign that program to the slot.
Struct_ops does not have a universal “unset slots fall back” rule. Each subsystem decides which callbacks are required, which are optional, and what a NULL optional callback means. sched_ext, TCP CC, and future struct_ops users have different contracts.
Tomorrow
Day 23: actually modify BPF DCTCP. Add ringbuf logging that emits per-ACK telemetry, and watch a real iperf3 run produce per-segment data — reading your struct bpf_dctcp state out of icsk_ca_priv as each ACK fires.
Day 23 — Modify BPF DCTCP and instrument it
Today’s mission: take yesterday’s BPF DCTCP, learn what TCP’s congestion control actually does (so the numbers mean something), add per-ACK telemetry to a ringbuf, run a real
iperf3, and watch TCP’s internal state in real time. Total time: ~110 minutes.
Why this exercise
Yesterday loaded a stranger’s BPF DCTCP. Today changes one and observes the effect. This is the most important struct_ops skill: small, surgical modifications to working code.
Goal: emit one event per ACK to a ringbuf, with the connection’s current cwnd, in_flight, and srtt. Watch a transfer; correlate transfer events to internal TCP state.
This pattern — instrument an existing struct_ops module without changing its policy — is invaluable. You can debug a misbehaving CC algorithm, study how an unfamiliar one works, or feed real-time TCP state into your own monitoring system.
But here’s the catch: the payoff of this whole chapter is that you can read the four numbers you’re about to log — cwnd, in_flight, srtt, ssthresh — and know what they mean. Day 22 introduced cwnd and ssthresh and let you watch cwnd:10 scroll by in ss -ti. Today we add the two numbers it didn’t cover — in_flight (how full the pipe is right now) and srtt (the smoothed RTT) — plus the framing that ties all four together: the ACK clock. We’ll recap cwnd/ssthresh in a sentence each and link back to Day 22 rather than rebuild them. Skip this section and the telemetry is just noise; read it and the ringbuf becomes a window into TCP’s heartbeat.
The thing TCP is fighting: the ACK clock
Picture a sender with a 1 GB file and a network of unknown capacity. If it blasts all 1 GB onto the wire at once, it overruns some router’s queue, that router drops packets, and everyone’s throughput collapses. So TCP does the opposite of blasting: it sends a little, waits to hear that it arrived, and only then sends a little more. The “hearing that it arrived” is the ACK — the receiver acknowledges bytes it got.
This feedback loop is the ACK clock. Each ACK that comes back is permission to send roughly one more segment’s worth of data. The connection self-paces to the speed of the slowest link, because that link is what governs how fast ACKs trickle back. Everything TCP congestion control does is bookkeeping around this one idea: how much am I allowed to have outstanding, and how do I adjust that as ACKs arrive?
That bookkeeping is exactly four numbers.
cwnd — the congestion window (the speed limit)
Recap from Day 22: snd_cwnd is the cap on how many segments may be unacknowledged — in flight — at any instant, measured in packets (MSS-sized segments), not bytes. New connections start at the kernel’s initial window of 10 segments (cwnd:10 is what you saw in ss -ti) and grow it as the path proves it can take more. The only addition for today: cwnd is the speed limit that in_flight rides just underneath.
/* include/linux/tcp.h:225 */
u32 snd_cwnd; /* Sending congestion window */
in_flight — how full the pipe currently is
in_flight is the count of segments sent but not yet ACKed. The fundamental rule of the ACK clock is:
the sender may keep sending only while
in_flight < cwnd.
When a segment is sent, in_flight goes up. When an ACK arrives covering that segment, in_flight drops and a slot in the window frees up — which is precisely why in_ack_event is the natural instrumentation hook. That callback fires on each incoming ACK, i.e. each tick of the ACK clock, each moment the window opens a little. Watching the ringbuf is literally watching the clock tick.
The kernel doesn’t store in_flight as a field; it computes it (we’ll see the exact formula below) from packets_out:
/* include/linux/tcp.h:308 */
u32 packets_out; /* Packets which are "in flight" */
ssthresh — the gear shift between two growth modes
Recap from Day 22: snd_ssthresh (the slow-start threshold) is the boundary between TCP’s two growth phases — slow start below it (cwnd grows ~exponentially, doubling per RTT) and congestion avoidance at/above it (cwnd grows ~linearly, +1 per RTT). Day 22 derived both; the kernel’s test is one comparison:
/* include/linux/tcp.h:248 */
u32 snd_ssthresh; /* Slow start size threshold */
/* include/net/tcp.h:1520 */
static inline bool tcp_in_slow_start(const struct tcp_sock *tp)
{
return tcp_snd_cwnd(tp) < tp->snd_ssthresh;
}
What’s new for today is the gear-shift / cutback framing: DCTCP’s bpf_dctcp_ssthresh callback is what computes the new ssthresh when a congestion signal arrives — it decides where the gear shift lands after a cutback, which feeds the sawtooth below.
Loss: the sawtooth collapse
What happens on congestion (a loss, or for DCTCP an ECN signal)? TCP cuts cwnd and sets ssthresh to the reduced value. Classic Reno halves it; that’s the famous sawtooth: a slow linear climb, a sudden halving, climb again, halve again. This collapse is the entire basis of the anomaly-detection use case at the end of today — a sudden drop in in_flight/cwnd correlated with an RTT spike is a loss event. (And it’s why the loopback caveat later matters: over 127.0.0.1 there is no loss, so you only ever see the monotonic climb, never the teeth.)
srtt — the smoothed round-trip time
The last number is timing. srtt_us is the smoothed RTT: an exponentially weighted moving average (EWMA) of measured round-trip samples. TCP uses it to set retransmit timeouts — “if I haven’t heard back in roughly srtt plus some slack, assume the segment is lost.” A single fluky sample shouldn’t swing the timeout wildly, so TCP smooths.
/* include/linux/tcp.h:307 */
u32 srtt_us; /* smoothed round trip time << 3 in usecs */
Note the << 3: the field is stored in eighths of a microsecond. The kernel keeps three extra low bits of precision so the EWMA can track sub-microsecond changes without floating point. To read microseconds you shift right by 3 — which is exactly the >> 3 you’ll write in Step 2, and the bug you’ll deliberately introduce later if you forget it.
Putting it together
One ACK arrives → tcp_in_ack_event calls your in_ack_event callback → inside it cwnd may have just grown, in_flight has dropped by the acked amount, and srtt has been updated from the new RTT sample. Three of the four numbers move on every ACK; ssthresh moves only at the gear shift or a cutback. Logging them per ACK is logging the connection’s pulse.
Where DCTCP fits. Plain Reno reacts only to loss. DCTCP (Data Center TCP) reacts earlier and more smoothly to ECN marks — routers set a Congestion Experienced bit before their queues overflow. DCTCP counts what fraction of recently-acked packets were ECN-marked and scales its window reduction by that fraction, tracked as an EWMA called
alpha. The marked-packet counter isdelivered_ce:/* include/linux/tcp.h:310-311 */ u32 delivered; /* Total data packets delivered incl. rexmits */ u32 delivered_ce; /* Like the above but only ECE marked packets */The function you are about to edit —
bpf_dctcp_update_alpha— is the one that consumesdelivered_ceto updatealpha. You’re inserting telemetry at the top of it and leaving that alpha math untouched.
What’s in bpf_dctcp.c already
Open tools/testing/selftests/bpf/progs/bpf_dctcp.c. Take a minute to skim. Key callbacks DCTCP overrides:
init(bpf_dctcp_init) — set up per-socket DCTCP state (alpha, EWMA params).ssthresh(bpf_dctcp_ssthresh) — slow-start threshold computation (uses ECN ratio). This is the “gear shift / cutback” callback from the model above.in_ack_event(bpf_dctcp_update_alpha) — fires per ACK; updates the ECN/alpha EWMA fromdelivered_ce. This is where we’ll add our telemetry.cwnd_event(bpf_dctcp_cwnd_event) — handle congestion-window events.cong_avoid/undo_cwnd/set_state— Reno-style cwnd growth, loss recovery, and CA-state transitions.
(Note: DCTCP does not implement pkts_acked. Its per-ACK accounting lives entirely in in_ack_event / bpf_dctcp_update_alpha.)
The full vtable is in SEC(".struct_ops") struct tcp_congestion_ops dctcp = { ... } near the bottom.
The in_ack_event callback is ideal for our purpose: it fires per incoming ACK, which is roughly per outgoing-data segment ACKed — one tick of the ACK clock. The argument is struct sock *sk plus a flags bitmap.
The instrumentation
Step 1: declare a ringbuf
The repo-owned lab lives under ebpf/labs/day23/ and is a derivative of the
kernel’s bpf_dctcp.c (see the SPDX/provenance header in each file): it keeps the
real DCTCP algorithm, drops the selftest-only fault-injection scaffolding, and
adds the telemetry below. The shared record sits in its own header so the BPF
producer and the userspace consumer cannot drift —
ebpf/labs/day23/logged_dctcp.h:
#ifndef PRACTICAL_EBPF_LOGGED_DCTCP_H
#define PRACTICAL_EBPF_LOGGED_DCTCP_H
/*
* Shared ring-buffer record ABI for the Day 23 telemetry DCTCP derivative.
*
* The BPF producer (logged_dctcp.bpf.c) and the userspace consumer
* (logged_dctcp.c) both include this one header so a layout change cannot
* silently desynchronize the two sides. Ringbuf transports raw bytes, so the
* struct must be identical on both. Fixed-width integers are spelled with the
* plain C types that have the required width on every LP64 Linux target the
* lab supports (BPF is always 64-bit); this avoids pulling <linux/types.h>
* into the BPF object, which already gets these widths from vmlinux.h.
*/
struct tcp_event {
unsigned long long ts_ns; /* bpf_ktime_get_ns() monotonic timestamp */
unsigned int srtt_us; /* smoothed RTT in microseconds (srtt >> 3) */
unsigned int cwnd; /* snd_cwnd, in segments */
unsigned int in_flight; /* segments sent but not yet ACKed */
unsigned long long sk_cookie; /* per-flow id (kernel socket address) */
};
#endif /* PRACTICAL_EBPF_LOGGED_DCTCP_H */
The ring buffer is declared near the top of the derivative,
ebpf/labs/day23/logged_dctcp.bpf.c:
struct {
__uint(type, BPF_MAP_TYPE_RINGBUF);
__uint(max_entries, 256 * 1024);
} rb SEC(".maps");
Step 2: add telemetry without replacing the policy
Do not replace .in_ack_event with a logging-only callback. DCTCP’s alpha update depends on that callback. Instead, insert the telemetry at the top of the existing bpf_dctcp_update_alpha function (the BPF program bound to the .in_ack_event slot) and leave the original logic below it unchanged. This is exactly how the lab source is structured — the telemetry emit, then the untouched DCTCP alpha update:
SEC("struct_ops")
void BPF_PROG(bpf_dctcp_update_alpha, struct sock *sk, __u32 flags)
{
const struct tcp_sock *tp = tcp_sk(sk);
struct bpf_dctcp *ca = inet_csk_ca(sk);
/* --- Day 23 telemetry: one record per ACK, pure read-only observation. */
struct tcp_event *e = bpf_ringbuf_reserve(&rb, sizeof(*e), 0);
if (e) {
__builtin_memset(e, 0, sizeof(*e));
e->ts_ns = bpf_ktime_get_ns();
e->srtt_us = tp->srtt_us >> 3; /* srtt is stored in eighths of a us */
e->cwnd = tp->snd_cwnd; /* kernel C uses the tcp_snd_cwnd() accessor */
e->in_flight = tp->packets_out - (tp->sacked_out + tp->lost_out) +
tp->retrans_out;
e->sk_cookie = (__u64)(unsigned long)sk; /* per-flow id; see chapter note */
bpf_ringbuf_submit(e, 0);
}
/* --- end telemetry; the original DCTCP alpha update runs unchanged below. */
/* Expired RTT */
if (!before(tp->snd_una, ca->next_seq)) {
__u32 delivered_ce = tp->delivered_ce - ca->old_delivered_ce;
__u32 alpha = ca->dctcp_alpha;
/* alpha = (1 - g) * alpha + g * F */
alpha -= min_not_zero(alpha, alpha >> dctcp_shift_g);
if (delivered_ce) {
__u32 delivered = tp->delivered - ca->old_delivered;
/* If dctcp_shift_g == 1, a 32bit value would overflow
* after 8 M packets.
*/
delivered_ce <<= (10 - dctcp_shift_g);
delivered_ce /= max(1U, delivered);
alpha = min(alpha + delivered_ce, DCTCP_MAX_ALPHA);
}
ca->dctcp_alpha = alpha;
dctcp_reset(tp, ca);
}
}
Each field maps straight back to the mental model: srtt_us >> 3 is the smoothed RTT in real microseconds; snd_cwnd is the current speed limit in segments; the in_flight expression is how full the pipe is right now. When you watch these scroll by, you’re watching the ACK clock tick.
If you prefer a wrapper, rename the original body to a helper and call it from the wrapper after emitting the event. Either way, the original alpha update must still run.
Why not
bpf_get_socket_cookie(sk)? It is not available totcp_congestion_opsprograms. The helper set for this program type is whateverbpf_tcp_ca_get_func_proto()(net/ipv4/bpf_tcp_ca.c) exposes —tcp_send_ack,bpf_sk_storage_get/_delete,bpf_{set,get}sockopt,ktime_get_coarse_ns— plus the base helpers;get_socket_cookieis only offered to skb/sock_ops/sock_addr program types. The verifier rejects it at load (program of this type cannot use helper bpf_get_socket_cookie), so the program never attaches. We instead cast the trustedstruct sock *skto a scalar: under root/CAP_PERFMON (allow_ptr_leaksis on, the normal case for loading struct_ops) the trustedPTR_TO_BTF_IDcasts cleanly, giving a stable per-flow id for the life of the connection.sk_cookiethen prints the kernel socket address rather than an SO_COOKIE id. If you need a true SO_COOKIE-style identity, stash one in aBPF_MAP_TYPE_SK_STORAGEviabpf_sk_storage_get(&map, sk, &init, BPF_SK_STORAGE_GET_F_CREATE)— that helper is in the tcp_ca set.
Sidebar: what BPF_MAP_TYPE_SK_STORAGE is
That last sentence drops a new map type on you, and it’s worth four sentences because it’s the right way to mint per-flow state. Socket-local storage attaches a private value to an individual socket — the value lives and dies with that socket. Unlike a hash map keyed by the sk pointer (where you’d have to remember to delete the entry, and risk a stale key if a new socket reused the address), the kernel reclaims SK_STORAGE automatically when the socket is freed — no stale-key problem, ever. You touch it with one helper, which gets-or-creates per-flow state in a single call:
struct flow_id *fid = bpf_sk_storage_get(&sk_ids, sk, &init,
BPF_SK_STORAGE_GET_F_CREATE);
With BPF_SK_STORAGE_GET_F_CREATE it allocates and initializes the blob on first touch, then returns the same blob on every later call — the canonical get-or-create per-flow state idiom, and the kernel-blessed alternative to casting the raw sk pointer. (The helper is in the tcp_ca allowlist, as the citation at the end of the previous note shows.) We won’t build a full SK_STORAGE lab today — for our purposes the raw-pointer cast is enough — but now you know the proper tool when you outgrow it.
Step 3: keep the callback slot, change only the algorithm name
Find the SEC(".struct_ops") struct tcp_congestion_ops dctcp = { ... } block. Keep the .in_ack_event slot pointed at the DCTCP implementation and change the name to avoid colliding with the original. The lab’s assembled vtable — the full required-plus-optional slot set, named bpf_dctcp_log:
SEC(".struct_ops")
struct tcp_congestion_ops dctcp = {
.init = (void *)bpf_dctcp_init,
.in_ack_event = (void *)bpf_dctcp_update_alpha, /* per-ACK telemetry hook */
.cwnd_event = (void *)bpf_dctcp_cwnd_event,
.ssthresh = (void *)bpf_dctcp_ssthresh, /* required */
.cong_avoid = (void *)bpf_dctcp_cong_avoid, /* required (or cong_control) */
.undo_cwnd = (void *)bpf_dctcp_cwnd_undo, /* required */
.set_state = (void *)bpf_dctcp_state,
.flags = TCP_CONG_NEEDS_ECN,
.name = "bpf_dctcp_log",
};
Name length matters. Congestion-control names are capped at
TCP_CA_NAME_MAX - 1= 15 usable characters because the struct field ischar name[16]and needs room for a trailing NUL. Since we load this CC as a BPF struct_ops module, a 16-character name fails at load time, not at selection. When the kernel initializes thenamemember,bpf_tcp_ca_init_member()(net/ipv4/bpf_tcp_ca.c:228) callsbpf_obj_name_cpy(tcp_ca->name, ..., sizeof(name)=16). That helper (kernel/bpf/syscall.c:1208) copies until it hits a NUL within the 16-byte window; with 16 non-NUL chars there’s no room for a terminator,srcreachesend, and it returns-EINVAL.init_memberpropagates that negative return, and__bpf_struct_ops_map_update_elem(kernel/bpf/bpf_struct_ops.c:763) doesgoto reset_unlock— so the whole struct_ops map update fails with EINVAL. A 16-character name likebpf_dctcp_loggedtherefore never registers at all: it never appears intcp_available_congestion_control, so there is no “registers fine,” no later truncated lookup, and noENOENT-on-select. (That truncated-select-then-ENOENTstory is only how the legacy kernel-module registration path behaves, which is not what this chapter does.) Keep the name to 15 chars or fewer:bpf_dctcp_logis 13 characters and safe.
Two field-access notes. (1) We read
tp->snd_cwnddirectly, which works in BPF (the realbpf_dctcp.cdoes the same). Kernel C convention, however, is thetcp_snd_cwnd(tp)accessor (include/net/tcp.h) — don’t be surprised when the C source uses the helper instead of the bare field. (2) The full kernel formula istcp_packets_in_flight(tp) = packets_out - (sacked_out + lost_out) + retrans_out; we includeretrans_outabove. Omitting it (as a simplification) undercounts in-flight bytes during loss recovery.
Userspace consumer
logged_dctcp is a new, out-of-tree libbpf program — not something make inside selftests/bpf produces (that builds test_progs). In this repo it is owned at ebpf/labs/day23/logged_dctcp.c and built by the lab Makefile. It is the Day 3 ringbuf loader plus a struct_ops attach.
The load is a struct_ops attach (distinct from a normal program attach), then a standard ringbuf poll loop:
The full loader — bpf_map__attach_struct_ops to register the CC, the ring-buffer poll loop, and a SIGINT/SIGTERM path that destroys the link (detaching and unregistering the CC) before freeing the consumer and skeleton:
#include <errno.h>
#include <signal.h>
#include <stdio.h>
#include <string.h>
#include <bpf/libbpf.h>
#include "logged_dctcp.h"
#include "logged_dctcp.skel.h"
static volatile sig_atomic_t exiting;
static void handle_signal(int signal_number)
{
(void)signal_number;
exiting = 1;
}
static int install_signal_handlers(void)
{
const struct sigaction action = {
.sa_handler = handle_signal,
};
if (sigaction(SIGINT, &action, NULL) != 0 ||
sigaction(SIGTERM, &action, NULL) != 0) {
fprintf(stderr, "failed to install signal handlers: %s\n",
strerror(errno));
return -errno;
}
return 0;
}
static int handle_event(void *ctx, void *data, size_t size)
{
const struct tcp_event *e = data;
(void)ctx;
if (size != sizeof(*e)) {
fprintf(stderr, "unexpected ringbuf record size: %zu\n", size);
return 0;
}
printf("[sk=%llu t=%lluns] cwnd=%u in_flight=%u srtt=%uus\n",
(unsigned long long)e->sk_cookie, (unsigned long long)e->ts_ns,
e->cwnd, e->in_flight, e->srtt_us);
return 0;
}
int main(void)
{
struct logged_dctcp_bpf *skel = NULL;
struct bpf_link *link = NULL;
struct ring_buffer *ringbuf = NULL;
int err;
setvbuf(stdout, NULL, _IOLBF, 0);
err = install_signal_handlers();
if (err)
return 1;
skel = logged_dctcp_bpf__open_and_load();
if (!skel) {
fprintf(stderr, "failed to open and load logged_dctcp skeleton\n");
return 1;
}
/* struct_ops attach registers "bpf_dctcp_log" in the TCP CC framework. */
link = bpf_map__attach_struct_ops(skel->maps.dctcp);
if (!link) {
err = -errno;
fprintf(stderr,
"failed to attach struct_ops (need root or CAP_BPF): %s\n",
strerror(errno));
goto cleanup;
}
ringbuf = ring_buffer__new(bpf_map__fd(skel->maps.rb), handle_event,
NULL, NULL);
if (!ringbuf) {
err = -errno;
fprintf(stderr, "failed to create ring buffer: %s\n", strerror(errno));
goto cleanup;
}
fprintf(stderr,
"bpf_dctcp_log registered; select it per-socket with "
"'-C bpf_dctcp_log'. Ctrl-C to detach.\n");
while (!exiting) {
err = ring_buffer__poll(ringbuf, 100 /* ms */);
if (err == -EINTR) {
err = 0;
break;
}
if (err < 0) {
fprintf(stderr, "ring buffer poll failed: %s\n", strerror(-err));
break;
}
}
cleanup:
ring_buffer__free(ringbuf);
bpf_link__destroy(link); /* detaches + unregisters bpf_dctcp_log */
logged_dctcp_bpf__destroy(skel);
return err ? 1 : 0;
}
handle_event prints one line per event, validating the record size first:
[sk=18446612345678900 t=12345...] cwnd=10 in_flight=0 srtt=24us
Build it with the lab Makefile so make produces the logged_dctcp binary the Run section uses.
Run
Loading a struct_ops CC, adding it to the allowed list, running iperf3, and
then unwinding all of that cleanly is fiddly to do by hand — and a half-finished
run leaves a registered algorithm and a mutated sysctl behind. The repo ships a
safe runner, ebpf/labs/day23/run.sh, that owns every piece of live state and
restores it on any exit (success, error, or Ctrl-C): it captures
tcp_allowed_congestion_control and restores it, starts the loader and SIGTERMs
it (so the struct_ops link is destroyed and bpf_dctcp_log unregistered),
builds and tears down a netns + veth + netem path, and owns the iperf3
server and client by PID. Like scripts/smoke.sh, it is opt-in:
make -C ebpf/labs day23 # build the loader first (see the Lab environment page)
# veth+netem path (default) — the lossy path that makes the sawtooth visible:
EBPF_LABS_ALLOW_PRIVILEGED=1 \
sudo --preserve-env=EBPF_LABS_ALLOW_PRIVILEGED ebpf/labs/day23/run.sh veth
# or the always-available loopback path (monotonic climb only):
EBPF_LABS_ALLOW_PRIVILEGED=1 \
sudo --preserve-env=EBPF_LABS_ALLOW_PRIVILEGED ebpf/labs/day23/run.sh loopback
The loader prints one line per ACK to its stdout (the sk= value is the kernel
socket address — a stable per-flow id for the life of the connection, not an
SO_COOKIE id):
[sk=18446612345678900 t=12345...] cwnd=10 in_flight=0 srtt=24us
[sk=18446612345678900 t=12346...] cwnd=11 in_flight=10 srtt=31us
[sk=18446612345678900 t=12348...] cwnd=14 in_flight=12 srtt=29us
...
You’re now seeing TCP’s internal CC decisions in real time, per ACK, in a flow that runs through your custom BPF-defined algorithm. Read it against the model: cwnd starts at 10 (the kernel’s initial window) and grows — and because each ACK bumps it by ~1, you’re watching slow start’s exponential ramp. srtt updates per ACK as new RTT samples arrive. in_flight tracks how full the pipe is, hugging just under cwnd — exactly the in_flight curve from the sawtooth diagram. What you won’t see on loopback is the teeth, and the next box explains why.
Loopback caveat. Over
127.0.0.1there is no packet loss and the RTT is microseconds, so you only ever seecwndgrow monotonically — you will not see the loss-drivencwndcollapse and RTT spikes that the anomaly-detection use case below depends on. That is exactly why the runner defaults to thevethmode: it puts the peer in a separate netns and appliesnetem delay 20ms loss 1%to both directions, so with 1% loss injected you finally seecwndcut on a drop and climb back — the sawtooth made real.run.sh loopbackis the fallback when your host can’t create a netns.
The runner handles cleanup itself — on exit it unregisters bpf_dctcp_log, restores the exact tcp_allowed_congestion_control value it captured at start, and deletes the netns/veth it created. Its full text (read it before running anything privileged):
ebpf/labs/day23/run.sh
#!/usr/bin/env bash
# SPDX-License-Identifier: GPL-2.0
#
# run.sh — safe, self-cleaning runner for the Day 23 telemetry DCTCP lab.
#
# It owns every piece of live state it creates and restores/destroys all of it
# on ANY exit (success, error, or signal), in reverse order of creation:
#
# 1. captures net.ipv4.tcp_allowed_congestion_control and restores it;
# 2. starts the logged_dctcp loader (which registers "bpf_dctcp_log") and
# SIGTERMs it on exit, so the struct_ops link is destroyed and the CC is
# unregistered deterministically;
# 3. (veth mode) creates a network namespace + veth pair + netem qdisc and
# tears them down;
# 4. starts an iperf3 server and client it owns by PID and kills them.
#
# Like scripts/smoke.sh this is opt-in and refuses to run without an explicit
# acknowledgement and root. It never installs packages.
#
# Usage:
# EBPF_LABS_ALLOW_PRIVILEGED=1 sudo --preserve-env=EBPF_LABS_ALLOW_PRIVILEGED \
# ./run.sh [veth|loopback]
#
# Environment knobs (all optional):
# DURATION iperf3 transfer seconds (default 10)
# NETEM netem parameters in veth mode (default "delay 20ms loss 1%")
set -euo pipefail
HERE=$(cd -- "$(dirname -- "${BASH_SOURCE[0]}")" && pwd)
ROOT=$(cd -- "$HERE/.." && pwd)
LOADER="$ROOT/.output/day23/logged_dctcp"
MODE=${1:-veth}
DURATION=${DURATION:-10}
NETEM=${NETEM:-delay 20ms loss 1%}
CC_NAME="bpf_dctcp_log"
SUFFIX=$$
OCTET=$((SUFFIX % 200 + 20))
NS="ebpf-day23-$SUFFIX"
VETH="d23h$SUFFIX"
VPEER="d23p$SUFFIX"
HOST_IP="10.223.$OCTET.1"
PEER_IP="10.223.$OCTET.2"
PREFIX=24
LOADER_PID=
IPERF_SERVER_PID=
ORIG_ALLOWED=
NS_CREATED=0
VETH_CREATED=0
ALLOWED_CHANGED=0
log() { printf 'day23: %s\n' "$*" >&2; }
fail() { printf 'day23: %s\n' "$*" >&2; exit 1; }
cleanup() {
local status=$?
trap - EXIT INT TERM
if [[ -n $IPERF_SERVER_PID ]] && kill -0 "$IPERF_SERVER_PID" 2>/dev/null; then
kill -TERM "$IPERF_SERVER_PID" 2>/dev/null || true
wait "$IPERF_SERVER_PID" 2>/dev/null || true
fi
if [[ -n $LOADER_PID ]] && kill -0 "$LOADER_PID" 2>/dev/null; then
# SIGTERM triggers the loader's deterministic detach + unregister.
kill -TERM "$LOADER_PID" 2>/dev/null || true
wait "$LOADER_PID" 2>/dev/null || true
fi
if (( VETH_CREATED )); then
ip link del "$VETH" 2>/dev/null || true
fi
if (( NS_CREATED )); then
ip netns del "$NS" 2>/dev/null || true
fi
if (( ALLOWED_CHANGED )) && [[ -n $ORIG_ALLOWED ]]; then
sysctl -q -w "net.ipv4.tcp_allowed_congestion_control=$ORIG_ALLOWED" \
2>/dev/null || true
log "restored tcp_allowed_congestion_control to: $ORIG_ALLOWED"
fi
exit "$status"
}
trap cleanup EXIT INT TERM
# --- Preconditions -----------------------------------------------------------
if [[ ${EBPF_LABS_ALLOW_PRIVILEGED:-0} != 1 ]]; then
fail 'set EBPF_LABS_ALLOW_PRIVILEGED=1 to acknowledge privileged BPF attachment'
fi
if (( EUID != 0 )); then
fail 'run with sudo after setting EBPF_LABS_ALLOW_PRIVILEGED=1'
fi
[[ ${EBPF_LABS_ALLOW_STRUCT_OPS:-0} == 1 ]] ||
fail 'set EBPF_LABS_ALLOW_STRUCT_OPS=1 to acknowledge TCP struct_ops registration'
[[ -x $LOADER ]] || fail "missing loader $LOADER; build day23 first (see chapter)"
for tool in ip sysctl iperf3 ss; do
command -v "$tool" >/dev/null 2>&1 || fail "missing required command: $tool"
done
case $MODE in veth|loopback) ;; *) fail "mode must be 'veth' or 'loopback'";; esac
# --- 1. Capture the CC allowed-list before touching anything -----------------
ORIG_ALLOWED=$(sysctl -n net.ipv4.tcp_allowed_congestion_control)
log "saved tcp_allowed_congestion_control: $ORIG_ALLOWED"
# --- 2. Start the loader; wait until bpf_dctcp_log is registered -------------
"$LOADER" &
LOADER_PID=$!
for _ in $(seq 1 50); do
if ! kill -0 "$LOADER_PID" 2>/dev/null; then
wait "$LOADER_PID" 2>/dev/null || true
fail 'loader exited before registering (need root/CAP_BPF and a struct_ops-capable kernel)'
fi
if grep -qw "$CC_NAME" /proc/sys/net/ipv4/tcp_available_congestion_control; then
break
fi
sleep 0.1
done
grep -qw "$CC_NAME" /proc/sys/net/ipv4/tcp_available_congestion_control ||
fail "timed out waiting for $CC_NAME in tcp_available_congestion_control"
log "$CC_NAME is registered and available"
# --- 3. Allow the algorithm for the client socket ----------------------------
sysctl -q -w "net.ipv4.tcp_allowed_congestion_control=$ORIG_ALLOWED $CC_NAME"
ALLOWED_CHANGED=1
# --- 4. Wire up the transfer path and run iperf3 -----------------------------
if [[ $MODE == veth ]]; then
log "building netns/veth path with netem: $NETEM"
ip netns add "$NS"; NS_CREATED=1
ip link add "$VETH" type veth peer name "$VPEER"; VETH_CREATED=1
ip link set "$VPEER" netns "$NS"
ip addr add "$HOST_IP/$PREFIX" dev "$VETH"
ip link set "$VETH" up
ip -n "$NS" addr add "$PEER_IP/$PREFIX" dev "$VPEER"
ip -n "$NS" link set "$VPEER" up
ip -n "$NS" link set lo up
# netem on both directions so loss/delay is symmetric.
# shellcheck disable=SC2086
tc qdisc add dev "$VETH" root netem $NETEM
# shellcheck disable=SC2086
ip netns exec "$NS" tc qdisc add dev "$VPEER" root netem $NETEM
ip netns exec "$NS" iperf3 -s -1 -B "$PEER_IP" >/dev/null 2>&1 &
IPERF_SERVER_PID=$!
sleep 0.5
log "running: iperf3 -c $PEER_IP -C $CC_NAME -t $DURATION"
iperf3 -c "$PEER_IP" -C "$CC_NAME" -t "$DURATION" || true
log "socket CC (should show $CC_NAME):"
ss -ti "dst $PEER_IP" | grep -w "$CC_NAME" || log "(no live socket sampled)"
else
log "running over loopback (no loss; expect a monotonic cwnd climb only)"
iperf3 -s -1 >/dev/null 2>&1 &
IPERF_SERVER_PID=$!
sleep 0.5
log "running: iperf3 -c 127.0.0.1 -C $CC_NAME -t $DURATION"
iperf3 -c 127.0.0.1 -C "$CC_NAME" -t "$DURATION" || true
log "socket CC (should show $CC_NAME):"
ss -ti "dst 127.0.0.1" | grep -w "$CC_NAME" || log "(no live socket sampled)"
fi
log "transfer complete; telemetry above came from the loader on fd 1"
log "cleaning up (unregister $CC_NAME, restore allowed-list, delete netns/veth)"
What to do with this data
A few things you couldn’t do before:
- Per-flow performance graphs: export to a TSDB, plot cwnd over time per
sk_cookie. - Anomaly detection: alert when
in_flightcollapses (loss event), correlated with RTT spikes — that’s the sawtooth tooth, and on a real lossy path you can catch it live. - Verify CC behavior: see whether your tuning is actually changing TCP’s reaction.
- Capacity planning: understand the cwnd distribution of your real workload, not synthetic benchmarks.
There are no Dumb Questions
Q: Why cast the sk pointer to a scalar instead of using a socket cookie?
A: bpf_get_socket_cookie isn’t in the tcp_ca helper set, so the verifier rejects it at load (see the instrumentation step). Casting the trusted struct sock *sk to a u64 gives a stable per-flow id for the life of the connection at zero cost — it’s the kernel socket address, which doesn’t change while the socket lives. If you need a true SO_COOKIE-style identity that survives address reuse, mint one in BPF_MAP_TYPE_SK_STORAGE instead (that helper is allowed).
Q: Why instrument in_ack_event and not pkts_acked?
A: DCTCP doesn’t implement pkts_acked at all — its per-ACK accounting lives entirely in in_ack_event / bpf_dctcp_update_alpha. Hooking the callback the algorithm actually runs means our telemetry rides the exact code path that already fires per ACK, with no extra slot to wire up. (You can add a pkts_acked callback as a brand-new slot — that’s the “Add another callback” exercise below — but for logging the four numbers, in_ack_event is where the data already flows.)
Q: Does emitting to the ringbuf change what the CC algorithm does?
A: No. We only read fields and submit a copy; the original alpha-update math runs untouched right below the telemetry. Pure observation is safe — it’s mutation of TCP state from a callback that needs care (see the Check question).
What to break
Wrong field semantics
e->srtt_us = tp->srtt_us; /* without >> 3 */
tp->srtt_us is stored in eighths of a microsecond (gives sub-µs precision without floats — the << 3 in the model section). Reading it directly produces values 8× too large. Symptom: latency reports look like RTT is hundreds of ms when it’s actually tens. Lesson: kernel field semantics matter — read the field’s docstring (or include/linux/tcp.h) before assuming.
Forget to release
struct tcp_event *e = bpf_ringbuf_reserve(&rb, sizeof(*e), 0);
if (!e) return;
e->ts_ns = ...;
/* forgot bpf_ringbuf_submit */
return;
Verifier rejects: Unreleased reference id=N alloc_insn=M. The ringbuf-reserve return is a refcounted resource, exactly like a kfunc acquire. Same rules: every path must submit or discard.
Run with high concurrency
Run 100 parallel iperf3 streams. Watch ringbuf drops via the percpu drop counter (Day 13 pattern). At ~100K events/sec, you’ll start dropping. Fix:
- Filter (only emit when cwnd changes by > N).
- Size up the ringbuf.
- Aggregate per-sk in a map; emit summary periodically.
Add another callback
DCTCP itself doesn’t use pkts_acked, but tcp_congestion_ops has the slot — so you can add it as a new callback in your module to capture per-ACK packet/ECN accounting:
SEC("struct_ops/dctcp_pkts_acked_logged")
void BPF_PROG(my_pkts_acked, struct sock *sk, const struct ack_sample *sample)
{
/* emit packet count, RTT sample, etc. */
}
Add .pkts_acked = (void *)my_pkts_acked to the vtable. Now you have two BPF programs in the same struct_ops module, both fed real-time data. (This is a new slot you’re populating, not a DCTCP callback you’re overriding — the upstream DCTCP leaves pkts_acked NULL.)
What to read in the kernel
-
net/ipv4/tcp_input.c— searchin_ack_event. The C call site that invokes your BPF callback per incoming ACK. Trace the call path fromtcp_v4_rcvdown to thein_ack_eventinvocation. Note that the kernel calls only the socket’s selected CC’s callback — a single indirect call throughicsk->icsk_ca_ops->in_ack_event— so your callback runs only for connections actually using your algorithm, not for every registered CC. -
include/uapi/linux/tcp.h—struct tcp_info. The same per-connection fields you read off the BTFstruct tcp_sockpointer are also surfaced to userspace here viagetsockopt(TCP_INFO). When you wonder “what other state can I expose?” — this is the catalog. (Notebpf_get_socket_cookiereturns an SO_COOKIEu64, not atcp_info, and isn’t available here — see the instrumentation step.) -
include/linux/tcp.h— the kernel-internalstruct tcp_sock. ~170 fields. Read once. The relationship:struct tcp_info(UAPI) is a curated subset ofstruct tcp_sock(internal); BPF programs can read either by castingstruct sock *sk → struct tcp_sock * = (void *)sk. The four numbers you logged today live at lines 225 (snd_cwnd), 248 (snd_ssthresh), 307 (srtt_us), and 308 (packets_out). -
include/net/tcp.h— the accessors and helpers from the model:tcp_snd_cwnd()(:1509),tcp_in_slow_start()(:1520), andtcp_packets_in_flight()(:1502) =packets_out - tcp_left_out(tp) + retrans_out, withtcp_left_out()(:1483) =sacked_out + lost_out. This is where thein_flightformula you typed comes from. -
tools/testing/selftests/bpf/progs/bpf_cubic.c— another struct_ops example, full Cubic implementation. Compare againstbpf_dctcp.cfor stylistic differences. -
net/ipv4/tcp_cong.c— CC framework.tcp_register_congestion_control. How yourbpf_dctcp_logends up callable. Day 16 (network book) covered this in detail.
Bullet Points
- The ACK clock is the whole game. TCP self-paces: each incoming ACK frees window space and is permission to send ~1 more segment.
in_ack_eventfires on each tick, which is why it’s the natural per-segment hook. - Four numbers tell the story.
cwnd(snd_cwnd) is the speed limit in segments;in_flightis how many are outstanding (cwndcaps it);ssthreshis the gear shift — below it slow start doublescwndper RTT, at/above it congestion avoidance adds ~1 per RTT;srtt_us(stored<< 3, eighths of a µs) is the smoothed RTT for timeouts. Loss/ECN cutscwndandssthresh— the sawtooth. - struct_ops modules are ordinary BPF programs you can edit, instrument, and test.
- Add a ringbuf to one callback to get per-event telemetry without modifying the kernel.
- The verifier still applies; standard ringbuf reserve/submit and reference rules.
BPF_MAP_TYPE_SK_STORAGE(bpf_sk_storage_get(..., BPF_SK_STORAGE_GET_F_CREATE)) is the kernel-blessed per-socket store — auto-reclaimed with the socket, and in thetcp_caallowlist — when you need a real per-flow id.- The pattern works for any struct_ops vtable: TCP CC, sched_ext, future ones.
- For high-rate observability, drop counters and rate-limiting filters in BPF are essential.
Check question
You add bpf_ringbuf_reserve to a struct_ops callback that fires per ACK at line rate. What’s the worst-case impact on TCP performance?
Click to reveal answer
Answer: Each callback adds ~50–100 ns. At 1 Mpps (a high-rate flow on a fast link), that’s 5–10% extra CPU just for the BPF reserve+submit cost. If the ringbuf fills (consumer can’t keep up), bpf_ringbuf_reserve returns NULL and your code skips the emit entirely; TCP itself is unaffected — the original CC logic still runs.
The bigger risk is if your BPF logic blocks somehow. It can’t — non-sleepable struct_ops can’t sleep, take regular mutexes, or do anything that schedules. It also can’t modify TCP state in a way the algorithm wasn’t expecting (you can — be careful). Pure observation (read fields, emit to ringbuf) is safe up to whatever overhead you can tolerate; mutation needs explicit care because you’re now changing what the CC algorithm does, not just watching it.
For 99% of telemetry use cases, the worst case is: (a) some events get dropped under load (handle via drop counter); (b) ~5% extra CPU on hot connections. Both manageable.
Tomorrow
Day 24: BTF spelunking. Find a kfunc on your kernel that you’ve never used, read its signature, write a program that calls it.
Day 24 — BTF spelunking: finding and using kfuncs you haven’t met
Today’s mission: find a kfunc on your kernel that you’ve never used, read its signature from BTF, write a program that calls it. Along the way: learn how BTF stores a function (the surprising answer is “in two pieces”), where the vmlinux BTF blob physically comes from, and how to make a program degrade gracefully on a kernel that’s missing the kfunc you want. Total time: ~95 minutes. End of Phase 4.
Why discoverability matters
The kernel has hundreds of kfuncs. They’re partially documented in Documentation/bpf/kfuncs.rst but the doc is incomplete and lags behind the kernel. The authoritative source is BTF in your running kernel.
Today’s skill: navigate that authoritative source — and to navigate it confidently, you have to know two things the earlier days only name-dropped. First, where the BTF blob comes from (so you can trust it as ground truth). Second, how BTF physically stores a function — because the way it stores a function is the whole reason today’s central trick, bpftool btf dump ... format c, exists.
How BTF describes the kernel
You’ve met BTF before. Recall from Days 3–4: BTF is a compact, deduplicated table of every type and (selected) function the kernel exposes; it lives at /sys/kernel/btf/vmlinux (the running kernel’s BTF, a ~5–10 MB binary blob) and at /sys/kernel/btf/<module> for loadable modules; libbpf reads it for CO-RE; and Day 4 enumerated the ~19 BTF kinds (INT, PTR, STRUCT, FUNC, FUNC_PROTO, …) — each entry in the table is one struct btf_type whose info field encodes which kind it is. BPF programs reference kernel symbols by name against this table; libbpf and the verifier resolve those names to BTF entries at load time.
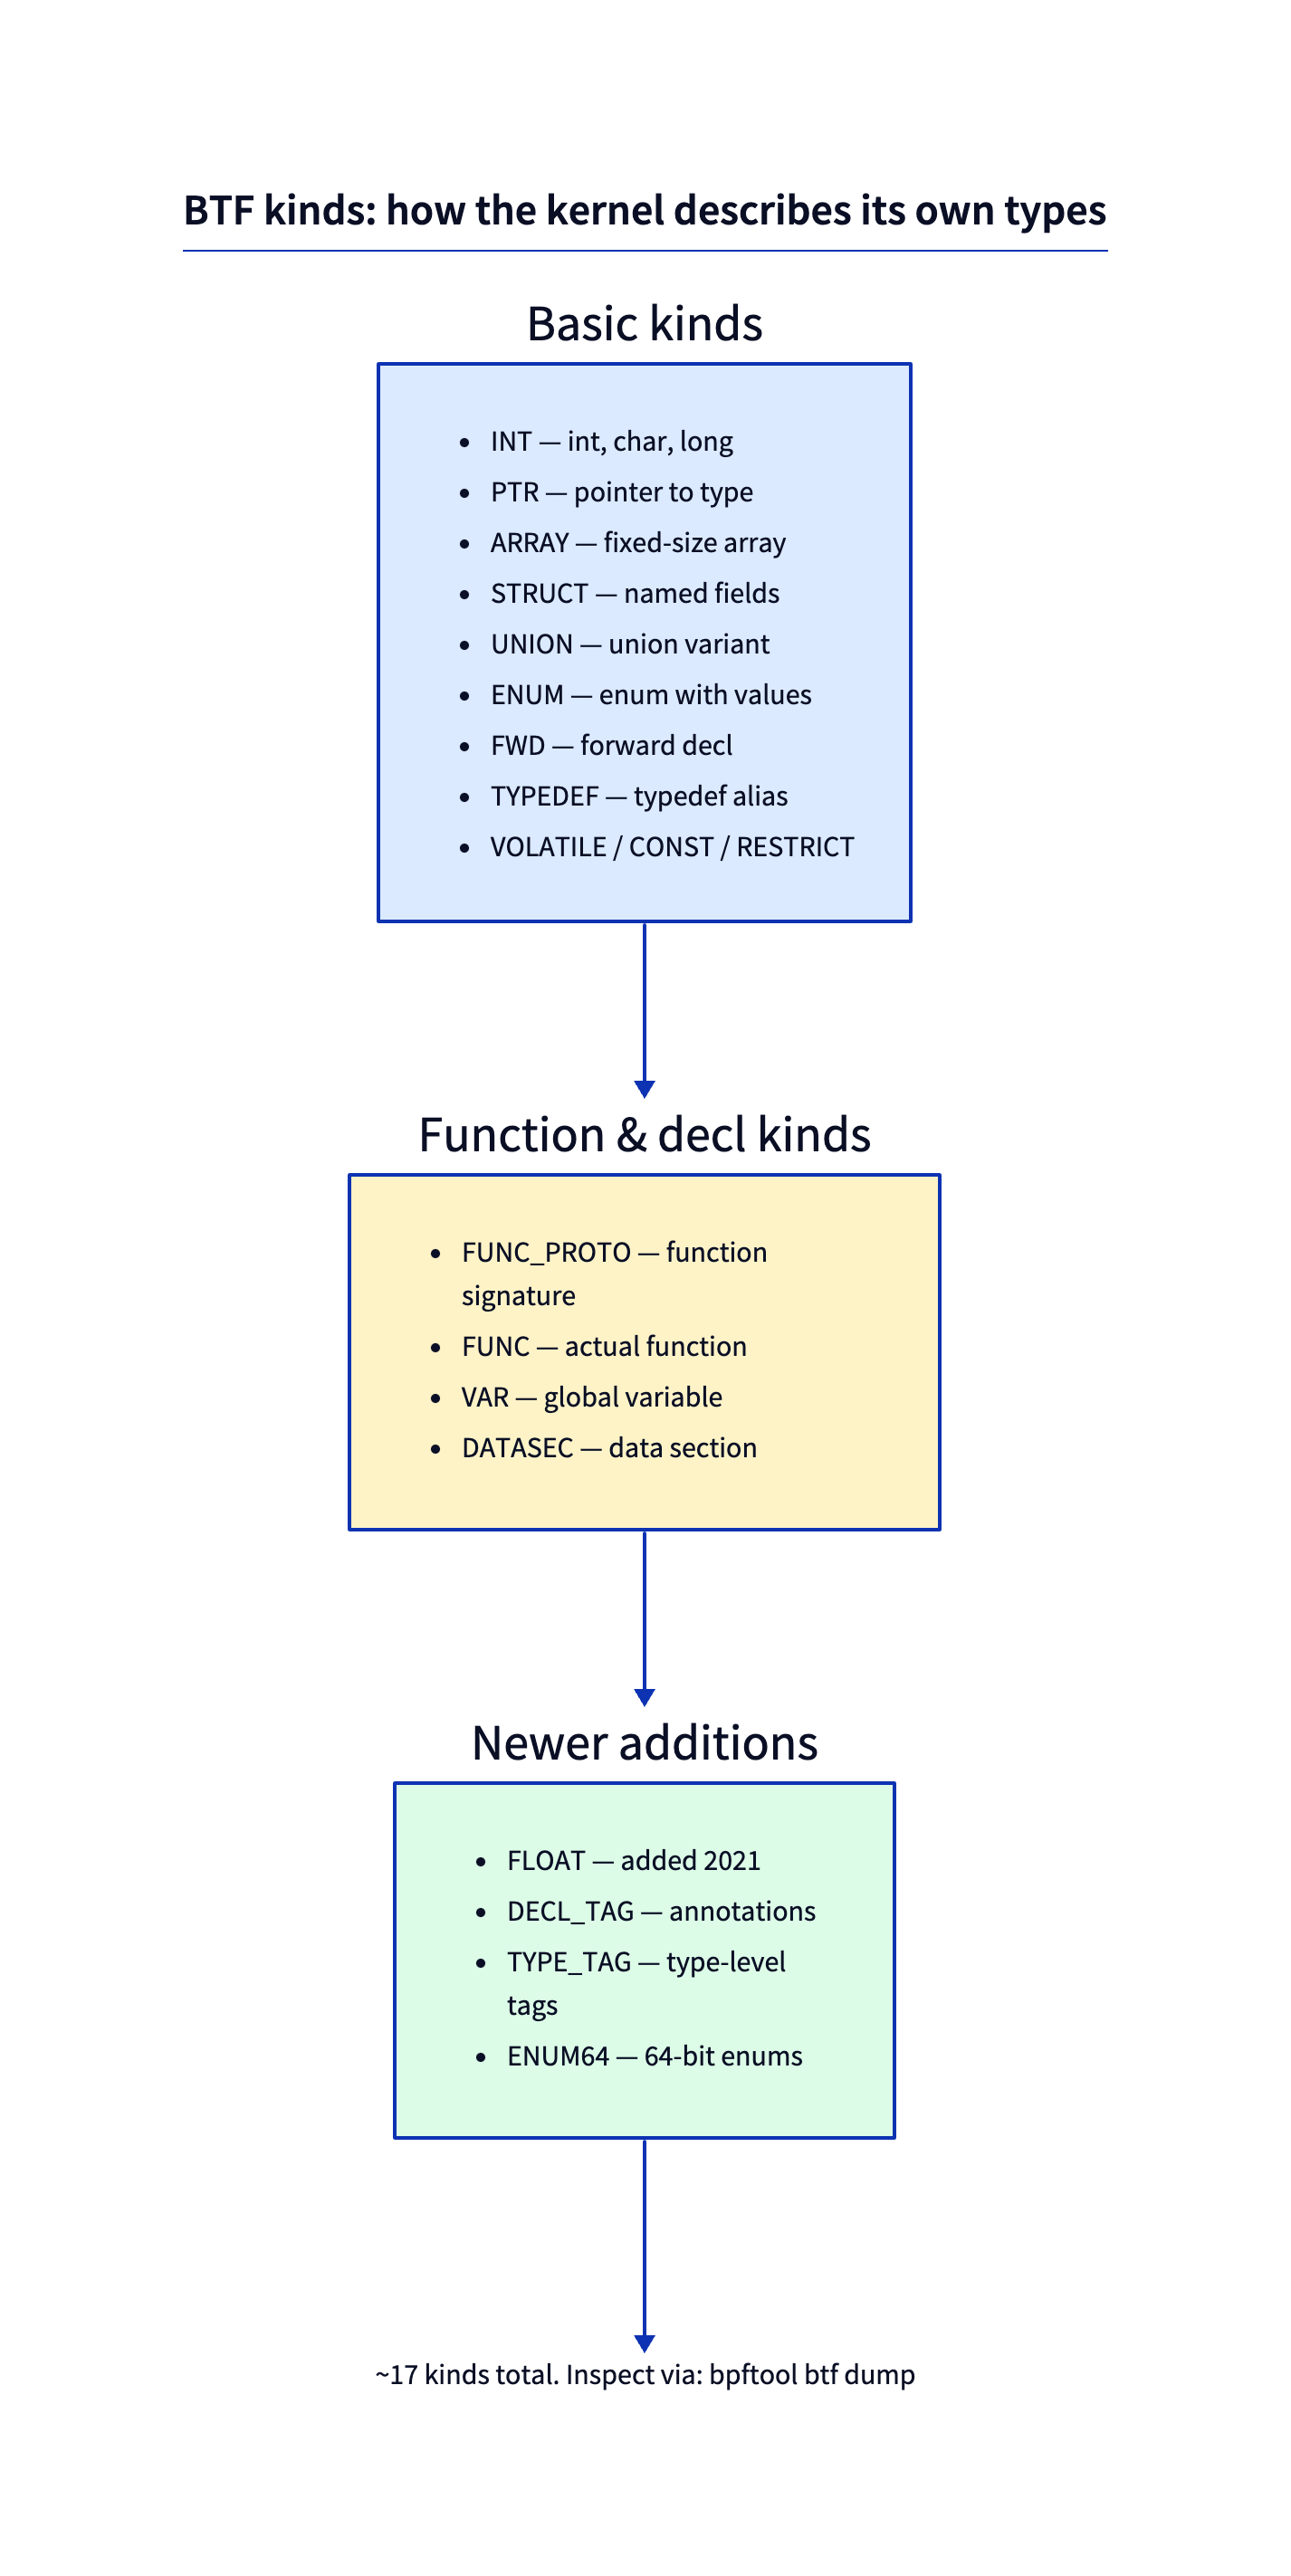
Two of those kinds — FUNC and FUNC_PROTO — are the ones that matter today, and the relationship between them is the single fact this whole chapter turns on. We’ll get there in a moment. First, the question Days 3–4 left open: where does the vmlinux blob actually come from?
Where vmlinux BTF physically comes from: pahole + DWARF
Nobody hand-writes /sys/kernel/btf/vmlinux. It’s a build artifact. When the kernel is compiled with CONFIG_DEBUG_INFO_BTF set, the build first compiles the kernel with ordinary DWARF debug info, then runs pahole over that DWARF to emit a compact, deduplicated .BTF section, which gets linked into vmlinux and exposed at /sys/kernel/btf/vmlinux at boot. Per-module BTF (/sys/kernel/btf/<module>) is produced the same way, gated by CONFIG_DEBUG_INFO_BTF_MODULES.
That’s the production side; Days 3–4 only showed the consumer side (libbpf/bpftool reading the blob). You don’t need more than three sentences of it — its only job here is to justify trusting BTF as ground truth. But one detail pays off later: the pahole feature flags are version-gated. In v7.1, scripts/Makefile.btf selects --btf_features=...,decl_tag_kfuncs for new-enough pahole — and decl_tag_kfuncs is what annotates which FUNC entries are actually kfuncs. That’s why a newer kernel’s BTF can tell you more about kfuncs than an old one’s: the inventory is only as rich as the pahole that built it.
scripts/Makefile.btf:3—pahole-ver := $(CONFIG_PAHOLE_VERSION);:17the--btf_features=...,decl_tag_kfuncsflag (pahole-driven, version-gated).lib/Kconfig.debug:398—config DEBUG_INFO_BTF(the switch that turns vmlinux BTF generation on);:428—config DEBUG_INFO_BTF_MODULES(depends on DEBUG_INFO_BTF && MODULES).

A function lives in BTF as two entries, not one
Here is the fact that makes today’s tooling make sense. When BTF describes a function, it does not put the name and the arguments in one record. It uses two separate btf_type entries linked by a reference:
- A
BTF_KIND_FUNCentry (kind = 12) carries only the function’s name, alinkagefield, and atype_idthat points at — - a
BTF_KIND_FUNC_PROTOentry (kind = 13), which carries the return type and the ordered argument types. The FUNC_PROTO has no name — it’s just the shape of a signature.
The FUNC’s type_id is the only link between the name and the arguments. Concretely, every BTF entry is a struct btf_type (include/uapi/linux/btf.h:43) whose first field is name_off (:44, an offset into the string table) and whose info field packs the kind — extracted by the BTF_INFO_KIND(info) macro (:68). The kind constants are BTF_KIND_FUNC = 12 (:85) and BTF_KIND_FUNC_PROTO = 13 (:86). For a FUNC, the type_id reuses the btf_type union’s type slot — it is the pointer to the FUNC_PROTO.
This is why a raw bpftool btf dump line for a function shows no arguments:
[98739] FUNC 'bpf_address_lookup' type_id=59431 linkage=static
The name is bpf_address_lookup, in single quotes (there is no name= token — that’s why the grep idiom below matches the quoted name). The linkage is static. And the arguments? They’re not here. They live in entry #59431, a separate FUNC_PROTO that this line merely points at via type_id. To see the signature from the raw dump you’d have to go find that entry and read it yourself.
linkage comes from enum btf_func_linkage (include/uapi/linux/btf.h:169-172): BTF_FUNC_STATIC = 0, BTF_FUNC_GLOBAL = 1, BTF_FUNC_EXTERN = 2. Most in-kernel functions are static. The kfuncs you call from BPF show up as extern references from your object’s BTF — your .bpf.o says “I need an external symbol of this shape,” and libbpf resolves it against the kernel’s BTF at load time.
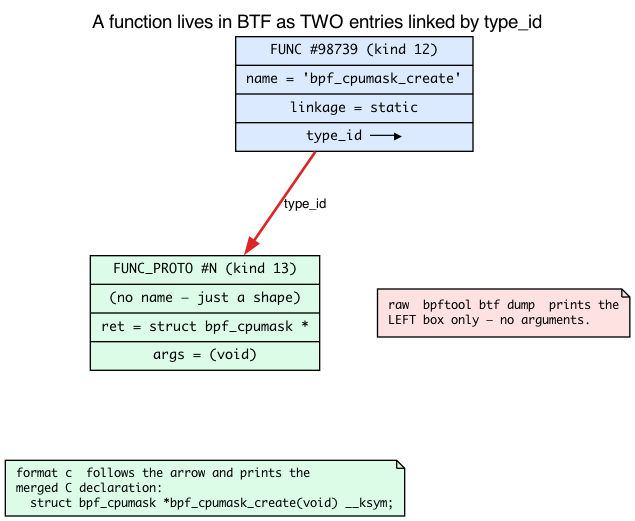
What format c does that the raw dump can’t
So reading a signature out of the raw dump means manually chasing type_id from FUNC to FUNC_PROTO and decoding the argument list. Nobody wants to do that. bpftool btf dump ... format c does it for you: it walks the FUNC → FUNC_PROTO link, resolves every argument and the return type, and reconstructs a complete C declaration —
extern struct bpf_cpumask *bpf_cpumask_create(void) __weak __ksym;
— which is almost exactly what you’d paste into your BPF source. (format c decorates every kfunc with extern ... __weak __ksym — more on that decoration below; for now, note that you can copy the line verbatim, or drop __weak if you want a hard dependency that fails the load when the kfunc is absent.) That resolution step is why format c is the right tool for reading signatures and the raw dump is not. (Note: Day 3 ran the raw dump on parent.bpf.o to inspect a small program’s own BTF; the format c reconstruction is the new tool today.) You can see both forms side by side:
sudo bpftool btf dump file /sys/kernel/btf/vmlinux | head -20 # raw: FUNC one-liners, no args
sudo bpftool btf dump file /sys/kernel/btf/vmlinux format c | head -30 # resolved: full C header
Three approaches to finding a kfunc
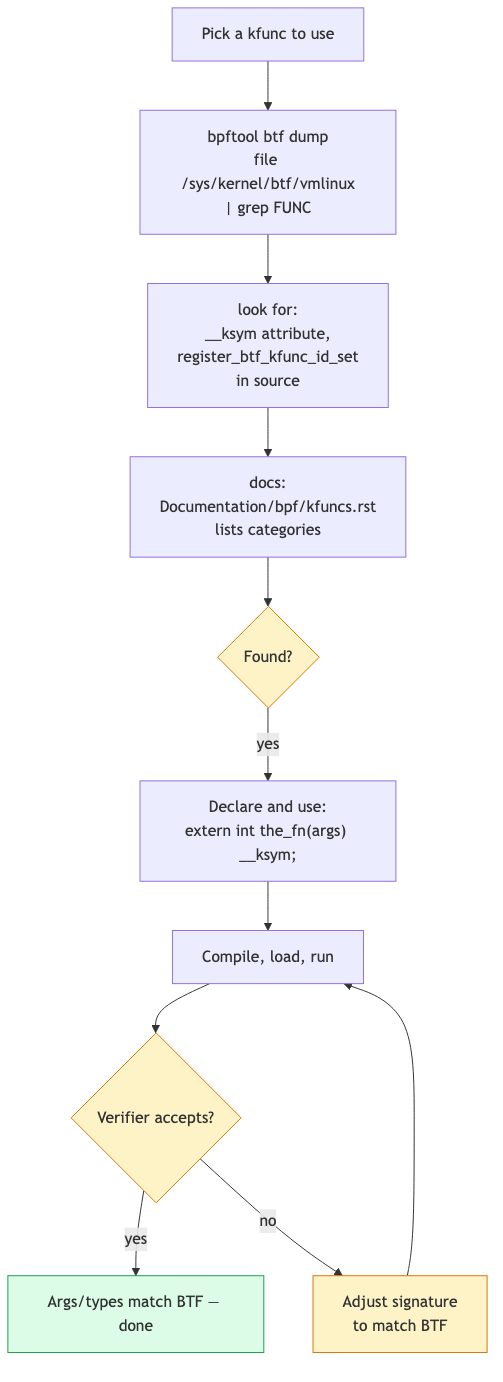
1. Search kernel source for BTF_KFUNCS_START
Each kfunc family is declared in a block:
cd ~/code/linux
grep -rn 'BTF_KFUNCS_START' kernel/bpf net/ drivers/ 2>/dev/null
You’ll see ~30+ hits. Each block looks like:
BTF_KFUNCS_START(generic_kfunc_set)
BTF_ID_FLAGS(func, bpf_obj_new_impl, KF_ACQUIRE | KF_RET_NULL)
BTF_ID_FLAGS(func, bpf_obj_drop_impl, KF_RELEASE)
BTF_ID_FLAGS(func, bpf_refcount_acquire_impl, KF_ACQUIRE)
BTF_ID_FLAGS(func, bpf_list_push_front_impl)
/* ... */
BTF_KFUNCS_END(generic_kfunc_set)
This tells you what kfuncs exist and their flags (KF_ACQUIRE, KF_RELEASE, KF_RCU, KF_TRUSTED_ARGS, etc.). Kernel source is the source of truth.
2. Dump kernel BTF and search for FUNC entries
sudo bpftool btf dump file /sys/kernel/btf/vmlinux \
| grep "FUNC 'bpf_" | head -20
The raw (non-format c) dump prints each function as a single line with the name in single quotes and no args (recall: the args live in the FUNC_PROTO that type_id= points at):
[98739] FUNC 'bpf_address_lookup' type_id=59431 linkage=static
[98740] FUNC 'bpf_adj_branches' type_id=59432 linkage=static
[98744] FUNC 'bpf_arch_text_copy' type_id=59434 linkage=static
...
This filters all FUNC BTF kinds whose name starts with bpf_ — on this kernel there are ~1700 of them. Many are kfuncs; many are helpers; many are internal kernel functions exposed for other reasons. To narrow down to actual kfuncs, cross-reference with the source method (the BTF_KFUNCS_START blocks) — or, on a kernel whose pahole emitted decl_tag_kfuncs, the kfunc FUNCs carry a decl-tag you can spot. (If you prefer JSON, bpftool btf dump -j ... | grep '"name":"bpf_' matches the name key instead — note the compact JSON has no space after the colon.)
3. Documentation
Documentation/bpf/kfuncs.rst lists categories: cpumask, dynptr, lists, refcount, task, etc. Get the names from there, then look up signatures in BTF for the latest details. The doc is a useful tour map but not an inventory.
Reading a kfunc signature from BTF
Once you have a name (say, bpf_cpumask_create), get the signature with format c, which resolves the FUNC → FUNC_PROTO link for you:
sudo bpftool btf dump file /sys/kernel/btf/vmlinux format c \
| grep -B2 -A5 'bpf_cpumask_create'
Output:
extern struct bpf_cpumask *bpf_cpumask_create(void) __weak __ksym;
That’s what you’d write in your BPF source (drop __weak if you want a hard dependency — see below).
For more complex signatures (multiple args, struct returns), use the same format c approach:
sudo bpftool btf dump file /sys/kernel/btf/vmlinux format c \
| grep 'bpf_dynptr_from_skb('
extern int bpf_dynptr_from_skb(struct __sk_buff *s, u64 flags, struct bpf_dynptr *ptr__uninit) __weak __ksym;
Don’t read those args from the raw dump — the FUNC line has no adjacent arg block. For the definitive signature, read the __bpf_kfunc int bpf_dynptr_from_skb(...) definition in net/core/filter.c (net/core/filter.c:12176) — it matches the format c output above, argument for argument.
__weak __ksym: the kfunc might not be there
You’ll have noticed that every declaration format c printed — bpf_cpumask_create, bpf_dynptr_from_skb, all of them — ends in __weak __ksym, not just __ksym. That’s not per-kfunc: bpftool marks every kfunc weak by default. It can do this precisely because pahole’s decl_tag_kfuncs (the version-gated feature from earlier) tags which FUNC entries are kfuncs, so bpftool emits the safe weak form uniformly. The decoration is a tool default, not a property of any one kfunc. But what __weak __ksym means is genuinely new and worth a section — and it’s also what tells you when you’d want to drop the __weak and ask for a hard __ksym instead.
Recall from Day 20: plain __ksym is a hard dependency. The macro expands to __attribute__((section(".ksyms"))) (tools/lib/bpf/bpf_helpers.h:192); it tells libbpf “resolve this name against the running kernel’s BTF.” If the name doesn’t resolve, libbpf aborts the entire BPF_PROG_LOAD. No silent miss — the load fails.
__weak __ksym downgrades that to a soft dependency. __weak is just the toolchain’s __attribute__((weak)) (tools/lib/bpf/bpf_helpers.h:60-61). Combined with __ksym, it changes libbpf’s relocation behavior: an unresolved weak ksym resolves to address 0 (NULL) instead of failing the load. The program loads either way — on a kernel that has the kfunc, the symbol points at the kfunc; on a kernel that lacks it, the symbol is NULL.
That NULL is the catch. Because the symbol can be NULL at runtime, you must guard the call site yourself — the verifier won’t save you from calling through a NULL weak ksym:
extern int bpf_some_kfunc(...) __weak __ksym;
if (bpf_some_kfunc) /* skip the call when the kfunc is absent */
bpf_some_kfunc(...);
This is the mechanism behind “compile once, run on kernels with different kfunc availability”: the same .bpf.o loads on a kernel missing the kfunc (the guarded call is skipped) and on one that has it (the call fires). The kernel’s own bpf_helpers.h ships the canonical example — the bpf_iter_num_* family is declared exactly this way:
/* tools/lib/bpf/bpf_helpers.h:345 */
extern int bpf_iter_num_new(struct bpf_iter_num *it, int start, int end) __weak __ksym;
extern int *bpf_iter_num_next(struct bpf_iter_num *it) __weak __ksym;
extern void bpf_iter_num_destroy(struct bpf_iter_num *it) __weak __ksym;
For a stronger guard than a raw NULL check, pair __weak with bpf_core_type_exists(...) (tools/lib/bpf/bpf_core_read.h:240), which tests at load/run time whether a given type exists in the target kernel’s BTF. We use exactly that pattern in today’s Check question.
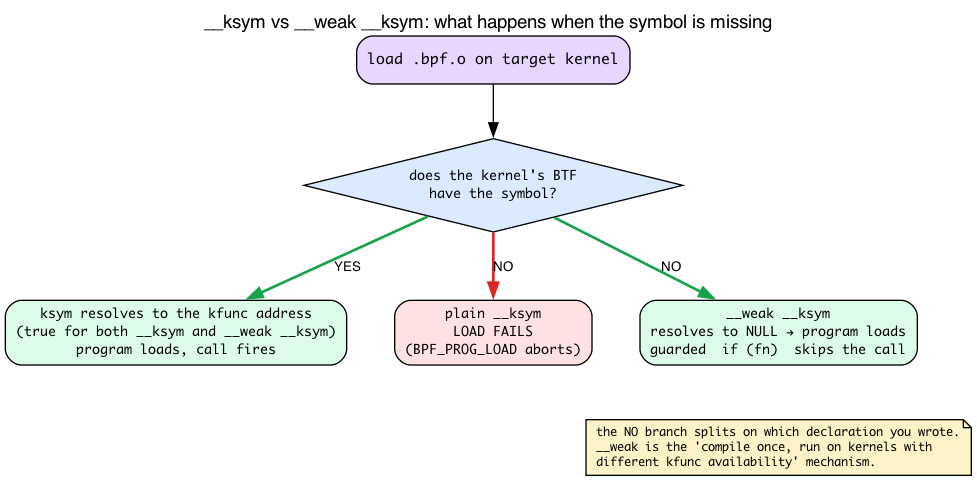
A complete example: bpf_cpumask_*
bpf_cpumask_* is a family of kfuncs for working with CPU masks (one bit per CPU). Useful for: scheduler hints, CPU affinity inspection, sched_ext.
The family is defined at kernel/bpf/cpumask.c. Read the file’s BTF_KFUNCS_START block to see what’s available:
BTF_KFUNCS_START(cpumask_kfunc_btf_ids)
BTF_ID_FLAGS(func, bpf_cpumask_create, KF_ACQUIRE | KF_RET_NULL)
BTF_ID_FLAGS(func, bpf_cpumask_release, KF_RELEASE)
BTF_ID_FLAGS(func, bpf_cpumask_acquire, KF_ACQUIRE)
BTF_ID_FLAGS(func, bpf_cpumask_first, KF_RCU)
BTF_ID_FLAGS(func, bpf_cpumask_setall)
BTF_ID_FLAGS(func, bpf_cpumask_set_cpu)
BTF_ID_FLAGS(func, bpf_cpumask_clear_cpu)
BTF_ID_FLAGS(func, bpf_cpumask_test_cpu)
BTF_ID_FLAGS(func, bpf_cpumask_or, KF_RCU)
BTF_ID_FLAGS(func, bpf_cpumask_equal, KF_RCU)
/* ... */
BTF_KFUNCS_END(cpumask_kfunc_btf_ids)
This block is real: kernel/bpf/cpumask.c:477 opens BTF_KFUNCS_START(cpumask_kfunc_btf_ids), :478 flags bpf_cpumask_create as KF_ACQUIRE | KF_RET_NULL, and :479 flags bpf_cpumask_release as KF_RELEASE. Each entry is a regular C function in the same file. Read the __bpf_kfunc definitions to see what they actually do.
Using them
#include "vmlinux.h"
#include <bpf/bpf_helpers.h>
#include <bpf/bpf_tracing.h>
char LICENSE[] SEC("license") = "GPL";
extern struct bpf_cpumask *bpf_cpumask_create(void) __ksym;
extern void bpf_cpumask_release(struct bpf_cpumask *cpumask) __ksym;
extern void bpf_cpumask_set_cpu(__u32 cpu, struct bpf_cpumask *cpumask) __ksym;
extern bool bpf_cpumask_test_cpu(__u32 cpu, const struct cpumask *cpumask) __ksym;
SEC("fentry/filename_unlinkat")
int BPF_PROG(p)
{
struct bpf_cpumask *m = bpf_cpumask_create();
if (!m)
return 0; /* KF_RET_NULL - must check */
/* Set bits for CPUs 0, 2, 4 */
bpf_cpumask_set_cpu(0, m);
bpf_cpumask_set_cpu(2, m);
bpf_cpumask_set_cpu(4, m);
/* Test some bits */
bool b0 = bpf_cpumask_test_cpu(0, (struct cpumask *)m);
bool b1 = bpf_cpumask_test_cpu(1, (struct cpumask *)m);
bpf_printk("cpu0=%d cpu1=%d", b0, b1);
bpf_cpumask_release(m); /* KF_ACQUIRE -> must release */
return 0;
}
Note the cast (struct cpumask *)m — bpf_cpumask_test_cpu takes the base type (struct cpumask), not the BPF-specific wrapper (bpf_cpumask). The verifier accepts the cast because bpf_cpumask embeds cpumask as its first field, so a bpf_cpumask * and a cpumask * point at the same address. You can see it in the struct definition:
/* kernel/bpf/cpumask.c:25 */
struct bpf_cpumask {
cpumask_t cpumask; /* first field — same address as the wrapper */
refcount_t usage;
};
and bpf_cpumask_test_cpu really does take const struct cpumask * (kernel/bpf/cpumask.c:195: __bpf_kfunc bool bpf_cpumask_test_cpu(u32 cpu, const struct cpumask *cpumask)). The cast is therefore sound, and this idiom shows up across the kfunc family.
Run
The userspace loader (cpumask_demo.c) is the standard skeleton open/load/attach pattern; it attaches the fentry and waits while the program writes to trace_pipe.
#include <errno.h>
#include <signal.h>
#include <stdio.h>
#include <string.h>
#include <unistd.h>
#include <bpf/libbpf.h>
#include "cpumask_demo.skel.h"
static volatile sig_atomic_t exiting;
static void handle_signal(int signal_number)
{
(void)signal_number;
exiting = 1;
}
static int install_signal_handlers(void)
{
const struct sigaction action = {
.sa_handler = handle_signal,
};
if (sigaction(SIGINT, &action, NULL) != 0 ||
sigaction(SIGTERM, &action, NULL) != 0) {
fprintf(stderr, "failed to install signal handlers: %s\n",
strerror(errno));
return -errno;
}
return 0;
}
int main(void)
{
struct cpumask_demo_bpf *skel = NULL;
int err;
setvbuf(stdout, NULL, _IOLBF, 0);
err = install_signal_handlers();
if (err)
return 1;
skel = cpumask_demo_bpf__open();
if (!skel) {
fprintf(stderr, "failed to open cpumask_demo BPF skeleton\n");
return 1;
}
err = cpumask_demo_bpf__load(skel);
if (err) {
fprintf(stderr, "failed to load cpumask_demo BPF programs: %s\n",
strerror(-err));
goto cleanup;
}
err = cpumask_demo_bpf__attach(skel);
if (err) {
fprintf(stderr, "failed to attach cpumask_demo BPF programs: %s\n",
strerror(-err));
goto cleanup;
}
puts("Attached fentry/filename_unlinkat; watch trace_pipe. "
"Press Ctrl-C to detach.");
while (!exiting)
pause();
err = 0;
cleanup:
cpumask_demo_bpf__destroy(skel);
return err != 0;
}
make cpumask_demo
sudo ./.output/day24/cpumask_demo &
touch /tmp/x && rm /tmp/x
sudo cat /sys/kernel/debug/tracing/trace_pipe
Output: cpu0=1 cpu1=0.
What to break
Forget release
struct bpf_cpumask *m = bpf_cpumask_create();
/* ... use ... */
return 0; /* without bpf_cpumask_release */
Verifier rejects: Unreleased reference id=1 alloc_insn=M. bpf_cpumask_create is KF_ACQUIRE; the rules from Day 20 apply.
Use a kfunc not registered for your program type
Try bpf_cpumask_create from an XDP program:
SEC("xdp")
int xdp_prog(struct xdp_md *ctx) {
struct bpf_cpumask *m = bpf_cpumask_create();
/* ... */
}
Verifier rejects: calling kernel function bpf_cpumask_create is not allowed. Check kernel/bpf/cpumask.c’s registration:
register_btf_kfunc_id_set(BPF_PROG_TYPE_TRACING, &cpumask_kfunc_set);
register_btf_kfunc_id_set(BPF_PROG_TYPE_STRUCT_OPS, &cpumask_kfunc_set);
register_btf_kfunc_id_set(BPF_PROG_TYPE_SYSCALL, &cpumask_kfunc_set);
Cpumask is registered for tracing, struct_ops, and syscall — not XDP (verified at kernel/bpf/cpumask.c:526-528). The verifier knows.
Discover a new family
Try bpf_dynptr_*:
sudo bpftool btf dump file /sys/kernel/btf/vmlinux format c | grep 'bpf_dynptr'
You’ll see bpf_dynptr_data, bpf_dynptr_read, bpf_dynptr_write, bpf_dynptr_from_skb, etc. These let BPF programs handle variable-size buffers safely. Try one in a program; the kfunc family is a good way to learn the dynptr pattern (a verifier-tracked variable-size pointer). And you can read each one’s full signature straight from BTF.
There are no Dumb Questions
Q: The raw dump shows
type_id=59431. Can I just dump entry 59431 directly to see the args?A: Yes —
bpftool btf dump file /sys/kernel/btf/vmlinux | grep '^\[59431\]'shows the FUNC_PROTO and its argument entries. But it’s a chase: the FUNC_PROTO’s arguments are themselvestype_idreferences to other entries (a PTR to a STRUCT, an INT, …), so you’d be hand-walking a graph.format cwalks it for you and prints C. Use the raw dump to find a function by name; useformat cto read its signature.Q: Why does BTF split FUNC from FUNC_PROTO at all? Why not store the args next to the name?
A: Deduplication. Two functions with the same signature (
void f(int)andvoid g(int)) can share one FUNC_PROTO entry — only the FUNC entries (name + linkage + atype_id) differ. Since the kernel has thousands of functions and far fewer distinct shapes, the split shrinks the BTF blob. It’s the same dedup principle that lets onestruct task_structBTF entry back every pointer to a task.Q: If
__weak __ksymresolves a missing kfunc to NULL, why doesn’t the verifier just reject the program for a possible NULL call?A: Because at load time on a kernel that has the kfunc, the symbol is a valid address, and your guarded
if (bpf_some_kfunc)is provably true on that path — there’s nothing to reject. On a kernel that lacks it, the symbol is NULL but your guard skips the call. The verifier checks the program against the target kernel’s reality, and the guard is what makes both realities valid. Drop the guard and you’re on your own.
What to read in the kernel
-
Documentation/bpf/kfuncs.rst— the official tour. Read end to end. ~10 pages. -
kernel/bpf/cpumask.c— full kfunc family in one file (~700 lines). Read top to bottom. The structure is:- Implementation —
__bpf_kfuncfunctions. - ID list —
BTF_KFUNCS_STARTblock (:477). register_btf_kfunc_id_setcalls at module init (:526-528).
This is the template for adding kfuncs. If you ever want to add one, this is what your patch will look like.
- Implementation —
-
kernel/bpf/helpers.c— searchBTF_KFUNCS_START. The biggest set of generic kfuncs (generic_btf_idsat:4703,common_btf_idsat:4776). Skim to know the catalog. -
kernel/sched/ext.c— sched_ext registers many sched-specific kfuncs. The eBPF book’s Day 25–27 use these. -
tools/lib/bpf/btf.c— userspace BTF library. Thebtf__find_by_name_kindfunction (:1166) is what libbpf uses to resolve__ksymreferences against BTF at load time — it’s literally how a name likebpf_cpumask_createbecomes a FUNC entry, which then leads (viatype_id) to its FUNC_PROTO. -
include/uapi/linux/btf.h—struct btf_type(:43), theBTF_KIND_*constants (FUNC:85, FUNC_PROTO:86), theBTF_INFO_KINDmacro (:68), andenum btf_func_linkage(:169-172). The vocabulary of BTF. (include/linux/btf.his the in-kernel companion with the helper API.) -
bpftoolsource attools/bpf/bpftool/btf.c— useful to read just to learn what BTF queries are easy from the CLI, including howformat creconstructs declarations.
Bullet Points
- BTF is a build artifact: the kernel is compiled with DWARF, then
paholeemits the.BTFsection linked intovmlinuxand exposed at/sys/kernel/btf/vmlinux— gated byCONFIG_DEBUG_INFO_BTF(modules:CONFIG_DEBUG_INFO_BTF_MODULES). Trust it as ground truth. - A function is two BTF entries. A
BTF_KIND_FUNC(kind 12) holds the name +linkage+ atype_id; thetype_idpoints at a separateBTF_KIND_FUNC_PROTO(kind 13) that holds the return type and argument types. The raw dump shows only the FUNC line (no args);format cfollows the link and prints a full C declaration. - Discover kfuncs via: kernel source
BTF_KFUNCS_STARTblocks,bpftool btf dump, orDocumentation/bpf/kfuncs.rst. - Signatures come from BTF; read them with
bpftool btf dump file ... format cand declare in BPF code withextern T name(args) __ksym;. __ksymis a hard dependency (load fails if unresolved);__weak __ksymis a soft one (unresolved → NULL, program still loads) — so you must guard the call site. This is how one.bpf.oruns across kernels with different kfunc availability.- Acquire/release semantics from Day 20 apply uniformly — every kfunc family follows the same model.
- Per-program-type registration: not all kfuncs are everywhere; the verifier rejects unregistered combinations (cpumask: tracing/struct_ops/syscall, not XDP).
- The kernel’s kfunc set grows release-by-release; check
bpftool feature probefor what’s available.
Check question
You write extern int my_fn(int x) __ksym; and reference my_fn. The kernel doesn’t have a kfunc by that name. What happens at compile time vs at load time?
Click to reveal answer
Answer: Compile time succeeds. The __ksym attribute is a marker for libbpf, not a compile-time check; the C compiler treats extern as “this exists somewhere.” The reference compiles fine into a relocation entry in the .bpf.o file (saying “I need a symbol named my_fn”) — recorded in your object’s BTF as an extern-linkage FUNC.
At load time, libbpf fails: libbpf: cannot find kernel BTF type ID of 'my_fn'. libbpf walks the program’s relocations, looks up each __ksym reference against the running kernel’s BTF (via btf__find_by_name_kind), and aborts if the name doesn’t resolve.
This is the right design: __ksym references are resolved at runtime against the target kernel’s BTF, not at compile time against the build kernel. That’s how you compile once and run on multiple kernels with potentially different kfunc availability — a kernel that has the kfunc loads your program; a kernel that doesn’t returns the descriptive error.
For graceful degradation across kernel versions, combine the __weak __ksym form with bpf_core_type_exists() checks: declare the kfunc weak so an absent symbol resolves to NULL instead of failing the load, then test at runtime whether it (or a type it needs) is available and skip the call if not. That’s the full “load everywhere, call only where supported” pattern — the same shape the kernel uses for its own bpf_iter_num_* family.
End of Phase 4
You can now use kfuncs, store kptrs in maps, write struct_ops modules, instrument them with ringbuf, and discover new kfuncs by reading BTF and degrading gracefully with __weak __ksym when a kfunc might be absent. That’s the modern BPF surface as of 2026.
Phase 5 (Days 25–30) is the frontier — sched_ext, BPF schedulers, and a capstone project.
Tomorrow
Day 25: sched_ext. We leave tracing behind and start steering the kernel — writing a scheduler in BPF via struct_ops, calling the sched-specific kfuncs registered in kernel/sched/ext.c that you can now discover and read straight from BTF.
Day 25 — sched_ext: a BPF scheduler
Today’s mission: load
scx_simpleon your system, watch it actually scheduling tasks, understand the enqueue/dispatch cycle, and see why this is the most ambitious BPF feature shipped to date. Along the way you’ll learn what a CPU scheduler even is — task states, time slices, preemption, context switches — and what “fairness” means underneath CFS, so the whole chapter stops being vocabulary you nod along to. Total time: ~100 minutes.
Phase 5 starts here. Days 25–30 are about the frontier. You’ll run a BPF scheduler, modify it, then build a capstone project of your choosing. By Day 30, you’ve shipped one substantial piece of BPF work.
What sched_ext is
The Linux scheduler decides which task runs on which CPU at which time. Until 2024, this logic lived entirely inside the kernel — kernel/sched/fair.c (the CFS implementation), with policy hardcoded. Changing scheduling required a kernel patch, kernel rebuild, reboot, and hope that you didn’t break things in subtle ways.
sched_ext (merged into 6.12, October 2024) makes the scheduler pluggable via BPF. You write a struct_ops module against struct sched_ext_ops. Loading it activates your scheduler. Unloading it reverts to CFS.
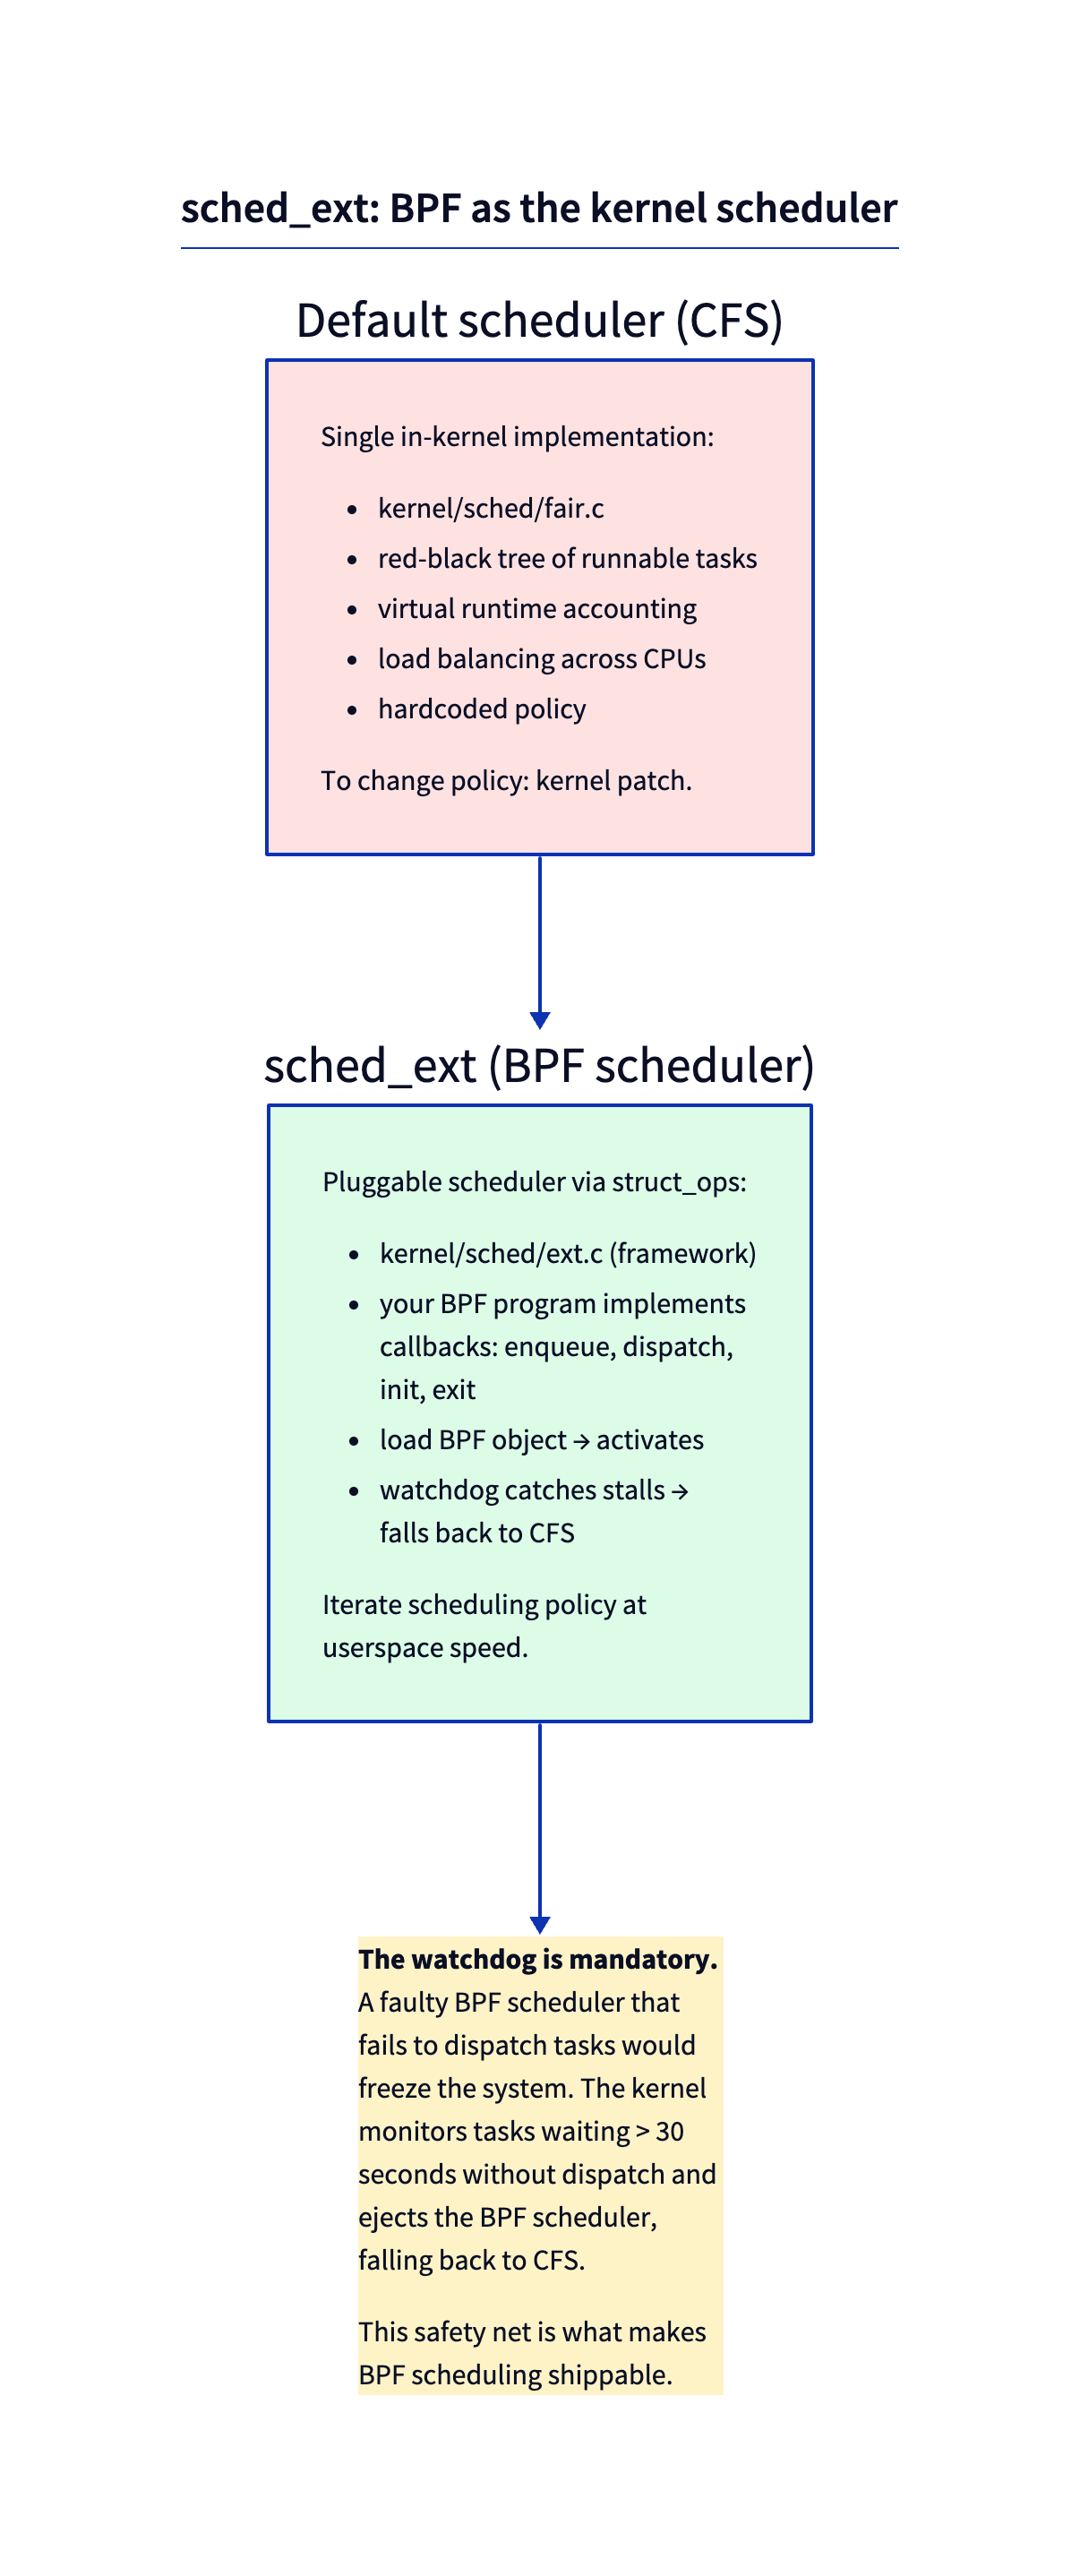
This is qualitatively different from previous BPF features. Tracing programs observe. Networking programs filter. sched_ext programs make scheduling decisions — the most performance-critical, ultra-hot-path code in the kernel.
The motivation: scheduling policy isn’t one-size-fits-all. Cloud workloads want fairness across cgroups; HFT wants latency at all costs; mobile wants energy minimization; gaming wants frame-time stability. Each has been argued for in academic papers and tested in research kernels. Sched_ext lets researchers and operators iterate on scheduling policy at userspace velocity — change BPF code, rebuild in seconds, load, measure, iterate.
Quick refresher (from Phase 4, “Modern primitives”): a struct_ops is a BPF object whose programs fill in a kernel vtable — a struct of function pointers the kernel calls at the right moments. Loading and attaching the struct_ops link installs your callbacks. sched_ext is just struct_ops where the vtable happens to be
struct sched_ext_ops(kernel/sched/ext_internal.h:292) and “attach” means “become the system scheduler” (the install path isscx_enable(struct sched_ext_ops *ops, struct bpf_link *link)atkernel/sched/ext.c:7447). Everything you already know about struct_ops — the vtable, BTF, link attachment — applies unchanged.
First, what a scheduler actually does
The rest of this chapter throws words like runnable, blocked, time slice, preempted, and context switch at you constantly. If those are fuzzy, sched_ext will feel like magic. They aren’t magic — they’re a tiny state machine. Let’s nail it down first; it pays off immediately.
Every task is in one of three situations
A task (a thread — the kernel’s unit of scheduling, one struct task_struct each) is always in exactly one of these:
- Running — it is right now executing on some CPU.
- Runnable — it is ready to run and just waiting for a CPU to become free. Nothing is stopping it except that there are more runnable tasks than CPUs.
- Blocked (sleeping) — it is waiting for something before it can make progress: a disk read to finish, a lock to be released, a timer to fire, a packet to arrive. It is not a candidate for the CPU at all until that something happens.
Here is the subtlety the kernel encodes, and you should internalize it: “running” and “runnable” are the same kernel state. Both are TASK_RUNNING:
/* include/linux/sched.h:107 */
#define TASK_RUNNING 0x00000000
#define TASK_INTERRUPTIBLE 0x00000001 /* sched.h:108 — blocked, wakeable by signals */
#define TASK_UNINTERRUPTIBLE 0x00000002 /* sched.h:109 — blocked, not signal-wakeable */
A TASK_RUNNING task is “schedulable” — it belongs in the scheduler’s pool of candidates, whether or not it has a CPU at this instant. A blocked task is TASK_INTERRUPTIBLE (can be woken by a signal — e.g. read() on a pipe) or TASK_UNINTERRUPTIBLE (must wait for the exact event — e.g. a disk I/O), and the scheduler simply ignores it. It isn’t picked again until its wait condition is satisfied and the kernel flips it back to TASK_RUNNING — that flip is a wakeup.
There are no Dumb Questions
Q: If “running” and “runnable” are the same
TASK_RUNNINGstate, how does the kernel know which tasks are actually on a CPU right now?A: That’s tracked separately. Each CPU’s runqueue records its currently-running task in
rq->curr.TASK_RUNNINGonly means “eligible to run” — being on a CPU is a property of the runqueue, not of the task’s state field. So the state machine has three task states but only two task-state values, and the CPU-occupancy bit lives elsewhere.
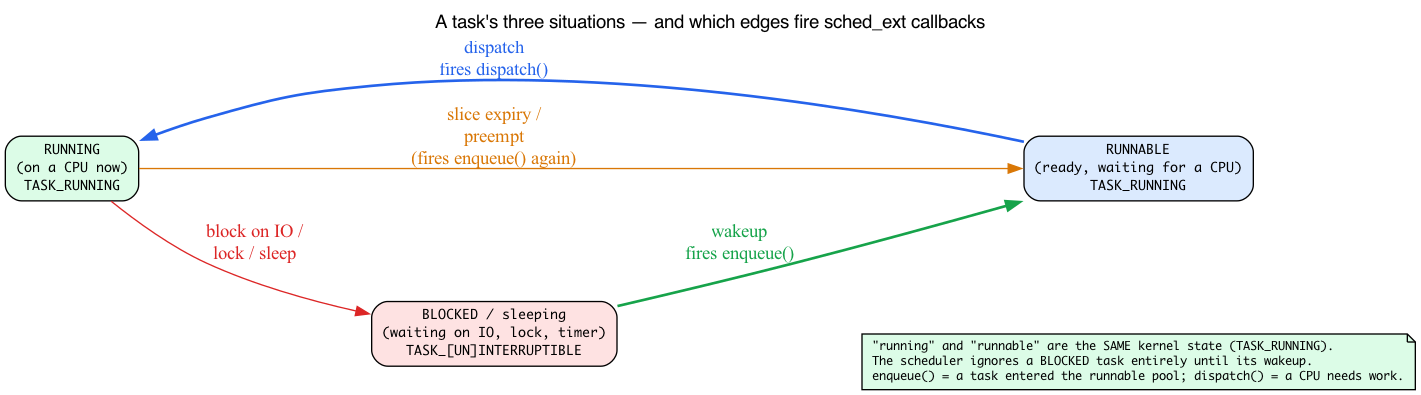
The scheduler’s job, in one sentence
Of the set of runnable tasks, the scheduler picks which one runs on each CPU, and for how long.
That “how long” is the time slice — a budget of CPU time. When a task’s slice expires, the kernel preempts it: yanks it off the CPU (even though it would happily keep running), drops it back into the runnable pool, and re-picks. Preemption is what keeps one CPU-hog from freezing everyone else — without it a busy loop would own a core forever.
The act of taking task A off a CPU and putting task B on is a context switch: save A’s registers, program counter, and stack pointer; load B’s. It’s the physical transition the scheduler causes. It isn’t free (you pay cache and TLB costs), which is why schedulers don’t switch on every nanosecond.
The two events a scheduler must handle
Boil all of the above down and a scheduler really only reacts to two moments:
- A task enters the runnable pool (it was just created, just woke from I/O, or was just preempted). Something has to decide where it goes and with what slice. This is enqueue.
- A CPU finishes with its current task (the task blocked, or used up its slice) and needs the next one. Something has to hand it a task. This is dispatch.
That enqueue → dispatch cycle is the entire skeleton of a scheduler, and — you guessed it — it’s exactly the two callbacks sched_ext makes you implement. “Wakes up from I/O” now reads precisely: a blocked task’s wait condition was satisfied, the kernel flips it to TASK_RUNNING, and that wakeup is what fires select_cpu/enqueue to re-place it.
Where sched_ext hangs its per-task data
Each task already carries its scheduling bookkeeping inside struct task_struct. sched_ext bolts its own per-task data on through an embedded member:
/* include/linux/sched.h:876, inside task_struct */
struct sched_ext_entity scx;
So when scx_simple reads p->scx.dsq_vtime, it’s reading a field the kernel keeps per task, right there in the task structure:
/* include/linux/sched/ext.h:231, inside struct sched_ext_entity */
u64 dsq_vtime;
Hold onto dsq_vtime — the next section explains what that number means.
What “fairness” means: CFS and virtual runtime
The scheduler sched_ext replaces (and reverts to on unload) is CFS, the Completely Fair Scheduler, implemented in kernel/sched/fair.c. The chapter will keep saying “falls back to CFS,” “CFS’s fair-share guarantees,” and “vtime-ordered.” You can’t evaluate any of that without knowing CFS’s one big idea.
The idea: charge every task for the CPU time it uses
Imagine you want N runnable tasks to each get a fair, equal share of a CPU. The naive approach — round-robin fixed slices — falls apart the moment tasks have different priorities or sleep at different times.
CFS’s trick is virtual runtime (vruntime): each task accumulates a running tally of how much CPU it has consumed, scaled by its priority/weight.
/* include/linux/sched.h:594, per scheduling entity */
u64 vruntime;
The fairness intuition is simple: a task that has run a lot has a high vruntime, so it sinks to the back; a task that has barely run has a low vruntime, so it floats to the front. Over time everyone’s consumed time stays roughly equal — that is what “fair” means.
The exact selection algorithm in this kernel is a refinement of that intuition. Since 6.6 the fair class is EEVDF (the file is still kernel/sched/fair.c and the class is still called CFS, but the picking logic changed). The runqueue’s red-black tree (cfs_rq->tasks_timeline at kernel/sched/sched.h:695) is ordered by each entity’s virtual deadline, not its raw vruntime: entity_before() (fair.c:589) compares deadlines and __entity_less (fair.c:974) builds the tree on that. Selection is pick_eevdf() (fair.c:1136), which walks for the leftmost eligible entity (entity_eligible(), fair.c:939) — eligibility roughly meaning the task hasn’t yet consumed more than its fair share. So it’s selection-by-deadline-among-eligible, not literally “smallest vruntime wins” (that was the pre-6.6 CFS rule). The fairness outcome is the same — a CPU hog earns a later deadline and becomes ineligible, sinking to the back — which is the intuition you should hold onto.
Why new and just-woken tasks don’t get a free lunch — or a penalty
What vruntime does a brand-new task get? Or a task that just woke after sleeping for a minute? If it started at 0, it would have a much smaller vruntime than everyone else and would hog the CPU until it caught up. If it inherited its old stale value, a task that slept a long time would be penalized for sleeping.
EEVDF splits the difference: a new or just-woken task is placed around the runqueue’s weighted-average virtual time, computed by avg_vruntime() (kernel/sched/fair.c:780), with a lag adjustment (the PLACE_LAG path in place_entity(), kernel/sched/fair.c:5381) so the task keeps its prior virtual lag rather than being reset to a floor:
/* kernel/sched/sched.h:687, the runqueue's virtual-time zero-point */
u64 zero_vruntime;
The runqueue’s virtual-time zero-point is cfs_rq->zero_vruntime, and placement uses the weighted average avg_vruntime() — not the minimum. Placing a newcomer at the average means it gets to run soon but can’t hoard the CPU by having been idle (placing it at the minimum would hand a long-sleeper an unfair head start, which EEVDF deliberately avoids). This is exactly mirrored later when scx_simple clamps an idling task’s budget so a long-sleeping task can’t accumulate unlimited priority.
Watch the names: the per-task
min_vruntimeatinclude/linux/sched.h:580is a different thing. It lives insidestruct sched_entity(which opens at line 575), where it’s the augmented-rbtree subtree minimum used by the deadline tree — not a runqueue-wide floor. The classic per-runqueuecfs_rq->min_vruntimefloor was removed in the EEVDF rework;struct cfs_rq(kernel/sched/sched.h:678) has nomin_vruntimemember anymore.
sched_ext’s vtime-ordered DSQ is the same trick
A sched_ext dispatch queue can be ordered two ways, and the kernel header says so plainly:
/* include/linux/sched/ext.h:76 */
* A dispatch queue (DSQ) can be either a FIFO or p->scx.dsq_vtime ordered
A FIFO DSQ is just a queue — first in, first out, no notion of fairness. A vtime-ordered DSQ keeps its tasks sorted by their dsq_vtime key, in a red-black tree, the same structure CFS uses:
/* include/linux/sched/ext.h:85 */
struct rb_root priq; /* used to order by p->scx.dsq_vtime */
You insert with scx_bpf_dsq_insert_vtime(..., vtime, ...), the queue stays sorted, and dispatch pulls the lowest vtime — reinventing CFS fairness in BPF. This is also why a built-in FIFO DSQ like SCX_DSQ_GLOBAL can’t be used as a vtime priority queue (you’ll see this note again below): a FIFO has no ordering key to sort on.
This is exactly why the vtime=0 breakage is a breakage
Later you’ll deliberately set every task’s vtime to 0 and watch interactivity collapse. Now you can see why: with all vtime equal, the ordering is meaningless. A CPU-bound compute hog and a keystroke-waiting editor look identical to the queue, so the hog is never sunk to the back and the editor never floats to the front. That’s precisely the unfairness vruntime was invented to prevent.
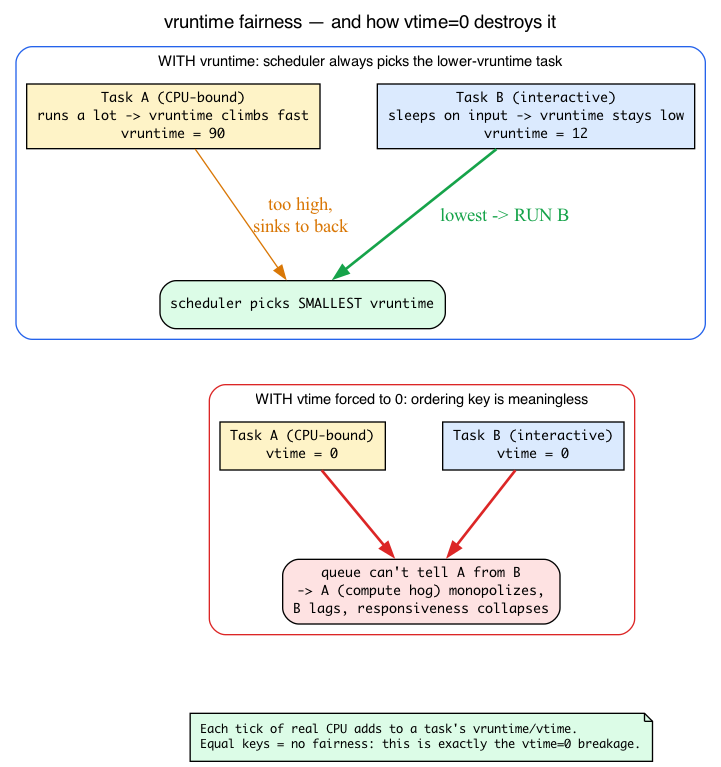
The watchdog: what makes this safe
A faulty BPF scheduler that fails to dispatch tasks could freeze the system. The kernel catches this:
- Dispatch stall watchdog. If any task stays runnable but undispatched past the stall timeout, the kernel concludes the BPF scheduler is broken, ejects it, and re-enables CFS. The timeout defaults to 30 seconds (
SCX_WATCHDOG_MAX_TIMEOUT = 30 * HZ) and can be tightened viaops.timeout_ms— but never lengthened past 30 seconds (the kernel caps it). - Fallback to CFS. Recovery is automatic — worst case, up to a 30-second freeze, then back to normal CFS.
This safety net is what makes sched_ext shippable. Without it, no one would risk loading user code into the scheduler hot path.
Where “30 seconds” comes from: HZ and jiffies
The constant is written 30 * HZ, not 30. To read kernel timing code you need two units:
- HZ is the kernel’s timer-tick frequency — how many scheduler/timer ticks happen per second.
- A jiffy is one tick. So a duration of N seconds is
N * HZjiffies. Kernel timeouts are very often expressed this way.
On this kernel:
/* ~/code/linux/.config:542 */
CONFIG_HZ=1000
So HZ = 1000, and 30 * HZ = 30000 jiffies = 30 seconds:
/* kernel/sched/ext_internal.h:14 */
SCX_WATCHDOG_MAX_TIMEOUT = 30 * HZ,
That’s the literal derivation behind the “30 seconds” the watchdog enforces — no black box. Whenever you see a kernel constant written as N * HZ, mentally divide by CONFIG_HZ to get seconds.
The core cycle: enqueue → DSQ → dispatch
Every BPF scheduler implements callbacks for two main events — the same enqueue/dispatch pair we derived above.
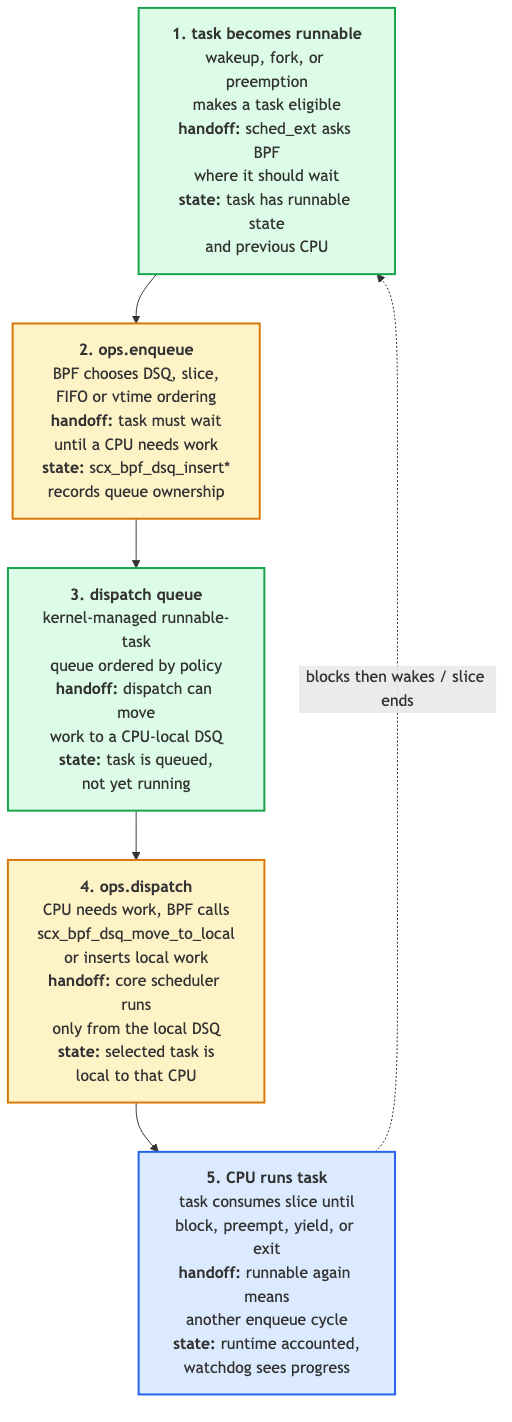
enqueue(task, flags)
A task becomes runnable (it just woke up from I/O, was created, or was preempted — i.e. it just entered the TASK_RUNNING pool). The BPF scheduler decides where to put it — on which DSQ (Dispatch Queue), in what order, with what slice (time budget).
dispatch(cpu, prev)
A CPU has nothing to run (its current task blocked or used up its slice). The BPF scheduler decides which task to give it — typically by pulling from a DSQ.
select_cpu(p, prev_cpu, wake_flags)
When a task wakes up, this callback decides which CPU to wake it on. Optional; defaults to “the CPU it last ran on, with some adjustments.”
Other callbacks
init, exit, running, stopping, update_idle, cpu_release, set_cpumask — all defined in struct sched_ext_ops (kernel/sched/ext_internal.h:292). The full vtable has ~37 callbacks; most BPF schedulers implement only 4–8 of them and let CFS-equivalent defaults handle the rest.
DSQs (Dispatch Queues)
DSQs are kernel-managed queues that hold runnable tasks waiting to be dispatched. You don’t implement them; you consume an API:
scx_bpf_dsq_insert(p, dsq_id, slice, flags)— enqueue taskponto the FIFO DSQ identified bydsq_id, with time sliceslice(ns).scx_bpf_dsq_insert_vtime(p, dsq_id, slice, vtime, flags)— enqueue taskpinto a vtime-ordered DSQ (the fairness mechanism from the CFS section: the queue stays sorted byvtime).scx_bpf_dsq_move_to_local(dsq_id, flags)— move the next task from a DSQ to the current CPU’s local DSQ; called fromdispatchto make a task runnable locally.scx_bpf_create_dsq(id, node)— create a new DSQ with the given numeric id, on NUMA nodenode. (NUMA node: on multi-socket machines, memory is physically attached to a particular CPU socket — a “node”; creating the DSQ on a given node keeps its memory local to the CPUs that use it.scx_simplepasses-1for “any node.”)
Built-in DSQs:
SCX_DSQ_GLOBAL— single shared queue, all CPUs pull from it. (Note: a built-in DSQ likeSCX_DSQ_GLOBALcannot be used as a vtime priority queue — you can’tscx_bpf_dsq_insert_vtimeinto it, because a FIFO has no ordering key. That’s whyscx_simplecreates its own custom shared DSQ instead; see below.)SCX_DSQ_LOCAL— per-CPU queue. Each CPU has its own.
Custom DSQs (created via scx_bpf_create_dsq) let you implement more complex policies: per-cgroup queues, priority queues, NUMA-local queues, etc.
The lab — run scx_simple
scx_simple is the “hello world” of sched_ext: a BPF scheduler that dispatches everything to a single shared queue. (scx_simple creates its own DSQ rather than SCX_DSQ_GLOBAL — see the DSQ section for why a built-in FIFO can’t be vtime-ordered.)
Repo lab: build and run the exact upstream scheduler
The book’s lab doesn’t reimplement scx_simple — Day 25 is about running the
unmodified in-tree example. make -C ebpf/labs day25 builds it straight from
the locked Linux v7.1 tree with the kernel’s own tools/sched_ext Makefile,
sending every artifact under .output/ so the pinned source stays clean:
Day 25 build wrapper: build the EXACT upstream scx_simple from the locked
Linux v7.1 source tree, using the kernel’s own tools/sched_ext Makefile.
Nothing here is repo-owned scheduler code: the point of Day 25 is to run the
unmodified in-tree example. O= redirects every build artifact into
.output/day25/build so the pinned kernel source tree is never written to.
set -euo pipefail
HERE=$(cd – “$(dirname – “${BASH_SOURCE[0]}”)“ && pwd) ROOT=$(cd – “$HERE/..” && pwd)
SRC=$(“$ROOT/scripts/linux-source.sh” path) # verified locked v7.1 tree OUT=“$ROOT/.output/day25” VMLINUX_H=$(“$ROOT/scripts/kernel-btf.sh” sched-ext) BPFTOOL=$(“$ROOT/scripts/linux-bpftool.sh”)
mkdir -p “$OUT”
make -C “$SRC/tools/sched_ext” O=“$OUT”
BPFTOOL=“$BPFTOOL” VMLINUX_BTF=“$VMLINUX_H” VMLINUX_H=“$VMLINUX_H”
scx_simple
The kernel Makefile emits scheduler binaries under build/bin/.
BIN=“$OUT/build/bin/scx_simple” test -x “$BIN” printf ‘day25: built upstream %s\n’ “$BIN”
run.sh is the opt-in, self-cleaning runner: it loads that binary for a bounded
interval on a disposable sched_ext-capable VM, then ejects it so CFS is restored:
Day 25 opt-in runner: load the exact upstream scx_simple, let it schedule the
whole machine for a bounded interval, then eject it cleanly.
sched_ext replaces the live CPU scheduler, so this is deliberate: it refuses
to run without EBPF_LABS_ALLOW_PRIVILEGED=1 and root, bounds the run with a
timeout, and a trap SIGINTs the scheduler on any exit so CFS is restored.
Run it only on a disposable, sched_ext-capable VM.
set -euo pipefail
HERE=$(cd – “$(dirname – “${BASH_SOURCE[0]}”)“ && pwd) ROOT=$(cd – “$HERE/..” && pwd) SCHED=“$ROOT/.output/day25/build/bin/scx_simple” DURATION=${DURATION:-10} SCHED_PID=
fail() { printf ‘day25 run: %s\n’ “$*” >&2; exit 1; }
cleanup() { local status=$? trap - EXIT INT TERM if [[ -n $SCHED_PID ]] && kill -0 “$SCHED_PID” 2>/dev/null; then kill -INT “$SCHED_PID” 2>/dev/null || true wait “$SCHED_PID” 2>/dev/null || true fi exit “$status” } trap cleanup EXIT INT TERM
[[ ${EBPF_LABS_ALLOW_PRIVILEGED:-0} == 1 ]] || fail ‘set EBPF_LABS_ALLOW_PRIVILEGED=1 to acknowledge replacing the live scheduler’ [[ ${EBPF_LABS_ALLOW_SCHED_EXT:-0} == 1 ]] || fail ‘set EBPF_LABS_ALLOW_SCHED_EXT=1 to acknowledge replacing the live scheduler’ (( EUID == 0 )) || fail ‘run with sudo after setting both acknowledgement variables’ [[ -x $SCHED ]] || fail “missing $SCHED; run scripts/build-day.sh day25 first” [[ -r /sys/kernel/sched_ext/state ]] || fail ‘kernel has no sched_ext support’
“$SCHED” & SCHED_PID=$! sleep 1 kill -0 “$SCHED_PID” 2>/dev/null || fail ‘scheduler exited early (see its output above)’
printf ‘day25 run: scx_simple active for %ss; state=%s\n’
“$DURATION” “$(cat /sys/kernel/sched_ext/state)”
sleep “$DURATION”
printf ‘day25 run: stopping; sched_ext state should return to disabled\n’
The rest of this section is the same thing done by hand, so you can watch each step.
Build
cd ~/code/linux/tools/sched_ext
make
ls build/bin
# scx_central scx_cpu0 scx_flatcg scx_pair scx_qmap scx_sdt scx_simple scx_userland
Note: the compiled scheduler binaries are emitted under build/bin/, not in the source directory — a bare ls in tools/sched_ext shows the .c/.bpf.c (and a few .h) sources, the Makefile, Kconfig, README.md, include/, and the build/ directory.
Run
sudo ./build/bin/scx_simple
Output (the line reprints about once per second with cumulative counts that climb under load):
local=842 global=58
local=1577 global=141
local counts tasks dispatched straight to a CPU’s local DSQ (because select_cpu found an idle CPU for them); global counts tasks that went through the shared, vtime-ordered DSQ via ops.enqueue. On a busy system global is normally non-zero. That climbing counter is the proof tasks are flowing through scx_simple’s enqueue/dispatch cycle.
These two counters live in a per-CPU map. Recall per-CPU maps from the Phase 2 tracing days:
scx_simpledeclares itsstatsmap asBPF_MAP_TYPE_PERCPU_ARRAYwithmax_entries 2 /* [local, global] */, so each CPU bumps its own private slot with no locking, and the userspacelocal=/global=totals are the sum across all CPUs. That’s why a busy multi-core box racks up counts fast without any contention on the counters.
That’s it. Your system is now scheduled by BPF.
Run something that exercises scheduling. stress-ng isn’t part of a base install — install it first (sudo apt-get install -y stress-ng on Debian/Ubuntu, sudo dnf install -y stress-ng on Fedora/RHEL). If you can’t install a package, a portable fallback is for i in $(seq $(nproc)); do yes >/dev/null & done (stop it later with pkill yes).
# In another terminal:
stress-ng --cpu 4 --timeout 30
While it runs, confirm scx_simple is actually in control:
cat /sys/kernel/sched_ext/state
# enabled
(When no BPF scheduler is loaded this reads disabled.) Watch the local=N global=M line scx_simple prints each second — both counters should climb as stress-ng’s workers cycle through the scheduler. With scx_simple, basic responsiveness is preserved (it’s a working scheduler, just simple) but you’re not getting CFS’s fair-share guarantees — it’s literally a shared queue, FIFO-ish.
Read the source
tools/sched_ext/scx_simple.bpf.c. The whole scheduler is ~30 lines of BPF:
void BPF_STRUCT_OPS(simple_enqueue, struct task_struct *p, u64 enq_flags)
{
/* Place into the shared vtime-ordered DSQ with the default slice */
u64 vtime = p->scx.dsq_vtime;
/* cap idle budget at one slice (the min_vruntime trick) */
if (time_before(vtime, vtime_now - SCX_SLICE_DFL))
vtime = vtime_now - SCX_SLICE_DFL;
scx_bpf_dsq_insert_vtime(p, SHARED_DSQ, SCX_SLICE_DFL, vtime, enq_flags);
}
void BPF_STRUCT_OPS(simple_dispatch, s32 cpu, struct task_struct *prev)
{
scx_bpf_dsq_move_to_local(SHARED_DSQ, 0);
}
That two-line clamp is the min_vruntime-style floor from the CFS section, reappearing verbatim: it caps how much priority a long-sleeping task can bank to a single slice.
The real source wraps this in an if (fifo_sched) toggle (a FIFO mode vs. the default vtime mode); we show only the default vtime branch — that’s the line you’ll edit in the experiments below.
Read those two functions against everything above. simple_enqueue is the “a task became runnable, where does it go?” callback — it reads the task’s per-task p->scx.dsq_vtime and inserts into the vtime-ordered SHARED_DSQ, so fairer (lower-vtime) tasks sort to the front. simple_dispatch is the “a CPU needs work” callback — it pulls the front task into the local DSQ. Enqueue and dispatch, exactly the two-event skeleton.
(BPF_STRUCT_OPS already expands to SEC("struct_ops/"#name) internally — you never write the SEC() line yourself, and doing so would cause a section conflict.)
Plus init, exit, and the vtable instance. That’s the whole scheduler.
The userspace component (scx_simple.c) is ~110 lines and handles:
- Loading the BPF object.
- Attaching the struct_ops link.
- Periodic stats output.
- Graceful exit on Ctrl-C (which causes the kernel to revert to CFS).
Stop it
Ctrl-C in the scx_simple terminal. The watchdog’s not needed — scx_simple exits cleanly, the kernel detects the link drop, CFS takes over. Confirm: cat /sys/kernel/sched_ext/state now reads disabled. Re-run stress-ng and watch per-thread CPU share with pidstat -t 1 or top -H — under CFS the worker threads converge to roughly equal CPU% (that’s vruntime fairness at work), in contrast to scx_simple’s single shared FIFO-ish queue. (Stop the yes fallback, if you used it, with pkill yes.)
What to break
Don’t dispatch
Comment out scx_bpf_dsq_move_to_local(SHARED_DSQ, 0) in simple_dispatch. Run; CPUs have nothing to run; tasks pile up in the queue. After ~30s, watchdog ejects:
sched_ext: BPF scheduler "simple" disabled (runnable task stall)
sched_ext: simple: stress-ng[12345] failed to run for 30.000s
Check dmesg. The system recovers automatically. Don’t break dispatch in production. Production sched_ext schedulers all have safety paths to fall back if their custom logic can’t dispatch.
Always dispatch with vtime=0
Set vtime = 0 in simple_enqueue. Every task has the same priority. As the CFS section explained, with all vtime equal the vtime-ordered queue can no longer distinguish a compute hog from an interactive task — long-running tasks dominate; interactive tasks lag. CFS’s vtime accounting is the simplest fairness mechanism; copying it is the path of least surprise. Try it without; observe responsiveness drop.
Add per-CPU DSQs
Replace SHARED_DSQ with per-CPU DSQs. Each CPU pulls from its own. No cross-CPU contention but no automatic load balancing — you’d manually rebalance in dispatch when own DSQ empty. This is what scx_central does (Day 27).
Add a tracepoint
Inside simple_enqueue, emit to ringbuf:
struct event *e = bpf_ringbuf_reserve(&rb, sizeof(*e), 0);
if (e) { e->pid = p->pid; ...; bpf_ringbuf_submit(e, 0); }
You’re now observing every scheduler decision in real time. Throughput consideration: at high context-switch rates (1M+/sec), even a few ns per emit becomes meaningful. Filter aggressively (sample 1 in N, or only emit specific tasks) or aggregate in BPF.
What to read in the kernel
-
kernel/sched/ext.c— the framework. ~10,000 lines. Read the file’s top comment for the design overview. Don’t try to read everything today; just orient. -
kernel/sched/ext_internal.h:292—struct sched_ext_opsdefinition. The vtable shape: every callback your BPF scheduler can implement. -
kernel/sched/ext.c:7447—scx_enable(struct sched_ext_ops *ops, struct bpf_link *link). The function called when a struct_ops scheduler is loaded; activates it as the system scheduler. -
kernel/sched/ext_idle.c— idle CPU integration. How sched_ext schedulers handle the case “no task to run; CPU should idle.” -
kernel/sched/fair.c— the fair-class (EEVDF) implementation: the scheduler sched_ext replaces while loaded and reverts to on unload. Skimpick_eevdf()andplace_entity()to see how virtual deadlines andavg_vruntime()drive selection and placement — that’s the fairness model your vtime-ordered DSQ is imitating. -
tools/sched_ext/scx_simple.bpf.c— read in full. The minimal example. -
tools/sched_ext/include/scx/common.bpf.h— kfunc declarations and helpers your BPF scheduler will use. -
Documentation/scheduler/sched-ext.rst— official guide. Read once. Concise.
Bullet Points
- A scheduler picks, from the runnable (
TASK_RUNNING) tasks, which runs on each CPU and for how long (its time slice). Blocked tasks (TASK_INTERRUPTIBLE/TASK_UNINTERRUPTIBLE) aren’t candidates until a wakeup. Slice expiry causes preemption; swapping tasks is a context switch. The two events: enqueue (task becomes runnable) and dispatch (CPU needs a task). - CFS is the default scheduler; its fairness comes from
vruntime(CPU time consumed, weighted) — the intuition is “run the task that’s run least.” (In this kernel the fair class is EEVDF: it picks the leftmost eligible entity by virtual deadline viapick_eevdf(), same fairness outcome.) New/woken tasks are placed near the runqueue’s weighted-average virtual time (avg_vruntime()), not a minimum floor. sched_ext’s vtime-ordered DSQ reproduces this;vtime=0everywhere destroys it. - sched_ext lets BPF programs implement Linux schedulers via
struct sched_ext_ops(struct_ops). Per-task scheduling data lives intask_struct.scx(e.g.p->scx.dsq_vtime). - DSQs are kernel-managed dispatch queues, either FIFO or vtime-ordered. Built-in:
SCX_DSQ_GLOBAL(FIFO only),SCX_DSQ_LOCAL. Custom viascx_bpf_create_dsq. - Dispatch stall watchdog ejects stalled BPF schedulers and falls back to CFS. Default and max timeout is 30 seconds (
SCX_WATCHDOG_MAX_TIMEOUT = 30 * HZ; HZ=1000 here, so 30000 jiffies), tunable shorter viaops.timeout_ms. scx_simpleis the minimal example;scx_central,scx_flatcg,scx_lavdare progressively richer.- Loading a BPF scheduler is a system-wide operation — every task on the system schedules through it.
- Source:
kernel/sched/ext.c(~10,000 lines) +kernel/sched/ext_internal.h(struct definitions) +tools/sched_ext/.
Check question
What guarantees that loading a BPF scheduler doesn’t permanently freeze your machine?
Click to reveal answer
Answer: The dispatch stall watchdog. The kernel monitors task wait times across all CPUs; if any task has been runnable but not dispatched past the stall timeout, the framework concludes the BPF scheduler is broken, ejects it, and re-enables CFS. Recovery is automatic.
The watchdog timeout defaults to 30 seconds (SCX_WATCHDOG_MAX_TIMEOUT = 30 * HZ in kernel/sched/ext_internal.h). A scheduler can request a shorter timeout via ops.timeout_ms, but the kernel caps it at 30 seconds — you can never disable or lengthen it past that. The default threshold is conservative — long enough that no legitimate scheduling delay would trigger it, short enough that a fully-stalled BPF scheduler doesn’t make the system hang for minutes.
This is the design that makes BPF scheduling practical. Without it, an infinite loop in dispatch (or a logic error that fails to consume any DSQ) would deadlock the system requiring a power cycle. With it, the worst case is a 30-second pause, then full recovery and CFS-managed normalcy. The barrier to “let me try this scheduler” drops from “are you sure” to “sure, why not — worst case, 30 seconds.”
Tomorrow
Day 26: modify scx_simple to prioritize a specific cgroup. See your changes affect a real workload.
Day 26 — Modify scx_simple: priority for one cgroup
Today’s mission: make a custom variant of
scx_simplethat gives scheduling priority to tasks in a chosen cgroup, and watch that workload get preferential treatment under load. Three small things will bite you along the way — what a cgroup really is in v7.1, which cgroup id to match on, and how oneconst volatileglobal becomes load-time configuration — and the body sections introduce each as we hit it. Total time: ~110 minutes.
Why this exercise
Yesterday you ran a stranger’s BPF scheduler. Today you change one and observe the effect. This is the most important sched_ext skill: small, surgical modifications to a working scheduler.
The goal is to get comfortable with the iteration loop:
- Edit one callback.
- Compile, load.
- Generate a workload.
- Observe the effect with measurements.
- Tune; iterate.
Today’s specific modification: tasks in /sys/fs/cgroup/priority get a 2× time slice and lower vtime (so they run earlier). Tasks elsewhere use the default.
That one sentence hides three things that will bite you if you don’t understand them, and most of today is about making them obvious:
- What a cgroup is, how the kernel arranges them into a tree, and why the BPF code has to walk that tree with a kfunc instead of following a
parentpointer (there isn’t one). - Why the id you match against is the full 64-bit kernfs id — on 64-bit Linux it equals the inode
statprints, but on a 32-bit kernel it doesn’t, so we read it the portable way — and why getting it wrong silently disables the whole feature. - How a
const volatileglobal becomes a knob userspace sets once, before load, that the verifier then bakes in as a constant.
We’ll teach each as we hit the part of the lab that depends on it. A few things you’ve already met carry over and we’ll only refresh, not re-teach: vtime-ordered DSQs and p->scx.dsq_vtime (Day 25), kfunc acquire/release reference discipline and KF_ACQUIRE/KF_RELEASE (Day 20), bpf_cgroup-as-a-refcounted-type and bpf_cgroup_release (Day 21), bounded loops with bpf_for (Day 5), the null-check-must-dominate-deref rule (Day 4), and per-callback sleepable struct_ops (Day 22).
What a cgroup is, and the tree it lives in
Before we touch the scheduler, let’s get concrete about the thing we’re prioritizing.
A cgroup (control group) is a node in a tree of processes. Every task on the system belongs to exactly one cgroup, and a cgroup can hold many tasks. In cgroup v2 — the “unified hierarchy” — there is a single tree for all controllers (cpu, memory, io, …), mounted at /sys/fs/cgroup. That filesystem is the tree: each directory is a cgroup, and nesting directories nests cgroups.
You build the tree with ordinary filesystem operations:
mkdir /sys/fs/cgroup/prioritycreates a child cgroup of the root.- Writing a PID into
/sys/fs/cgroup/priority/cgroup.procsmoves that task — and every process it later forks — into that cgroup.
That is exactly what the setup section does below: it makes one new cgroup and drops your shell into it.
Each cgroup knows its depth: level
Here is the field the whole modification hinges on. In v7.1, struct cgroup carries an int level:
/* include/linux/cgroup-defs.h:474 */
struct cgroup {
/* self css with NULL ->ss, points back to this cgroup */
struct cgroup_subsys_state self;
unsigned long flags;
/*
* The depth this cgroup is at. The root is at depth zero and each
* step down the hierarchy increments the level. This along with
* ancestors[] can determine whether a given cgroup is a
* descendant of another without traversing the hierarchy.
*/
int level; /* cgroup-defs.h:486 */
/* ... */
struct kernfs_node *kn; /* cgroup kernfs entry — cgroup-defs.h:526 */
/* ... */
/* All ancestors including self — cgroup-defs.h:636 */
struct cgroup *ancestors[];
};
Read the comment carefully, because it tells you the trick the kernel — and our BPF code — uses. The root cgroup is level == 0; each step down adds one. /priority is level 1; /priority/work is level 2. And crucially, every cgroup keeps an ancestors[] array indexed by level — ancestors[0] is the root, ancestors[1] is its level-1 ancestor, up to ancestors[level] which is the cgroup itself. So asking “what is my ancestor at level N?” is an O(1) array lookup, not a pointer-chase up the tree. That is what makes a verifier-friendly bounded loop possible: we iterate lvl from 0 to owned->level, indexing ancestors[lvl] each time.
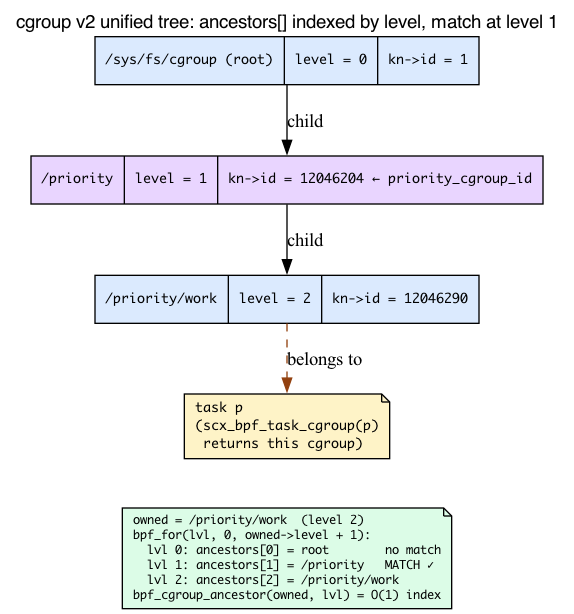
There is deliberately no cgrp->parent
Now the subtle part, the one the chapter leans on hard. You might expect to walk the tree by hand: for (cg = mine; cg; cg = cg->parent). You can’t — struct cgroup has no parent field at all. Look back at the struct: level, kn, ancestors[], but no struct cgroup *parent.
Where did the parent go? It lives one level down, on the cgroup’s embedded self css. Every cgroup contains a struct cgroup_subsys_state self, and that is where the parent link sits:
/* include/linux/cgroup-defs.h:246, inside struct cgroup_subsys_state */
struct cgroup_subsys_state *parent;
So the parent of a cgroup is reachable as cgrp->self.parent — but notice the type: it’s a struct cgroup_subsys_state *, not a struct cgroup *. You can’t write cg = cg->parent and you can’t even write cg = cg->self.parent and expect a cgroup * back. Hand-rolling the walk means juggling css↔cgroup conversions, and a manual pointer-chasing loop is hard to make the verifier accept anyway.
That is why the BPF side uses the bpf_cgroup_ancestor() kfunc instead. It takes the ancestors[] shortcut for you:
/* kernel/bpf/helpers.c:2792 */
__bpf_kfunc struct cgroup *bpf_cgroup_ancestor(struct cgroup *cgrp, int level)
{
struct cgroup *ancestor;
if (level > cgrp->level || level < 0)
return NULL;
/* cgrp's refcnt could be 0 here, but ancestors can still be accessed */
ancestor = cgrp->ancestors[level];
if (!cgroup_tryget(ancestor))
return NULL;
return ancestor;
}
It’s a guarded array index — return NULL if level is out of range, otherwise hand back ancestors[level] with a fresh reference taken on it. “Walk the hierarchy” is really “index the ancestors array, one level per loop iteration.”
Each cgroup is a kernfs directory: cgrp->kn
One more field from that struct: cgrp->kn, a struct kernfs_node *. kernfs is the in-kernel pseudo-filesystem machinery that backs /sys/fs/cgroup (and /sys generally). Every cgroup directory is a kernfs node, and that node carries a stable identifier — cgrp->kn->id — which is the value the BPF side matches against to recognize “this is the priority cgroup.” We need to understand that id precisely, because it’s the single most common way to get this lab wrong.
Setting up the priority cgroup
sudo mkdir /sys/fs/cgroup/priority
stat -c %i /sys/fs/cgroup/priority # cgroup's kernfs inode — equals kn->id on 64-bit Linux
# Put a shell into it (subprocess inheritance)
echo $$ | sudo tee /sys/fs/cgroup/priority/cgroup.procs
echo $$ # this shell now lives in /priority
Anything spawned from this shell will be in /priority until you move it back.
Heads up about that
stat -c %i. On your 64-bit box this prints the directory’s inode, which equals the id the BPF side compares against (kn->id) — so it would actually work here. We still read the id withname_to_handle_at()in userspace because that’s the portable choice: it returns the full 64-bit id on a 32-bit kernel too, wherestat’s inode would be truncated. The next section explains the split.
The id you match on: the full 64-bit kernfs id
The BPF side matches on cgrp->kn->id, which is a u64:
/* include/linux/kernfs.h:226 */
/*
* 64bit unique ID. On 64bit ino setups, id is the ino. On 32bit,
* the low 32bits are ino and upper generation.
*/
u64 id;
Read the comment carefully, because the behavior splits by platform:
- On 64-bit
ino_tsystems — x86-64, arm64, essentially every modern 64-bit Linux, including this lab machine — the id simply is the inode. There is no packing:kernfs_id_ino(id)returns the whole 64-bitidandkernfs_id_gen(id)is a fixed1. The inode is set from that same full id (iget_locked(sb, kernfs_ino(kn)),kernfs/inode.c:252), andi_inois anunsigned long(64-bit), sost_ino == cgrp->kn->idexactly, high bits and all. - On 32-bit
ino_tbuilds (32-bit kernels) the id packs two things — the inode in the low 32 bits and a generation counter in the high 32 bits — becauseino_tcan’t hold all 64 bits.
The kernel hands you helpers whose two branches make exactly this split explicit:
/* include/linux/kernfs.h:347 */
static inline ino_t kernfs_id_ino(u64 id) /* low bits: the inode */
{
if (sizeof(ino_t) >= sizeof(u64))
return id; /* 64-bit ino: the WHOLE id */
else
return (u32)id; /* 32-bit ino: low 32 bits only */
}
/* include/linux/kernfs.h:356 */
static inline u32 kernfs_id_gen(u64 id) /* high 32 bits: the generation */
{
if (sizeof(ino_t) >= sizeof(u64))
return 1; /* 64-bit ino: no generation, fixed 1 */
/* else: id >> 32 */
}
So on your x86-64 box stat -c %i would in fact print the correct matching value — I verified this against name_to_handle_at() for /sys/fs/cgroup, /init.scope, and /system.slice and the two agreed in every case. Truncation only bites on a 32-bit-ino_t build, where stat’s ino_t carries just the low 32 bits and would drop a nonzero generation.
We still read the id with name_to_handle_at() rather than stat, because it is the unambiguous, portable choice: it returns the full 64-bit kn->id on both regimes, so the lab works the same on a 32-bit kernel as on your 64-bit one without a platform caveat. That’s the load-bearing reason the userspace driver below uses a syscall instead of stat(). (For confidence that kn->id really is the canonical cgroup identifier: production sched_ext code uses it directly — scx_flatcg.bpf.c:391 does scx_bpf_dsq_insert(p, cgrp->kn->id, ...), keying a whole DSQ on it.)
There are no Dumb Questions
Q: Why match on
kn->idinstead of the cgroup path string? A: The path can change (a cgroup can be renamed/moved) and string-comparing paths on the scheduler hot path would be slow and verifier-hostile.kn->idis a stable 64-bit integer the kernel already has oncgrp, so the match is a singleu64compare.Q: Why not just hard-code the id as a literal in the BPF source? A: The id doesn’t exist until you
mkdirthe cgroup at runtime, so there’s nothing to hard-code at compile time. That’s exactly the gap theconst volatileglobal fills — userspace reads the live id and sets it before load (next section).Q: Why release the ancestor reference on the no-match path too, not just on a match? A:
bpf_cgroup_ancestor()isKF_ACQUIRE— it hands back a refcounted reference every time it returns non-NULL, match or not. The verifier forces abpf_cgroup_release()on every path that holds one, or the program won’t load. (More on this in “Reference discipline” below.)
Configuring a BPF program at load time: const volatile and .rodata
The BPF side needs to know which cgroup id is “the priority one.” It can’t be hard-coded — the id is only known at runtime, after you mkdir the cgroup. But it also shouldn’t be a per-packet map lookup on the scheduler hot path. The idiom for “a constant chosen by userspace, baked in before the program runs” is a const volatile global.
const volatile __u64 priority_cgroup_id = 0; /* full kernfs id; set from userspace */
This is not an ordinary runtime variable. libbpf places every const volatile global into the program’s .rodata ELF section, which becomes a single-entry, read-only BPF array map. The two qualifiers each do a job:
consttells the verifier the value is fixed once the program loads. Because the verifier then treatspriority_cgroup_idas a known constant, it can constant-fold and dead-code-eliminate — for example, if the value is0, the entireif (priority_cgroup_id) { ... }branch is provably dead and gets removed.volatilestops the compiler from doing that folding too early. Without it, clang would see the initializer= 0, conclude the value is always0, and fold the branch away at compile time — before userspace ever gets a chance to set it.volatileforces clang to emit a real load from.rodata, leaving the value “unknown until load.”
Userspace can write this map only in the window between skeleton open and load:
skeleton open → write skel->rodata->priority_cgroup_id → load (map frozen read-only) → verifier constant-folds the if() → attach
Setting skel->rodata->priority_cgroup_id = ... mutates the map’s backing memory; load then freezes it read-only. That’s why the driver sets it before scx_simple__attach(), and why we describe rodata as “settable before load, read-only after.” It’s the same .rodata idiom already in the file you’re editing — scx_simple.bpf.c:27 declares const volatile bool fifo_sched; the same way.
The flip side is the failure mode that makes the fail-loud guard matter: because the verifier sees priority_cgroup_id as a constant, leaving it 0 doesn’t just “skip” the feature at runtime — the gated branch is removed at verification time. A 0 here truly compiles the feature out. So a wrong id (from stat’s truncation, say) and an unset id fail the same silent way, which is exactly why we check it loudly below.

The modification
Two files to change: tools/sched_ext/scx_simple.bpf.c and the userspace driver tools/sched_ext/scx_simple.c.
BPF side: read a config variable, branch on cgroup
The complete derivative lives in the lab as scx_priority.bpf.c — a copy of
scx_simple.bpf.c with exactly this change. First the one new load-time global:
/*
- The one knob this derivative adds: the full 64-bit kernfs id of the priority
- cgroup. It is a
const volatileglobal, so it lives in .rodata — userspace - writes it once between skeleton open and load, and the verifier then treats
- it as a known constant (a value of 0 dead-code-eliminates the whole priority
- branch, which is why the userspace driver fails loudly on a 0 id). / const volatile __u64 priority_cgroup_id = 0; / full kernfs id; set from userspace */
/*
- scx_bpf_task_cgroup(), bpf_cgroup_ancestor(), and bpf_cgroup_release() all
- come from <scx/common.bpf.h> (scx_bpf_task_cgroup is a compat macro in
- <scx/compat.bpf.h>). Do NOT re-declare them with your own
extern ... __ksym; - — that collides with the header and fails to compile. Just call them, as
- scx_flatcg.bpf.c does. */
and then the rewritten simple_enqueue (the two lines that clamp idle budget are
carried over unchanged from stock scx_simple):
void BPF_STRUCT_OPS(simple_enqueue, struct task_struct *p, u64 enq_flags) { u64 vtime = p->scx.dsq_vtime; u64 slice = SCX_SLICE_DFL;
stat_inc(1); /* count global queueing */
/*
* Limit the amount of budget that an idling task can accumulate to one
* slice (carried over unchanged from scx_simple). This floor is also
* what keeps the priority decrement below bounded: a task can never sit
* more than one slice ahead of vtime_now, so it cannot starve the rest
* and trip the runnable-task-stall watchdog.
*/
if (time_before(vtime, vtime_now - SCX_SLICE_DFL))
vtime = vtime_now - SCX_SLICE_DFL;
/*
* Walk up the cgroup hierarchy looking for the priority cgroup.
* bpf_cgroup_ancestor(cgrp, level) returns the ancestor at the given
* level (0 = root) as an ACQUIRED reference we must release. We iterate
* with bpf_for(), the same idiom scx_flatcg uses: it gives the verifier
* a provable bound on a runtime limit (owned->level), which an ordinary
* `for` on a memory-read value would not. A match anywhere on the path
* (own cgroup or any ancestor) counts, so tasks nested below /priority
* inherit priority too.
*/
if (priority_cgroup_id) {
struct cgroup *owned = scx_bpf_task_cgroup(p);
if (owned) {
int lvl;
bpf_for(lvl, 0, owned->level + 1) {
struct cgroup *anc = bpf_cgroup_ancestor(owned, lvl);
if (!anc)
continue;
if (anc->kn->id == priority_cgroup_id) {
vtime -= 1000000; /* push 1 ms earlier in queue */
slice *= 2; /* longer time slice */
bpf_cgroup_release(anc);
break;
}
bpf_cgroup_release(anc);
}
bpf_cgroup_release(owned);
}
}
scx_bpf_dsq_insert_vtime(p, SHARED_DSQ, slice, vtime, enq_flags);
}
Two effects:
- Lower vtime = pushed earlier in the vtime-ordered DSQ; runs sooner.
- Longer slice = more CPU time per scheduling round before being preempted.
Reading the loop line by line
Several things you’ve met before are doing quiet work here; let’s name them.
Vtime, refreshed (Day 25). A task’s p->scx.dsq_vtime is its accumulated virtual runtime, and the vtime-ordered DSQ dispatches the lowest vtime first — it’s literally an rbtree keyed on vtime (struct rb_root priq; /* used to order by p->scx.dsq_vtime */, include/linux/sched/ext.h:85). So subtracting from vtime pushes a task earlier in line. The base slice we double is SCX_SLICE_DFL = 20 * 1000000 (20 ms, sched/ext.h:30).
The ancestor walk uses bpf_cgroup_ancestor(), not cg->parent. As the cgroup section established, struct cgroup has no parent field, so we use the bpf_cgroup_ancestor(cgrp, level) kfunc — it returns the ancestor at a given depth as an acquired reference (release it with bpf_cgroup_release).
bpf_for(lvl, 0, owned->level + 1) is a bounded loop (Day 5). The verifier needs a provable iteration bound even though the limit (owned->level) is a runtime value read from memory; bpf_for() supplies it, where a plain for comparing against owned->level would be rejected. The upper bound is owned->level + 1 precisely because ancestors[] is indexed 0 .. level inclusive — we want to check the root (0), the task’s own cgroup (level), and everything between. This is the exact idiom scx_flatcg.bpf.c:207 uses: bpf_for(level, 0, cgrp->level + 1). You don’t need to add any include for it: <scx/common.bpf.h> (already included by scx_simple.bpf.c) pulls bpf_for in transitively — exactly as scx_flatcg.bpf.c uses it with no bpf_experimental.h include. (Adding #include <bpf/bpf_experimental.h> yourself actually breaks the scx build: that header isn’t on the sched_ext include path and clang fails with 'bpf/bpf_experimental.h' file not found.)
Reference discipline (Day 20/21) plus one new wrinkle. Both scx_bpf_task_cgroup(p) and bpf_cgroup_ancestor() are KF_ACQUIRE kfuncs — each returns a refcounted cgroup the verifier forces you to release on every path, which is why there’s a bpf_cgroup_release() on the match path, the no-match path, and the outer owned. You can confirm the flags in the source:
/* kernel/bpf/helpers.c:4738 */
BTF_ID_FLAGS(func, bpf_cgroup_ancestor, KF_ACQUIRE | KF_RCU | KF_RET_NULL)
/* kernel/bpf/helpers.c:4737 */
BTF_ID_FLAGS(func, bpf_cgroup_release, KF_RELEASE)
/* kernel/sched/ext.c:9798 */
BTF_ID_FLAGS(func, scx_bpf_task_cgroup, KF_IMPLICIT_ARGS | KF_RCU | KF_ACQUIRE)
The new wrinkle: notice bpf_cgroup_ancestor is also KF_RET_NULL (and KF_RCU). That means anc can be NULL, and the verifier applies the same null-domination rule you learned on Day 4 — you must guard if (!anc) continue; before you dereference anc->kn->id. The if (!anc) continue; isn’t defensive politeness; the program won’t load without it.
Userspace side: pass the cgroup ID
The lab’s scx_priority.c is the stock scx_simple.c driver plus a portable
cgroup-id reader:
/*
-
The BPF side matches against cgrp->kn->id, the full 64-bit kernfs id.
-
On 64-bit-ino Linux (x86-64, arm64) that id equals st_ino, so stat would
-
work; on a 32-bit-ino kernel st_ino is only the low 32 bits and would drop
-
the generation. name_to_handle_at() returns the full 64-bit id on both, so
-
use it for a portable read. */ static __u64 read_cgroup_id(const char *path) { struct { struct file_handle fh; __u64 id; } h = { .fh = { .handle_bytes = sizeof(__u64) } }; int mount_id;
if (name_to_handle_at(AT_FDCWD, path, &h.fh, &mount_id, 0) < 0) return 0; return h.id; }
Both sides must use the same 64-bit value or the equality at anc->kn->id == priority_cgroup_id never fires: the kernel stores the full u64 in kn->id, and read_cgroup_id() copies the first __u64 out of the file handle — the same 64 bits. (rodata->priority_cgroup_id is the userspace handle for the BPF program’s const volatile __u64 priority_cgroup_id — settable before load, read-only after, as the .rodata section above explained.)
Confirm the printed id is NON-ZERO — it should look like:
priority cgroup id = 12046204
If it prints 0, name_to_handle_at() failed (wrong path, or the directory isn’t on cgroup2). Verify /sys/fs/cgroup/priority exists and mount | grep cgroup2 lists /sys/fs/cgroup. A 0 here is dead-code-eliminated by the verifier (see the .rodata section), so the feature is compiled out entirely — which is why the driver sets the id and fails loudly, all in the .rodata window before load:
/*
* Set the priority cgroup id in the .rodata window (after open, before
* load). A 0 id means name_to_handle_at() failed (wrong path, or the
* directory is not on cgroup2) — and because the verifier constant-folds
* this global, a 0 would silently compile the priority branch out. So we
* fail loudly instead of loading a scheduler that does nothing.
*/
skel->rodata->priority_cgroup_id = read_cgroup_id(cgroup_path);
fprintf(stderr, "priority cgroup id = %llu (%s)\n",
skel->rodata->priority_cgroup_id, cgroup_path);
if (skel->rodata->priority_cgroup_id == 0) {
fprintf(stderr, "FATAL: could not read priority cgroup id; "
"create %s first\n", cgroup_path);
scx_priority__destroy(skel);
return 1;
}
Build and run
The repo lab builds this derivative against the locked v7.1 sched_ext support
(make -C ebpf/labs day26) and ships a safe, self-cleaning runner. run.sh
creates a throwaway priority cgroup it owns, starts a small workload in it,
loads scx_priority pointed at that cgroup for a bounded interval, and on any
exit ejects the scheduler and removes only the cgroup it made:
Day 26 opt-in runner: load the scx_priority derivative against an OWNED,
throwaway priority cgroup, run it for a bounded interval, then fully clean up.
Safety contract (this replaces a live kernel scheduler, so it is deliberate):
* refuses to run without EBPF_LABS_ALLOW_PRIVILEGED=1 and root;
* creates ONE cgroup it owns (ebpf-day26-$$) and never touches any other;
* a single trap moves our children back to the root cgroup, ejects the
scheduler, and rmdir’s the owned cgroup on any exit path;
* bounds the run with a timeout so a mistake cannot wedge the box.
set -euo pipefail
HERE=$(cd – “$(dirname – “${BASH_SOURCE[0]}”)“ && pwd) ROOT=$(cd – “$HERE/..” && pwd) SCHED=“$ROOT/.output/day26/build/bin/scx_priority” CGROUP_ROOT=/sys/fs/cgroup OWNED=“$CGROUP_ROOT/ebpf-day26-$$” DURATION=${DURATION:-10} SCHED_PID= WORK_PID=
fail() { printf ‘day26 run: %s\n’ “$*” >&2; exit 1; }
cleanup() { local status=$? trap - EXIT INT TERM [[ -n $WORK_PID ]] && kill “$WORK_PID” 2>/dev/null || true if [[ -n $SCHED_PID ]] && kill -0 “$SCHED_PID” 2>/dev/null; then kill -INT “$SCHED_PID” 2>/dev/null || true wait “$SCHED_PID” 2>/dev/null || true fi # Move any survivors back to root and remove only the cgroup we created. if [[ -d $OWNED ]]; then if [[ -r $OWNED/cgroup.procs ]]; then while read -r pid; do [[ -n $pid ]] && echo “$pid” > “$CGROUP_ROOT/cgroup.procs” 2>/dev/null || true done < “$OWNED/cgroup.procs” fi rmdir “$OWNED” 2>/dev/null || true fi exit “$status” } trap cleanup EXIT INT TERM
[[ ${EBPF_LABS_ALLOW_PRIVILEGED:-0} == 1 ]] || fail ‘set EBPF_LABS_ALLOW_PRIVILEGED=1 to acknowledge loading a live BPF scheduler’ [[ ${EBPF_LABS_ALLOW_SCHED_EXT:-0} == 1 ]] || fail ‘set EBPF_LABS_ALLOW_SCHED_EXT=1 to acknowledge loading a live BPF scheduler’ (( EUID == 0 )) || fail ‘run with sudo after setting both acknowledgement variables’ [[ -x $SCHED ]] || fail “missing $SCHED; run scripts/build-day.sh day26 first” [[ -r /sys/kernel/sched_ext/state ]] || fail ‘kernel has no sched_ext support’ [[ -w $CGROUP_ROOT/cgroup.procs ]] || fail “$CGROUP_ROOT is not a writable cgroup2 mount” [[ -e $OWNED ]] && fail “owned cgroup $OWNED already exists”
1. Create the owned priority cgroup and start a small CPU workload inside it.
mkdir “$OWNED” ( exec sh -c ‘echo $$ > “$1/cgroup.procs”; exec yes >/dev/null’ _ “$OWNED” ) & WORK_PID=$!
2. Start the scheduler pointed at the owned cgroup, bounded by a timeout.
“$SCHED” -c “$OWNED” & SCHED_PID=$! sleep 1 kill -0 “$SCHED_PID” 2>/dev/null || fail ‘scheduler exited early (see its output above)’
printf ‘day26 run: scx_priority active for %ss; state=%s\n’
“$DURATION” “$(cat /sys/kernel/sched_ext/state)”
sleep “$DURATION”
3. cleanup() ejects the scheduler and tears down the owned cgroup.
printf ‘day26 run: stopping; sched_ext state should return to disabled\n’
To explore the effect by hand instead — the manual, contrast-driven workflow the rest of this section walks through:
Prerequisites. This step needs three non-default tools — install them first:
sudo apt-get install -y stress-ng sysbench # load generator + CPU benchmark
(It also assumes the kernel built at ~/code/linux with sched_ext enabled, established on earlier days.)
cd ~/code/linux/tools/sched_ext
make
sudo ./scx_simple &
# The "Setting up" section moved THIS shell into /priority. Move it back to the
# root cgroup first, so the heavy load below inherits root (NOT /priority) —
# otherwise BOTH the load and the benchmark run in /priority and there is no
# contrast to observe.
echo $$ | sudo tee /sys/fs/cgroup/cgroup.procs
# Heavy load (root cgroup, NOT /priority):
stress-ng --cpu 8 --timeout 60 &
# Prove the split before benchmarking:
cat /proc/$(pgrep -n stress-ng)/cgroup # expect 0::/ (stress-ng in root)
cat /proc/$$/cgroup # expect 0::/ (shell still in root)
# NOW move this shell into the priority cgroup and run the benchmark:
echo $$ | sudo tee /sys/fs/cgroup/priority/cgroup.procs
cat /proc/$$/cgroup # expect 0::/priority
sysbench --threads=1 --cpu-max-prime=20000 cpu run
# Compare to running WITHOUT the priority modification (revert and re-test).
The two cat /proc/.../cgroup lines are the contrast check: the load shows 0::/ while the benchmark shell shows 0::/priority. Your sysbench in the priority cgroup should complete faster than baseline despite the competing stress-ng.
Measure
Measure throughput directly — run the same benchmark once from inside /priority and once from the root cgroup, both while stress-ng loads the box, and compare the events per second lines. (Don’t wrap it in schedtool -p N: that sets a real-time policy, which moves the task OUT of the sched_ext class entirely, so it would no longer exercise your cgroup-priority logic.)
stress-ng --cpu 8 --timeout 60 &
# Run A — inside the priority cgroup:
echo $$ | sudo tee /sys/fs/cgroup/priority/cgroup.procs
sysbench --threads=8 --cpu-max-prime=20000 cpu run | grep -E 'events per second|total time'
# Run B — back in the root cgroup:
echo $$ | sudo tee /sys/fs/cgroup/cgroup.procs
sysbench --threads=8 --cpu-max-prime=20000 cpu run | grep -E 'events per second|total time'
Under contention, Run A (in /priority) should report a noticeably higher events per second than Run B. Cross-check with the per-cgroup CPU accounting:
cat /sys/fs/cgroup/priority/cpu.stat
cat /sys/fs/cgroup/cpu.stat
Compare the usage_usec fields — /priority should have accumulated more CPU time:
usage_usec 20946205000
user_usec 16795163000
system_usec 4151042000
...
With the priority modification, the priority cgroup gets noticeably more CPU under contention; without it the two runs should be roughly equal.
What to break, in order
Walk the cgroup hierarchy correctly
If your priority cgroup contains child cgroups (e.g., /priority/work and /priority/play), tasks in those children should also count. The bpf_cgroup_ancestor walk above handles this — it checks every ancestor from the task’s own cgroup up to the root, so a match at the /priority level still triggers for tasks nested below it. This is exactly the payoff of the level/ancestors[] design: a task in /priority/work (level 2) has ancestors[1] == /priority, so iterating lvl from 0 to 2 finds the match at lvl == 1.
To verify it triggers, give the matched branch a direct observable. Throughput alone is too noisy to confirm a nested match. Add a bpf_printk inside the matched-ancestor branch in simple_enqueue, right before the break:
if (anc->kn->id == priority_cgroup_id) {
vtime -= 1000000;
slice *= 2;
bpf_printk("prio match: comm=%s\n", p->comm); /* observe the hit */
bpf_cgroup_release(anc);
break;
}
Then create the child cgroup, run a task in it, and watch the trace:
sudo mkdir -p /sys/fs/cgroup/priority/work
echo $$ | sudo tee /sys/fs/cgroup/priority/work/cgroup.procs
sudo cat /sys/kernel/debug/tracing/trace_pipe &
sysbench --threads=1 --cpu-max-prime=20000 cpu run
Expect trace_pipe to print a line like prio match: comm=sysbench for the task spawned in /priority/work, confirming the ancestor walk matched at the parent (/priority) level for the nested task. (p->comm is the right field for the task name.) If you’d rather not print on the hot path, increment a file-scope counter — u64 prio_hits = 0; then prio_hits++; in the branch — and read it with sudo bpftool map dump name scx_simp.bss; the count should climb once the nested task is enqueued.
Negative vtime
vtime -= 1000000000; /* huge decrement */
This is where signed intuition betrays you. dsq_vtime is a u64 (include/linux/sched/ext.h:231 — u64 dsq_vtime;), so there is no such thing as a “negative” vtime. Subtracting more than the task has accumulated doesn’t make the value small or negative — it wraps around near 2^64, producing an enormous number. The wraparound rule, stated plainly: a -= b on a u64 where b > a gives a - b + 2^64. So a moderate decrement on a task with a small accumulated vtime underflows to a value near 2^64, which the vtime-ordered DSQ treats as “schedule this task last, basically never” — the opposite of what you wanted. Push the decrement the other way (a small vtime that keeps winning) and the priority tasks monopolize the CPU and starve everyone else. Either way the symptom is the same end state: some runnable tasks never get dispatched, and the watchdog ejects your scheduler after ~30s.
To confirm the watchdog actually fired (rather than the box just being slow), watch two things. The backgrounded scx_simple process exits on its own and prints an exit reason to its terminal. On the kernel side, run this in another terminal to catch the disable message:
sudo dmesg -w | grep sched_ext
Within ~30s of the stall you’ll see a line of the form:
sched_ext: BPF scheduler "simple" disabled (runnable task stall ...)
The exact reason text varies by kernel version (a non-stall fault shows (runtime error) instead), but the BPF scheduler "..." disabled shape is constant. If scx_simple is still running and no such line appears, the watchdog has not ejected — the box is just slow.
Bound your decrement to reasonable values, or use a separate priority queue. (See “alternative: per-cgroup DSQs” below.)
Don’t break the watchdog
Make sure even priority tasks get dispatched promptly. Don’t, e.g., refuse to enqueue them. Don’t loop in dispatch waiting for “the right” task. The watchdog catches stalls regardless of why they happened.
Per-cgroup DSQ — a cleaner alternative
Instead of vtime tricks, give the priority cgroup its own DSQ that you consume from first:

#define PRIO_DSQ 1ULL
/* init creates a DSQ, and scx_bpf_create_dsq is a sleepable kfunc, so the
* callback MUST use BPF_STRUCT_OPS_SLEEPABLE — a plain BPF_STRUCT_OPS init
* won't load. */
s32 BPF_STRUCT_OPS_SLEEPABLE(simple_init)
{
/* This snippet REPLACES the stock simple_init, so it must still create
* SHARED_DSQ. SHARED_DSQ (#defined as 0 in scx_simple.bpf.c) is a
* user-created DSQ — id 0 routes through find_user_dsq, not a built-in
* global DSQ — so inserting into it without creating it first triggers a
* scx_bpf_error and the scheduler is ejected on the first non-priority
* enqueue. Create both. */
s32 ret = scx_bpf_create_dsq(SHARED_DSQ, -1);
if (ret)
return ret;
return scx_bpf_create_dsq(PRIO_DSQ, -1);
}
void BPF_STRUCT_OPS(simple_enqueue, struct task_struct *p, u64 enq_flags)
{
u64 vtime = p->scx.dsq_vtime;
bool priority = false;
if (priority_cgroup_id) {
struct cgroup *owned = scx_bpf_task_cgroup(p);
if (owned) {
int lvl;
bpf_for(lvl, 0, owned->level + 1) {
struct cgroup *anc = bpf_cgroup_ancestor(owned, lvl);
if (!anc)
continue;
if (anc->kn->id == priority_cgroup_id)
priority = true;
bpf_cgroup_release(anc);
if (priority)
break;
}
bpf_cgroup_release(owned);
}
}
if (priority)
scx_bpf_dsq_insert(p, PRIO_DSQ, SCX_SLICE_DFL, enq_flags);
else
scx_bpf_dsq_insert_vtime(p, SHARED_DSQ, SCX_SLICE_DFL, vtime, enq_flags);
}
void BPF_STRUCT_OPS(simple_dispatch, s32 cpu, struct task_struct *prev)
{
/* Priority queue first */
if (scx_bpf_dsq_move_to_local(PRIO_DSQ, 0)) return;
/* Fall back to default queue */
scx_bpf_dsq_move_to_local(SHARED_DSQ, 0);
}
Why must simple_init be BPF_STRUCT_OPS_SLEEPABLE and not plain BPF_STRUCT_OPS? Recall from Day 22 that struct_ops sleepable-ness is per-callback, and sched_ext exposes a sleepable subset: a callback declared BPF_STRUCT_OPS_SLEEPABLE may call kfuncs marked KF_SLEEPABLE; a non-sleepable callback may not, and the verifier rejects the load. scx_bpf_create_dsq is such a kfunc — kernel/sched/ext.c:8815 registers it BTF_ID_FLAGS(func, scx_bpf_create_dsq, KF_IMPLICIT_ARGS | KF_SLEEPABLE). So the “must be sleepable” claim is verifiable, not folklore — and the stock simple_init is already BPF_STRUCT_OPS_SLEEPABLE(simple_init) (scx_simple.bpf.c:134) for exactly this reason.
This is more deterministic than vtime tricks. Closer to how production schedulers work — strict priority lanes plus a default lane.
What to read in the kernel
-
kernel/sched/ext.c— searchscx_bpf_dsq_insertandscx_bpf_dsq_move_to_localto see how DSQ ops bind to internals. The functions are kfuncs registered forBPF_PROG_TYPE_STRUCT_OPSwith sched_ext-specific properties. -
kernel/sched/ext.c— searchscx_bpf_task_cgroup. The kfunc that returns a task’s cgroup pointer. -
tools/sched_ext/scx_central.bpf.c— production-grade example with multi-DSQ. Read after today’s exercise. -
tools/sched_ext/scx_flatcg.bpf.c— cgroup-aware scheduler. Read this if you’re interested in how production sched_ext schedulers handle cgroups at scale; note the samebpf_for(level, 0, cgrp->level + 1)ancestor idiom at line 207 andcgrp->kn->idused as a DSQ key at line 391. -
include/linux/cgroup-defs.h—struct cgroupdefinition. Note that there is noparentfield; the parent iscgrp->self.parent(acgroup_subsys_state *). The fields you commonly deref from BPF arecgrp->kn->id(the full 64-bit kernfs id) andcgrp->level. -
include/linux/kernfs.h— theu64 idfield (line 226) and thekernfs_id_ino()/kernfs_id_gen()helpers (lines 347/356). Theirsizeof(ino_t) >= sizeof(u64)branch is whyst_inoequals the id on 64-bit Linux but only carries the low 32 bits on a 32-bit kernel. -
Documentation/scheduler/sched-ext.rst— particularly the section on cgroup integration.
Bullet Points
- Modifying a sched_ext example is the fastest way to learn the API in depth.
- A cgroup v2 is a node in the single unified tree at
/sys/fs/cgroup;mkdirmakes a child, writing a PID tocgroup.procsmoves a task.struct cgroupcarriesint level(root = 0) and anancestors[]array indexed by level, so “find my ancestor at level N” is an O(1) array lookup. scx_bpf_task_cgroup(p)returns an acquired cgroup reference; walk ancestors withbpf_cgroup_ancestor(cgrp, level)(eachKF_ACQUIRE | KF_RET_NULL, so null-check then release every ref withbpf_cgroup_release()).struct cgrouphas noparentfield — the parent link iscgrp->self.parent, acgroup_subsys_state *— so don’t hand-roll acg->parentwalk; drivebpf_cgroup_ancestorwithbpf_for(lvl, 0, owned->level + 1).- Match on the full 64-bit
cgrp->kn->id— on 64-bit-ino_tLinux (x86-64, arm64) it equalsst_ino, sostatwould work; on a 32-bit-ino_tkernel the id packs(generation << 32) | inodeandst_inodrops the generation. Read it withname_to_handle_at()for a portable result that’s the full id on both. - A
const volatileglobal lives in.rodataas a frozen one-entry map: settable viaskel->rodata->...only between open and load, then read-only. The verifier treats it as a known constant and dead-code-eliminates theif (priority_cgroup_id)branch when it’s0— which is why an unset/wrong id silently compiles the feature out, and why the fail-loud guard matters. - Vtime is a
u64(p->scx.dsq_vtime): lower runs sooner, but a big decrement underflows near 2^64, not “negative” — either way runnable tasks stall and the watchdog ejects. - An init callback that calls a sleepable kfunc like
scx_bpf_create_dsq(registeredKF_SLEEPABLE) must beBPF_STRUCT_OPS_SLEEPABLE, not plainBPF_STRUCT_OPS. - Per-cgroup DSQs are cleaner than vtime tricks: separate priority lane consumed first.
- The watchdog catches mistakes — develop with confidence. Test under realistic load (
stress-ng+ benchmarks), not just synthetic timings.
Check question
If your priority cgroup gets too much CPU (starves other tasks for >30s), what happens?
Click to reveal answer
Answer: The watchdog ejects your scheduler. Other tasks have been runnable but undispatched (because you kept favoring priority tasks). The 30-second watchdog detects this and reverts to CFS. Fairness is restored automatically; the priority logic is gone until you reload.
The watchdog enforces a minimum service guarantee: no matter how clever your prioritization policy, every runnable task on the system must be dispatched within 30 seconds. If your policy can’t meet that, your scheduler is rejected.
This is good. It means you can experiment aggressively — try aggressive prioritization, see the watchdog kick in, refine. The recovery loop is short. In production schedulers (scx_layered, scx_lavd), aging logic explicitly bounds how long any task can wait, ensuring the watchdog never fires; that aging code is what distinguishes a “tested example” from a production scheduler.
Tomorrow
Day 27: read scx_central — production-grade BPF scheduler with central-dispatch architecture.
Day 27 — scx_central: read a real BPF scheduler
Today’s mission: read
scx_central.bpf.c— a more sophisticated sched_ext scheduler with central-dispatch architecture. Learn the cross-CPU machinery a real scheduler is built on: what an IPI actually is and the three flavors ofscx_bpf_kick_cpu, BPF queue maps, BPF timers and tickless preemption, how a DSQ id encodes a target CPU, why per-CPU kthreads jump the queue, and the dispatch-buffer batching limit. Understand the patterns experienced sched_ext authors use. Total time: ~110 minutes. Reading-heavy, not coding-heavy.
Why read this one
scx_simple (Days 25–26) is illustrative but trivial. It dispatches everything to one shared queue with vtime ordering — a thin shell over CFS-equivalent fairness. scx_central is the next step up: realistic. It handles per-CPU dispatch queues, cross-CPU coordination, central scheduling decisions, tickless preemption, and the kinds of details you’d hit on day one of writing a real scheduler.
Reading code that someone else wrote — and understanding why they wrote it that way — is a separate skill from writing your own. Today is for that skill.
But there’s a wrinkle. The real scx_central.bpf.c leans on five mechanisms no earlier day has taught: inter-processor interrupts, BPF queue maps, BPF timers, the SCX_DSQ_LOCAL_ON | cpu id trick, and a forward-progress hack for kernel threads. If you opened the file cold you’d hit twenty lines you have no framework for. So today is structured as background first, then the file. We teach each mechanism with intuition, then point at the exact line in the source where it earns its keep.
DSQ patterns: three architectures
Three architectures show up across the in-tree examples:
1. Global DSQ (scx_simple)
One queue, all CPUs pull from it. Easy to write. Suffers from cache locality (any task can run on any CPU) and lock contention at scale. Fine for ~few-CPU systems or low-rate scheduling. This is exactly what you read in scx_simple on Day 25 — everything goes into SHARED_DSQ, every CPU’s dispatch pulls from it.
2. Per-CPU DSQs
Each CPU has its own queue. Tasks inserted directly to the CPU they should run on; CPUs only pull from their own queue. Excellent cache locality. Cross-CPU coordination requires explicit logic — when one CPU’s queue is empty and another’s is full, the empty one steals work. This is what CFS does in C with elaborate load-balancing logic.
3. Central DSQ (scx_central)
One CPU is designated central. Other CPUs only consume from per-CPU DSQs. The central CPU runs the dispatch logic for everyone — handles enqueue, decides which CPU each task should go to, IPI-kicks the destination CPU when work arrives.
This sounds like a bottleneck — and it is — but the central architecture trades throughput for simplicity. All scheduling decisions live in one place; no cross-CPU coordination logic; the central CPU is just a single-threaded decision-maker. For research workloads or specialized scheduling (anti-thrashing, latency-priority queues, gang scheduling), this is often the easiest path to a correct scheduler.
That “IPI-kicks the destination CPU” phrase is doing a lot of work in that paragraph, and nothing so far has explained it. The whole central design is built on who kicks whom, with which flag. So that’s where we start.
Background 1 — IPIs and the three flavors of kicking
What an IPI is
Here is a fact that’s easy to forget because most code never confronts it: on a multi-core box, CPU A cannot directly run code on CPU B. A CPU only runs the instruction stream in front of it. If CPU 0 decides “CPU 5 should stop what it’s doing and reschedule,” CPU 0 has no way to reach into CPU 5 and make that happen by writing a variable.
The hardware mechanism that does let one CPU poke another is an IPI — inter-processor interrupt. CPU 0 writes to the interrupt controller saying “raise an interrupt on CPU 5.” CPU 5’s hardware traps into the kernel’s interrupt handler, and that handler, running on CPU 5, does the work — in our case, marks the current task as needing reschedule so CPU 5 picks a new task to run. An IPI is the cross-CPU coordination primitive the entire central design leans on. Every time this chapter says “kick a CPU,” it means “send that CPU an IPI so it re-enters the scheduler.”
scx_bpf_kick_cpu — and why it’s asynchronous
The kfunc your scheduler calls is scx_bpf_kick_cpu(cpu, flags). The signature in v7.1 is at kernel/sched/ext.c:8945:
/* kernel/sched/ext.c:8945 */
__bpf_kfunc void scx_bpf_kick_cpu(s32 cpu, u64 flags, const struct bpf_prog_aux *aux)
(The aux is a hidden implicit argument the kernel injects; from BPF you just call scx_bpf_kick_cpu(cpu, flags).)
Here’s the subtlety that explains a lot of the file’s shape: the kick does not happen synchronously inside the kfunc. You’re calling this from inside enqueue or dispatch, which already hold the runqueue lock for the current CPU. Sending an IPI and immediately processing it would risk nesting runqueue locks and deadlocking. So the kfunc just records the request and defers the work to a local irq_work (it queues kick_cpus_irq_workfn on the caller’s CPU). The comment is explicit at kernel/sched/ext.c:8902:
/* kernel/sched/ext.c:8902 */
/* Actual kicking is bounced to kick_cpus_irq_workfn() to avoid nesting
* rq locks ... */
The deferred handler kick_cpus_irq_workfn (kernel/sched/ext.c:7906) then walks the pending CPUs and calls resched_curr on each target via kick_one_cpu() / kick_one_cpu_if_idle() — that’s what sends the actual cross-CPU reschedule IPI, the function that marks “you need to reschedule.” So the model is: you ask; the kick lands a moment later, asynchronously. Keep that in mind every time you see a scx_bpf_kick_cpu call — it’s a request posted to a queue, not an instant context switch.
The three flags — they are different policies
flags is not a yes/no. The three SCX_KICK_* bits encode genuinely different policies. Their definitions and the kernel’s own comments are in kernel/sched/ext_internal.h:
/* kernel/sched/ext_internal.h:1201 */
SCX_KICK_IDLE = 1LLU << 0, /* nudge only if the CPU is idle / going idle; noop otherwise */
/* kernel/sched/ext_internal.h:1209 */
SCX_KICK_PREEMPT = 1LLU << 1, /* clear the running task's slice to 0 so dispatch runs NOW */
/* kernel/sched/ext_internal.h:1217 */
SCX_KICK_WAIT = 1LLU << 2, /* block until the target's current SCX task switches out */
SCX_KICK_IDLE— only wake the CPU if it’s idle (or about to go idle). If the target is already going to reschedule on its own, this is a no-op. Use it when you’ve given a CPU work and want it to notice, but you don’t want to disturb it if it’s already busy doing useful things.SCX_KICK_PREEMPT— force the issue. The kernel clears the currently-running SCX task’s->scx.sliceto zero so the task “expires” immediately and the dispatch path runs now. Use it when you need dispatch to happen promptly — e.g. fresh work just arrived and the central CPU must process it.SCX_KICK_WAIT— the call returns only after the target’s current SCX task switches out. This is for gang/core scheduling, where you need to know a sibling actually vacated.scx_centraldoesn’t use it; you should know it exists.
PREEMPT/WAIT and IDLE are mutually exclusive. ORing SCX_KICK_IDLE with either is a usage error, and the kernel raises scx_error for it:
/* kernel/sched/ext.c:8909 */
if (unlikely(flags & (SCX_KICK_PREEMPT | SCX_KICK_WAIT)))
scx_error(sch, "PREEMPT/WAIT cannot be used with SCX_KICK_IDLE");
And a flag value the older bullet list got wrong: flags == 0 is not “kick only if idle.” Zero means an unconditional reschedule kick with no special policy — neither the idle-only restriction nor the slice-clearing preemption. scx_central uses plain 0 exactly once, in init (tools/sched_ext/scx_central.bpf.c:355), purely to bootstrap the central CPU into its very first dispatch:
/* scx_central.bpf.c:355, in central_init */
scx_bpf_kick_cpu(central_cpu, 0);
Now you can read every kick site in the file and know why each picked the flag it did:
| Call site | Flag | Why |
|---|---|---|
central_enqueue (:131) | SCX_KICK_PREEMPT | new task queued — make central run dispatch promptly |
dispatch_to_cpu (:174) | SCX_KICK_IDLE | just fed a remote CPU work — wake it only if idle, don’t disturb a busy one |
central_dispatch self-retry (:251) | SCX_KICK_PREEMPT | dispatch buffer drained mid-fan-out — kick self to retry with a fresh buffer (see Background 6) |
non-central dispatch branch (:273) | SCX_KICK_PREEMPT | a CPU ran dry — force central to refill it now |
central_timerfn (:328) | SCX_KICK_PREEMPT | a CPU outran its slice — preempt it |
central_init (:355) | 0 | one-time bootstrap kick to start the central loop |
Background 2 — BPF queue maps
The hand-off from enqueue to dispatch in scx_central doesn’t go through a DSQ. It goes through a BPF queue map called central_q. No earlier day taught queue maps — Days 12–13 covered ringbuf and arrays, Day 21 covered kptrs — so here it is.
A BPF_MAP_TYPE_QUEUE (include/uapi/linux/bpf.h:1036) is a value-only FIFO. Unlike the hash and array maps you already know, it has no keys. You don’t look anything up; you push a value onto the back and pop the oldest off the front:
bpf_map_push_elem(&q, &val, flags)— append a value.bpf_map_pop_elem(&q, &val)— remove and return the oldest value.bpf_map_peek_elem(&q, &val)— look at the oldest without removing it.
(The uapi describes the QUEUE/STACK push/pop/peek semantics at include/uapi/linux/bpf.h:589, :598, :605. BPF_MAP_TYPE_STACK at :1037 is the LIFO sibling — same API, pops newest instead of oldest.)
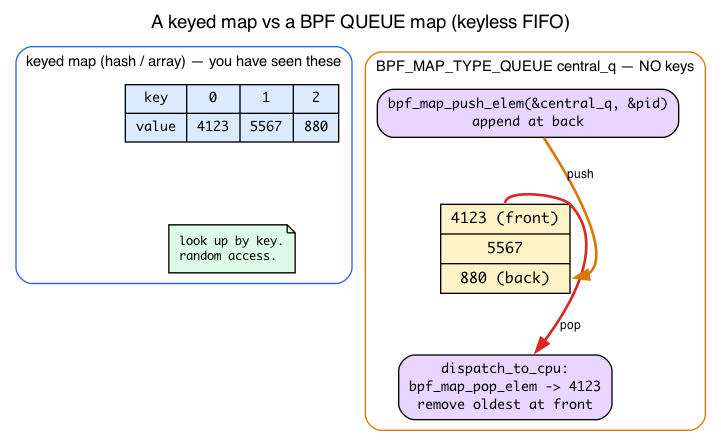
In scx_central the queue is declared at the top of the file holding raw s32 pids, 4096 deep:
/* scx_central.bpf.c:70 */
struct {
__uint(type, BPF_MAP_TYPE_QUEUE);
__uint(max_entries, 4096);
__type(value, s32);
} central_q SEC(".maps");
Two design choices worth noticing:
- It stores pids, not task pointers. Holding a refcounted
task_structacross the enqueue→dispatch boundary would mean acquiring and releasing a reference (the kptr dance from Day 21). Storing a bares32pid sidesteps that entirely; the pid is resolved back to a task only at pop time, viabpf_task_from_pid()(:145). - Why a queue map at all, instead of a DSQ? The file’s top comment is refreshingly honest (
scx_central.bpf.c:3): bouncing through one global BPF queue “isn’t the most straightforward… It’d be easier to bounce through per-CPU BPF queues. The current design is chosen to maximally utilize and verify various SCX mechanisms.” In other words,scx_centralis partly a test of SCX features. A more practical scheduler would do something simpler.
The push and pop are the literal backbone of the hand-off:
/* scx_central.bpf.c:122, in central_enqueue */
if (bpf_map_push_elem(¢ral_q, &pid, 0)) {
__sync_fetch_and_add(&nr_overflows, 1);
scx_bpf_dsq_insert(p, FALLBACK_DSQ_ID, SCX_SLICE_INF, enq_flags);
return;
}
/* scx_central.bpf.c:140, in dispatch_to_cpu */
if (bpf_map_pop_elem(¢ral_q, &pid))
break;
Always check the return of bpf_map_push_elem. A push can fail if the queue is full (4096 entries deep). When it does, scx_central falls back to the user DSQ FALLBACK_DSQ_ID and bumps nr_overflows. That fallback DSQ is only the overflow path — used here when the push fails (:122) and in one other spot when a task can’t run on its target CPU (:157, a cpumask mismatch). The normal path is always queue→pop.
Background 3 — BPF timers and tickless preemption
Here’s a puzzle. scx_central dispatches every task with an infinite time slice — SCX_SLICE_INF, which is literally U64_MAX:
/* include/linux/sched/ext.h:32 */
SCX_SLICE_INF = U64_MAX, /* infinite, implies nohz */
A task with an infinite slice never expires on its own. So what ever preempts it? In a normal scheduler, a periodic scheduler tick fires HZ times per second on every CPU and forces the running task to yield. But scx_central is built for tickless operation: on CONFIG_NO_HZ_FULL kernels, a CPU running a single task can stop its periodic tick entirely to cut overhead (you can watch the tick interrupts dwindle in /proc/interrupts). The file’s top comment spells this out at scx_central.bpf.c:16.
If the tick is off and slices are infinite, preemption has to come from somewhere else. That somewhere is a BPF timer.
What a BPF timer is
A bpf_timer is a kernel hrtimer you arm from BPF code. The lifecycle is a three-step dance, documented in kernel/bpf/helpers.c:1148:
/* kernel/bpf/helpers.c, comment block ~1143 */
/* bpf_timer_init() allocates 'struct bpf_hrtimer', inits hrtimer ...
* bpf_timer_set_callback() ... assign bpf callback_fn.
* bpf_timer_start() arms the timer. */
So in code: bpf_timer_init(&t, &map, CLOCK_MONOTONIC), then bpf_timer_set_callback(&t, fn), then bpf_timer_start(&t, interval_ns, flags). The callback fires later, in softirq/timer context — not inline at the call site. One hard rule: the struct bpf_timer must live inside a map value. The uapi struct is just a placeholder; the kernel allocates the real bpf_hrtimer behind it during bpf_timer_init, and the map owns it. That’s why scx_central wraps its timer in a one-element array map:
/* scx_central.bpf.c:80 */
struct central_timer {
struct bpf_timer timer;
};
struct {
__uint(type, BPF_MAP_TYPE_ARRAY);
__uint(max_entries, 1);
__type(key, u32);
__type(value, struct central_timer);
} central_timer SEC(".maps");
init does the init + set_callback (:352–:353), and the timer is armed via start_central_timer(). The interval is TIMER_INTERVAL_NS = 1 * MS_TO_NS — 1 ms.
The self-rearming trick
bpf_timer_start arms a one-shot timer. To get a periodic 1 ms tick, the callback re-arms itself at its own tail:
/* scx_central.bpf.c:331, last lines of central_timerfn */
bpf_timer_start(timer, TIMER_INTERVAL_NS, BPF_F_TIMER_CPU_PIN);
__sync_fetch_and_add(&nr_timers, 1);
Every 1 ms, central_timerfn (:293) wakes up, scans all CPUs, and for each non-central CPU checks: has the running task outrun its slice_ns, and is there work pending? If so, it kicks that CPU with SCX_KICK_PREEMPT (:328) to force a reschedule. The timer is the only source of preemption in this scheduler — without it, the first task to grab each CPU would run forever.
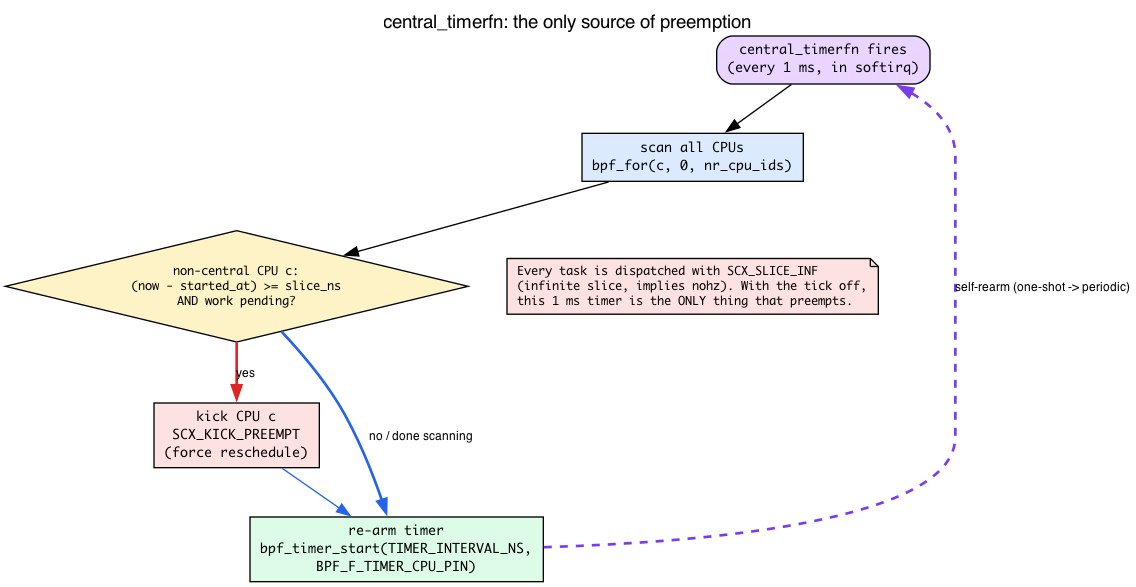
A graceful-degradation pattern worth stealing
The timer is armed with BPF_F_TIMER_CPU_PIN (include/uapi/linux/bpf.h:7665), which pins it to the calling CPU so it stays on central:
/* scx_central.bpf.c:198, in start_central_timer */
ret = bpf_timer_start(timer, TIMER_INTERVAL_NS, BPF_F_TIMER_CPU_PIN);
But BPF_F_TIMER_CPU_PIN is new (≥6.7). On an older kernel, bpf_timer_start returns -EINVAL. Rather than fail, scx_central retries unpinned and remembers it did:
/* scx_central.bpf.c:206 */
if (ret == -EINVAL) {
timer_pinned = false;
ret = bpf_timer_start(timer, TIMER_INTERVAL_NS, 0);
}
And because an unpinned timer might run on the wrong CPU, central_timerfn defensively checks at runtime (:300) and errors out if it finds itself off-central. This is a CO-RE-flavored “use the new feature if present, fall back cleanly if not” pattern — the comment even laments that the unnamed enum prevents using bpf_core_enum_value_exists() here.
Background 4 — encoding a target CPU into a DSQ id
On Day 25 you learned that DSQ ids name queues: SCX_DSQ_GLOBAL, SCX_DSQ_LOCAL, and custom numeric DSQs you create with scx_bpf_create_dsq. What you didn’t learn is that the id space is bit-tagged, and you can OR a CPU number into a built-in id to target a remote CPU’s queue. That trick is the heart of “central decides where each task runs.”
The id is a 64-bit value. Bit 63 is a flag marking the id as built-in rather than a user-created numeric DSQ:
/* include/linux/sched/ext.h:54 */
SCX_DSQ_FLAG_BUILTIN = 1LLU << 63,
SCX_DSQ_FLAG_LOCAL_ON = 1LLU << 62,
/* :58 */ SCX_DSQ_GLOBAL = SCX_DSQ_FLAG_BUILTIN | 1,
/* :59 */ SCX_DSQ_LOCAL = SCX_DSQ_FLAG_BUILTIN | 2,
/* :61 */ SCX_DSQ_LOCAL_ON = SCX_DSQ_FLAG_BUILTIN | SCX_DSQ_FLAG_LOCAL_ON,
So:
- User DSQs (like
FALLBACK_DSQ_ID = 0here, orSHARED_DSQfrom Day 25) are plain small numbers with the high bit clear. SCX_DSQ_LOCALmeans “the local DSQ of whichever CPU I’m currently on.” That’s allscx_simpleever used.SCX_DSQ_LOCAL_ONis the parameterized version: it sets bit 62, and you OR in the target CPU number in the low bits.SCX_DSQ_LOCAL_ON | 5means “CPU 5’s local DSQ” — a specific, possibly remote CPU.
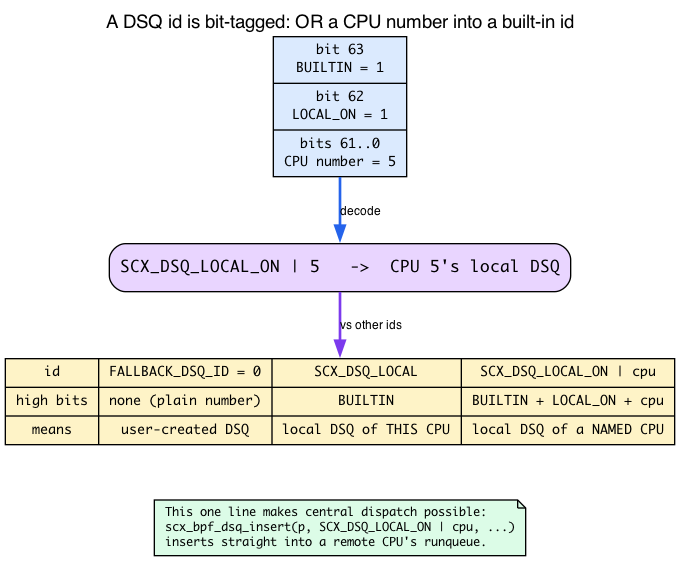
This is the one line that makes central dispatch possible. The central CPU inserts a task straight into a different CPU’s local runqueue and then kicks it:
/* scx_central.bpf.c:171, in dispatch_to_cpu */
scx_bpf_dsq_insert(p, SCX_DSQ_LOCAL_ON | cpu, SCX_SLICE_INF, 0);
Contrast with Day 25/26’s scx_simple, which only ever moved tasks to the current CPU’s local DSQ via scx_bpf_dsq_move_to_local. A per-CPU scheduler never needs LOCAL_ON | cpu because it only ever touches its own queue. Central needs it because it makes decisions for every CPU from one place. (One exception: per-CPU kthreads, which central inserts into SCX_DSQ_LOCAL — the current CPU’s queue — at :117; more on that next.)
Background 5 — per-CPU kthreads and the forward-progress trap
This is the single biggest thing the simplified pseudocode below hides, and it’s a correctness requirement, not an optimization. When you open the real central_enqueue you’ll find it does not push per-CPU kernel threads through central_q at all. Understanding why requires two new concepts.
What a kthread is. A kthread is a kernel thread — a task with no userspace address space, marked by PF_KTHREAD in p->flags:
/* include/linux/sched.h:1779 */
#define PF_KTHREAD 0x00200000 /* I am a kernel thread */
Some kthreads are per-CPU: pinned to exactly one CPU (p->nr_cpus_allowed == 1) to do that CPU’s housekeeping. ksoftirqd/N is the classic example — it processes CPU N’s softirq backlog.
The forward-progress trap, unique to central dispatch. Remember from Background 3 that the only thing preempting tasks is the BPF timer. And BPF timers fire in softirq context — which may run from ksoftirqd. Now picture the deadlock: a greedy user task is hogging a CPU. The timer that would preempt it needs ksoftirqd to run. But ksoftirqd is a normal task too — if the central scheduler queued it behind that same greedy user task, ksoftirqd can’t run, so the timer can’t fire, so nothing preempts the user task, so ksoftirqd never runs. The scheduler has wedged itself.
The fix: per-CPU kthreads skip the central queue entirely and go straight to the head of their own CPU’s local DSQ with an enqueue-time preempt flag, guaranteeing they always outrank user threads:
/* scx_central.bpf.c:115 */
if ((p->flags & PF_KTHREAD) && p->nr_cpus_allowed == 1) {
__sync_fetch_and_add(&nr_locals, 1);
scx_bpf_dsq_insert(p, SCX_DSQ_LOCAL, SCX_SLICE_INF,
enq_flags | SCX_ENQ_PREEMPT);
return;
}
SCX_ENQ_PREEMPT is an enqueue flag, not a kick flag. It rides along with a DSQ insert and means “preempt whatever is running on that local DSQ’s CPU to run this task.” Don’t confuse it with the SCX_KICK_* flags from Background 1 — those target a CPU via IPI; this one is a property of the insertion itself:
/* kernel/sched/ext_internal.h:1107 */
SCX_ENQ_PREEMPT = 1LLU << 32,
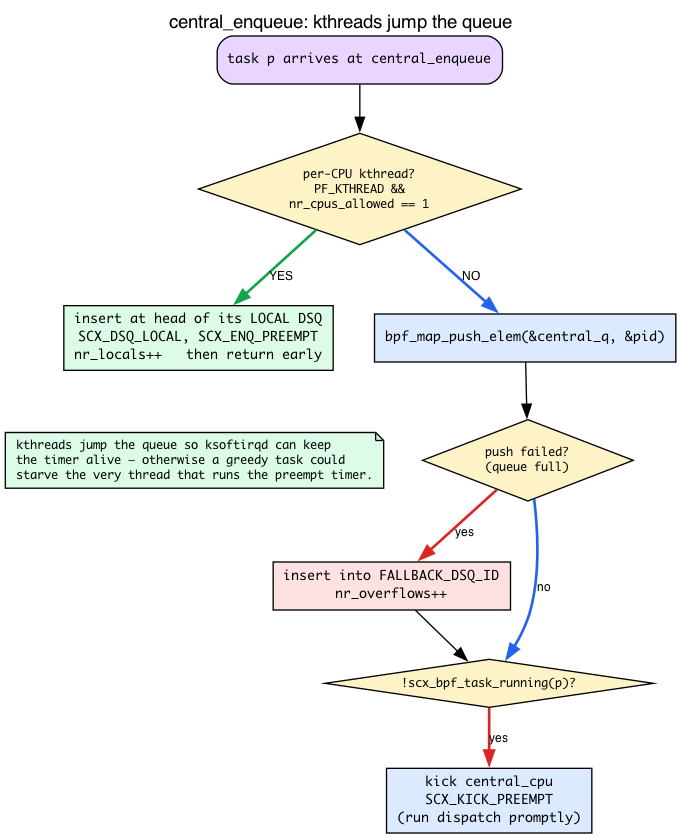
There are no Dumb Questions
Q: If the central CPU is a bottleneck, why not just run
dispatchon every CPU like a per-CPU scheduler? A: You can — that’s exactly whatscx_layered/scx_lavddo, and what “a more practical implementation” means in the file’s own top comment. The price is cross-CPU coordination logic: work stealing, per-CPU locking, deciding who refills whom. Central trades throughput for having all policy in one single-threaded place, which is far easier to get correct. It’s the right call for research and specialized scheduling, not for max scheduling rate.Q: Why store pids in
central_qinstead of task pointers? A: Atask_struct *is refcounted — holding one across the enqueue→dispatch boundary means the kptr acquire/release dance from Day 21. A bares32pid sidesteps refcounting entirely; the pid is resolved back to a task only at pop time viabpf_task_from_pid()(:145).
One more vtable flag this explains: SCX_OPS_ENQ_LAST. By default the kernel can skip calling your enqueue for the last runnable task on a CPU — an optimization, since there’s nothing to choose between. But central offloads all decisions, so “being the last task” means nothing special; it still must go through central’s logic. Setting SCX_OPS_ENQ_LAST (kernel/sched/ext_internal.h:130) forces enqueue even for that last task. The comment in the vtable explains it at scx_central.bpf.c:366.
Background 6 — the dispatch buffer and scx_bpf_dispatch_nr_slots()
The last mechanism. When you call scx_bpf_dsq_insert from inside a dispatch() callback, it does not commit immediately. Inserts are staged in a bounded per-CPU dispatch buffer and flushed by the core afterward. scx_bpf_dispatch_nr_slots() (kernel/sched/ext.c:8448) returns how many staged inserts you have left before that buffer is full.
Overflowing it is fatal — the core raises an error:
/* kernel/sched/ext.c:8139 */
scx_error(sch, "dispatch buffer overflow");
For most schedulers this never matters: they dispatch one or two tasks per call. But scx_central dispatches for every CPU in one pass through its bpf_for loop, so it can easily exhaust the buffer mid-fan-out. That’s why the loop checks slots and bails:
/* scx_central.bpf.c:230, in central_dispatch */
if (!scx_bpf_dispatch_nr_slots())
break;
And it’s why, after the fan-out, central may have skipped some CPUs and not yet dispatched for itself. The retry pattern is “I couldn’t finish; schedule myself to try again with a fresh buffer” — which ties straight back to Background 1:
/* scx_central.bpf.c:249 */
if (!scx_bpf_dispatch_nr_slots()) {
__sync_fetch_and_add(&nr_retries, 1);
scx_bpf_kick_cpu(central_cpu, SCX_KICK_PREEMPT); /* kick self, retry */
return;
}
The dispatch_to_cpu mismatch path checks slots too (:165), for the same reason: it just pushed a task onto the fallback DSQ without satisfying the target CPU, so it must stop before the next insert fails.
Reading scx_central.bpf.c
Now you have every mechanism the file uses. Open tools/sched_ext/scx_central.bpf.c — ~380 lines — and walk through it in this order: globals → init → select_cpu → enqueue → dispatch → vtable.
Repo lab: build and run the exact upstream scheduler
Like Day 25, the lab runs the unmodified in-tree scx_central. make -C ebpf/labs day27 builds it from the locked Linux v7.1 tree with the kernel’s own
tools/sched_ext Makefile, emitting artifacts under .output/:
Day 27 build wrapper: build the EXACT upstream scx_central from the locked
Linux v7.1 source tree, using the kernel’s own tools/sched_ext Makefile.
scx_central is read, not modified, on Day 27, so this builds the unmodified
in-tree example. O= redirects every artifact into .output/day27/build so the
pinned kernel source tree is never written to.
set -euo pipefail
HERE=$(cd – “$(dirname – “${BASH_SOURCE[0]}”)“ && pwd) ROOT=$(cd – “$HERE/..” && pwd)
SRC=$(“$ROOT/scripts/linux-source.sh” path) # verified locked v7.1 tree OUT=“$ROOT/.output/day27” VMLINUX_H=$(“$ROOT/scripts/kernel-btf.sh” sched-ext) BPFTOOL=$(“$ROOT/scripts/linux-bpftool.sh”)
mkdir -p “$OUT”
make -C “$SRC/tools/sched_ext” O=“$OUT”
BPFTOOL=“$BPFTOOL” VMLINUX_BTF=“$VMLINUX_H” VMLINUX_H=“$VMLINUX_H”
scx_central
BIN=“$OUT/build/bin/scx_central” test -x “$BIN” printf ‘day27: built upstream %s\n’ “$BIN”
run.sh loads it for a bounded interval on a disposable sched_ext-capable VM,
then ejects it — the central-dispatch scheduler drives every CPU from one, so it
is strictly opt-in:
Day 27 opt-in runner: load the exact upstream scx_central, let its central
CPU dispatch the whole machine for a bounded interval, then eject it cleanly.
scx_central makes ALL scheduling decisions from one CPU, so this is
deliberate: it refuses to run without EBPF_LABS_ALLOW_PRIVILEGED=1 and root,
bounds the run with a timeout, and a trap SIGINTs the scheduler on any exit so
CFS is restored. Run it only on a disposable, sched_ext-capable VM.
set -euo pipefail
HERE=$(cd – “$(dirname – “${BASH_SOURCE[0]}”)“ && pwd) ROOT=$(cd – “$HERE/..” && pwd) SCHED=“$ROOT/.output/day27/build/bin/scx_central” DURATION=${DURATION:-10} SCHED_PID=
fail() { printf ‘day27 run: %s\n’ “$*” >&2; exit 1; }
cleanup() { local status=$? trap - EXIT INT TERM if [[ -n $SCHED_PID ]] && kill -0 “$SCHED_PID” 2>/dev/null; then kill -INT “$SCHED_PID” 2>/dev/null || true wait “$SCHED_PID” 2>/dev/null || true fi exit “$status” } trap cleanup EXIT INT TERM
[[ ${EBPF_LABS_ALLOW_PRIVILEGED:-0} == 1 ]] || fail ‘set EBPF_LABS_ALLOW_PRIVILEGED=1 to acknowledge replacing the live scheduler’ [[ ${EBPF_LABS_ALLOW_SCHED_EXT:-0} == 1 ]] || fail ‘set EBPF_LABS_ALLOW_SCHED_EXT=1 to acknowledge replacing the live scheduler’ (( EUID == 0 )) || fail ‘run with sudo after setting both acknowledgement variables’ [[ -x $SCHED ]] || fail “missing $SCHED; run scripts/build-day.sh day27 first” [[ -r /sys/kernel/sched_ext/state ]] || fail ‘kernel has no sched_ext support’
“$SCHED” & SCHED_PID=$! sleep 1 kill -0 “$SCHED_PID” 2>/dev/null || fail ‘scheduler exited early (see its output above)’
printf ‘day27 run: scx_central active for %ss; state=%s\n’
“$DURATION” “$(cat /sys/kernel/sched_ext/state)”
sleep “$DURATION”
printf ‘day27 run: stopping; sched_ext state should return to disabled\n’
Heads-up: the code blocks below are simplified pseudocode, not literal quotes from the file. They capture the central-dispatch shape so you can follow the logic; the real
scx_central.bpf.cuses acentral_qqueue map of pids, per-CPU kthread bypass,SCX_DSQ_LOCAL_ON | cputargeting, slot checks, and abpf_timer— all taught in the Background sections above, and each### Nwalkthrough cross-links the relevant one. Read the simplified versions for intuition, then read the real file for the details.
1. Globals
Look near the top:
const volatile s32 central_cpu; /* which CPU is "central" — set from userspace */
const volatile u32 nr_cpu_ids = 1; /* number of CPUs; !0 for veristat, set during init */
const volatile u64 slice_ns; /* per-task slice the timer enforces */
central_cpu is set from userspace at attach time. Alongside these you’ll see the central_q queue map (Background 2), the central_timer array map (Background 3), and a pile of u64 counters (nr_total, nr_queued, nr_overflows, nr_timers, nr_retries, …) that the userspace driver prints as stats.
2. The init callback
s32 BPF_STRUCT_OPS_SLEEPABLE(central_init)
{
scx_bpf_create_dsq(FALLBACK_DSQ_ID, -1); /* the overflow DSQ */
bpf_timer_init(timer, ¢ral_timer, CLOCK_MONOTONIC);
bpf_timer_set_callback(timer, central_timerfn);
scx_bpf_kick_cpu(central_cpu, 0); /* bootstrap central's first dispatch */
return 0;
}
Three jobs: create the fallback DSQ, set up (but don’t yet arm) the timer, and fire one plain flags=0 kick to bootstrap the central CPU into its first dispatch. Because scx_bpf_create_dsq is a sleepable kfunc, the callback uses BPF_STRUCT_OPS_SLEEPABLE (not plain BPF_STRUCT_OPS) — a plain version won’t load. The timer is actually armed later, in start_central_timer() on the first dispatch (Background 3).
3. The select_cpu callback
s32 BPF_STRUCT_OPS(central_select_cpu, struct task_struct *p, ...)
{
/* Always steer to central_cpu. */
return central_cpu;
}
When a task wakes, route it to the central CPU. This is the key inversion: in scx_simple, tasks wake on whatever CPU last ran them. In scx_central, tasks wake on the central CPU so it can do all the dispatch work. The real comment notes this is safe because select_cpu is only a hint — if p can’t run on central, the kernel picks a fallback automatically.
4. The enqueue callback
void BPF_STRUCT_OPS(central_enqueue, struct task_struct *p, u64 enq_flags)
{
/* (real file) per-CPU kthreads jump the queue — see Background 5 */
/* push the pid into the central queue; central CPU will pick it up */
bpf_map_push_elem(¢ral_q, &pid, 0); /* on failure: fallback DSQ + nr_overflows++ */
/* make sure central CPU is awake to handle this */
if (!scx_bpf_task_running(p))
scx_bpf_kick_cpu(central_cpu, SCX_KICK_PREEMPT);
}
The real central_enqueue (:103) does three things in order: the per-CPU-kthread bypass (Background 5), the bpf_map_push_elem into central_q with a fallback-DSQ overflow path (Background 2), and finally — only if p isn’t already running — a SCX_KICK_PREEMPT at central so dispatch runs promptly (Background 1). It guards the kick with !scx_bpf_task_running(p) to avoid a redundant kick when the task is already on a CPU.
5. The dispatch callback
void BPF_STRUCT_OPS(central_dispatch, s32 cpu, struct task_struct *prev)
{
if (cpu == central_cpu) {
start_central_timer();
bpf_for(c, 0, nr_cpu_ids) {
if (!scx_bpf_dispatch_nr_slots()) /* Background 6 */
break;
/* if CPU c asked for work, pop a pid from central_q,
* resolve it, and insert into SCX_DSQ_LOCAL_ON | c, then
* kick c with SCX_KICK_IDLE */
dispatch_to_cpu(c);
}
/* ran out of slots? kick self with PREEMPT and retry */
/* otherwise dispatch one task for central itself */
} else {
/* non-central CPU: try the fallback DSQ; if dry, set gimme=true
* and kick central with PREEMPT to refill me */
}
}
Only central_cpu’s call into dispatch does real work. It arms the timer on first entry (Background 3), fans out to every CPU that asked for work via dispatch_to_cpu (Background 4 + 6), retries by kicking itself if the dispatch buffer drained (Background 6 + 1), then dispatches one task for itself. A non-central CPU that runs dry just flags gimme = true and kicks central with SCX_KICK_PREEMPT (:273) to get refilled.
6. The vtable
SCX_OPS_DEFINE(central_ops,
.flags = SCX_OPS_ENQ_LAST, /* Background 5 */
.select_cpu = (void *)central_select_cpu,
.enqueue = (void *)central_enqueue,
.dispatch = (void *)central_dispatch,
.running = (void *)central_running,
.stopping = (void *)central_stopping,
.init = (void *)central_init,
.exit = (void *)central_exit,
.name = "central");
In-tree schedulers don’t hand-write a SEC(".struct_ops.link") struct sched_ext_ops. They use the SCX_OPS_DEFINE(...) macro (from tools/sched_ext/include/scx/compat.bpf.h), which expands to exactly that — a SEC(".struct_ops.link") struct, which creates a link FD whose lifecycle is bound to the userspace process (it closes when userspace exits). Note the real file sets .flags = SCX_OPS_ENQ_LAST (Background 5) and adds .running, .stopping, and .exit callbacks: running/stopping record per-CPU started_at timestamps (:277, :285) so the timer can tell when a task has outrun its slice; exit records the exit info for userspace.
Why central architecture works
The central CPU is a bottleneck for scheduling decisions, but not for actual task execution. Tasks run on every CPU; only the decision of where to run is centralized. For workloads where:
- The total scheduling rate is bounded (hundreds of thousands to a few million decisions per second per central CPU).
- The scheduling logic benefits from global state (the central CPU sees all decisions, can apply global policy).
- Cache locality of the running task matters more than cache locality of the scheduling.
…this trades a single CPU’s worth of overhead for simpler, more correct scheduling logic.
For workloads where the scheduling rate exceeds what one CPU can sustain, you need per-CPU dispatchers (scx_layered, scx_lavd, real production schedulers). The file’s own top comment agrees: “A more practical implementation would likely put the scheduling loop outside the central CPU’s dispatch() path and add some form of priority mechanism.”
scx_flatcg — read after this one
If you have appetite for more reading, open tools/sched_ext/scx_flatcg.bpf.c. ~950 lines. Same shape as scx_central but cgroup-aware: each cgroup gets its own DSQ; vtime is per-cgroup; dispatch picks the cgroup with the lowest vtime first.
This is closer to how a real “fair-share + isolation” scheduler looks — like CFS with cgroup awareness, but in BPF.
What to read in the kernel
-
tools/sched_ext/scx_central.bpf.c— the file we just walked through. Read end to end with the diagrams and the six Background sections as a guide. Pay special attention tocentral_enqueue(:103),dispatch_to_cpu(:134),central_dispatch(:219), andcentral_timerfn(:293). -
tools/sched_ext/scx_central.c— the userspace driver. ~125 lines. Note how it setscentral_cpubefore attach and runs a stats loop printing thenr_*counters. -
tools/sched_ext/scx_flatcg.bpf.c— the cgroup-aware scheduler. Read after central. Notice the per-cgroup vtime tracking. -
kernel/sched/ext.c— search forscx_bpf_kick_cpu(:8945). The kfunc that triggers an IPI. Read how the kick is bounced tokick_cpus_irq_workfn(:7906) and lands onresched_curr. Also readscx_bpf_dispatch_nr_slots(:8448) and the “dispatch buffer overflow” error (:8139). -
kernel/sched/ext_internal.h— theSCX_KICK_*flag definitions with their comments (:1201,:1209,:1217),SCX_OPS_ENQ_LAST(:130), andSCX_ENQ_PREEMPT(:1107). -
include/linux/sched/ext.h— the DSQ id bit-encoding (SCX_DSQ_FLAG_BUILTIN:54,SCX_DSQ_LOCAL_ON:61) andSCX_SLICE_INF(:32). -
include/scx/common.bpf.hintools/sched_ext/include/scx/— kfunc declarations. The “API” your BPF scheduler can call. -
Documentation/scheduler/sched-ext.rst— particularly the section on patterns and best practices.
Today’s experiment
You don’t write a scheduler today. You watch the one you just read.
Watch the central timer’s tick
scx_central arms a 1 ms self-rearming BPF timer. Trace its callback firing:
sudo bpftrace -e 'kfunc:bpf_timer_start { @[comm] = count(); } interval:s:5 { exit(); }'
(You’ll see timer arming activity across the system; the central scheduler’s re-arm at :331 shows up when it’s loaded.)
Watch IPIs fly
The whole architecture is built on cross-CPU kicks. Watch reschedule IPIs per CPU:
sudo cat /proc/interrupts | grep -i 'rescheduling\|Function call\|Local timer'
Run it twice a few seconds apart and diff the counts. Under a central scheduler the kicked CPUs accumulate reschedule interrupts driven from the central CPU. On a NO_HZ_FULL kernel, also note how the local timer (LOC) interrupt counts on a single-task CPU stay nearly flat — that’s tickless operation, the thing SCX_SLICE_INF enables. (If no scx scheduler is loaded the LOC line may simply read 0 on idle CPUs.)
Observe the kick flags in the source
No tool needed — just confirm the table from Background 1 against the file:
grep -n 'scx_bpf_kick_cpu' ~/code/linux/tools/sched_ext/scx_central.bpf.c
Six hits: :131 (PREEMPT), :174 (IDLE), :251 (PREEMPT, retry self), :273 (PREEMPT), :328 (PREEMPT), :355 (0). Read each in context and say out loud why it picked that flag.
Bullet Points
scx_centralshows the central-dispatch pattern: one CPU makes all scheduling decisions; others consume from per-CPU DSQs and kick central when they run dry.- An IPI (inter-processor interrupt) is how one CPU forces another into the kernel to reschedule.
scx_bpf_kick_cpu(cpu, flags)posts a kick asynchronously (bounced tokick_cpus_irq_workfnto avoid nesting rq locks).SCX_KICK_IDLE= nudge only if idle;SCX_KICK_PREEMPT= clear the slice and run dispatch now;SCX_KICK_WAIT= block until the target switches out. PREEMPT/WAIT can’t be ORed with IDLE.flags == 0is a plain unconditional reschedule kick (used once, to bootstrap central), not idle-only. - A
BPF_MAP_TYPE_QUEUEis a keyless FIFO:bpf_map_push_elem/bpf_map_pop_elem.central_qholds raw pids (not task pointers) for the enqueue→dispatch hand-off; always check the push return and fall back on overflow. - A
bpf_timerlives in a map value and is armed with init → set_callback → start; the callback runs later in softirq context and re-arms itself for a periodic tick. With every task onSCX_SLICE_INF(infinite slice, implies nohz / tickless), the 1 ms timer is the only source of preemption. - DSQ ids are bit-tagged: bit 63 marks built-in ids.
SCX_DSQ_LOCAL_ON | cpunames a specific CPU’s local DSQ, which is how central inserts into a remote CPU’s runqueue. - Per-CPU kthreads (
PF_KTHREAD && nr_cpus_allowed == 1) bypass the central queue and go to their local DSQ head withSCX_ENQ_PREEMPT— a correctness requirement soksoftirqd(which runs the timer) can’t be starved.SCX_OPS_ENQ_LASTforcesenqueueeven for the last runnable task, since central decides everything. scx_bpf_dispatch_nr_slots()bounds how manyscx_bpf_dsq_inserts you can stage per dispatch; overflowing it is fatal, so central’s fan-out checks slots and kicks itself to retry when the buffer drains.SEC(".struct_ops.link")(via theSCX_OPS_DEFINEmacro) creates link-managed scheduler instances; closes with the userspace process.- Read order: globals → init → select_cpu → enqueue → dispatch → vtable.
- scx_flatcg is the next step up: cgroup-aware fair-share with per-cgroup DSQs.
Check question
In scx_central, every task wake-up is routed to central_cpu. Why doesn’t this catastrophically increase wake-up latency?
Click to reveal answer
Answer: Because select_cpu returning central_cpu doesn’t actually run the task there — it just routes the enqueue and dispatch logic to that CPU. The task itself is dispatched (in the dispatch callback’s loop) to whichever CPU has capacity. The central CPU is a policy bottleneck, not a mechanism bottleneck.
The flow:
- Task
Twakes up.select_cpu(T)returnscentral_cpu→ kernel’s wake-up logic targets central_cpu. - Central CPU’s
enqueue(T)runs: pushes T’s pid ontocentral_q, kicks central_cpu withSCX_KICK_PREEMPT(no-op if T is already running). - Central CPU’s
dispatch()callback runs (because the kernel just gave central CPU its slot back): pops T’s pid fromcentral_q, resolves it withbpf_task_from_pid(), decides “T should run on CPU 5,” places T on CPU 5’s local DSQ viascx_bpf_dsq_insert(T, SCX_DSQ_LOCAL_ON | 5, ...), and kicks CPU 5 withSCX_KICK_IDLE. - CPU 5’s interrupt handler reschedules, CPU 5 consumes T from its local DSQ, runs T.
So T actually runs on CPU 5. The central CPU’s overhead is one trip through dispatch logic plus an IPI; T’s wake-up latency is ~microseconds, dominated by IPI delivery (which, recall, is itself bounced through an irq_work — asynchronous, not instant).
The bottleneck only matters at the rate of scheduling decisions: one CPU’s worth of decision-making caps the system somewhere in the range of hundreds of thousands to a few million scheduling events per second. Past that, you need per-CPU dispatchers.
Tomorrow
Days 28–30: capstone. Pick one project, build it, ship it.
Days 28–30 — Capstone
Mission: ship one substantial BPF project that consolidates everything from Days 1–27. Along the way, learn the four pieces of background the project options lean on but nothing earlier taught you outright: how to build a latency histogram by hand in BPF (and the truth about
lhist), the token-bucket rate-limiting algorithm, how a BPF iterator emits output that userspace reads like a file, and what an EWMA actually is. Three days, ~7–10 hours total.
This isn’t a lab. It’s your project. The point is to build something end-to-end without a guide, while the muscle memory from Days 1–27 is fresh.
But there’s a trap in “build it without a guide.” Each of the five options below name-drops a technique the earlier days used but never taught the construction of. Option A says “histogram-bucket via lhist” — and you’ll go looking for an lhist helper that does not exist. Option B says “token bucket in percpu hash” — an algorithm Day 23 only mentioned by name. Option E says “emit via bpf_seq_printf… read it like a file” — a whole iterator/seq_file mechanism the book has only gestured at. Option C says “track RTT EWMA” — a term Day 23 repeats without ever defining.
So before you pick, this chapter teaches those four prerequisites properly: intuition first, then the concrete v7.1 source. After that, the five options and the three-day plan are exactly as designed.
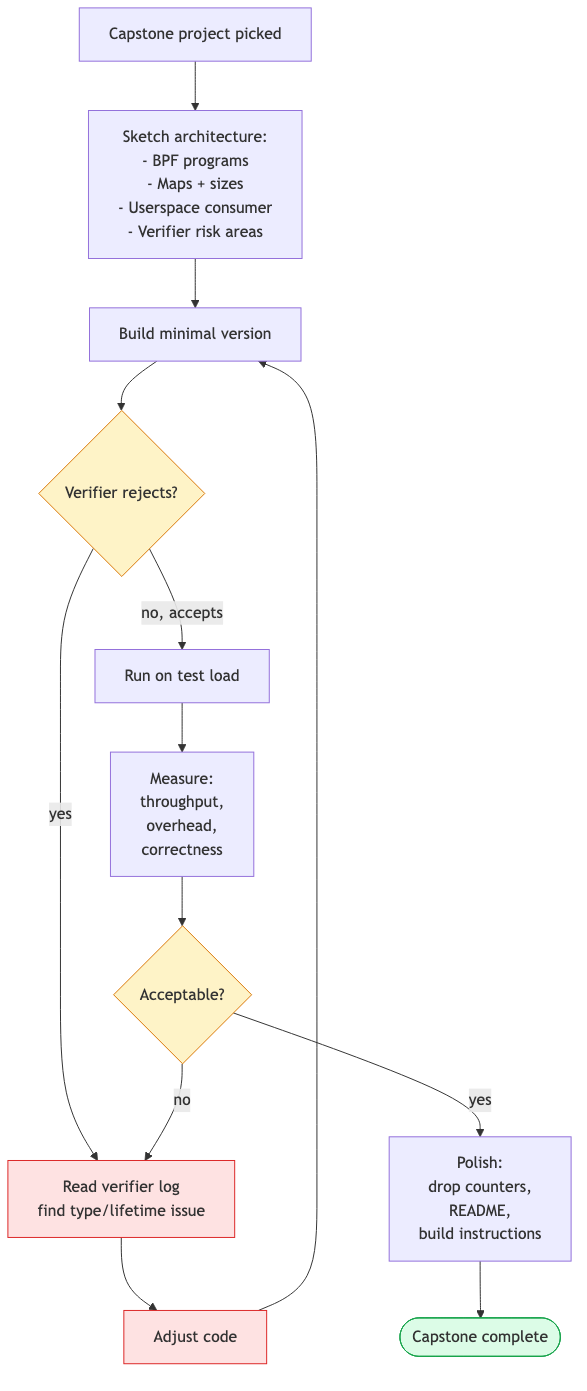
The development loop, again:
- Sketch (1 hour). Write a one-page README before any code.
- Build minimal version that compiles and loads (3–4 hours). Get to “loads cleanly” first; functionality second.
- Verifier rejects? Read log; identify type/lifetime issue; fix. Often 30–60 minutes per cycle on first attempts.
- Test on realistic load (1 hour). Synthetic benchmarks lie; real workloads reveal bugs.
- Polish (1–2 hours). Drop counters, README, build instructions, one screenshot.
Prerequisite 1: building a latency histogram in BPF — and the truth about lhist
Option A’s whole reason to exist is a latency tracer with a histogram. Its skeleton says “histogram-bucket via lhist.” Stop right there, because this is the single most common wrong turn on this capstone.
There is no lhist helper in libbpf/CO-RE BPF. lhist and hist are bpftrace builtins — they exist inside the bpftrace language (you used them in the Day 1 headroom experiment of the networking book and in bpftrace -e '... = lhist(...)' one-liners). They are not BPF helpers you can call from a hand-written .bpf.c program. When you write a libbpf program, you build the histogram yourself. If you go hunting for a bpf_lhist() in bpf_helpers.h, you’ll waste an hour. Don’t.
So how do you build one? The intuition first.
The intuition: an array of counters, one per power-of-two
A histogram is just counting how many samples fell into each bucket. For latencies, the useful buckets are powers of two: 0–1 ns, 1–2, 2–4, 4–8, … up to seconds. A latency that’s “around 4 microseconds” and one that’s “around 4.1 microseconds” belong in the same bucket; you don’t care about the exact nanosecond, you care about the order of magnitude.
That means: declare a small fixed-size array — say 64 u64 slots, one per power-of-two bucket. For each event, compute which slot it belongs in (slot = floor(log2(duration))) and add one to that slot. At the end, userspace reads the whole array once and prints bars.
Recall from Day 2 that __sync_fetch_and_add(p, 1) on a map value is the lock-free counter primitive — the lookup hands you an unlocked live pointer, so concurrent CPUs racing on the same slot would lose counts without an atomic. The histogram is the same tool, new shape: instead of one counter keyed by PID, it’s an array of counters indexed by log2(duration). One atomic increment per event.
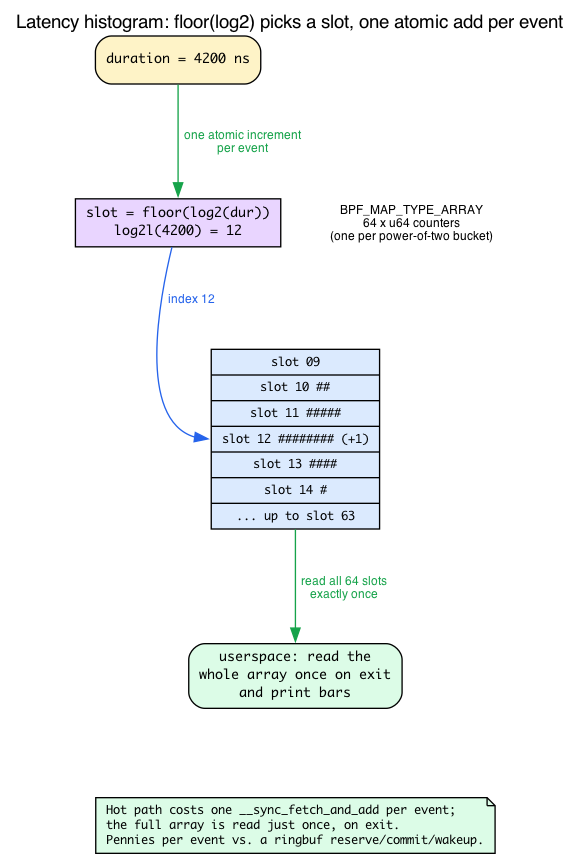
Why this scales where ringbuf doesn’t
This is the crucial performance point, and it’s why a histogram is the right tool for Option A’s hot path. A ringbuf event (Day 13) costs a reserve + commit + a userspace wakeup per event. A histogram increment costs one atomic add per event, and exactly one array read for the entire run, on exit. Histograms are pennies; per-event emission is dollars. That’s why real tracers like biolatency/funclatency/runqlat aggregate into histograms in-kernel; the per-event-ringbuf-for-outliers hybrid is the extra step Option A asks you to add on top.
The concrete v7.1 code: branchless log2
Here’s the part that surprises people: you can’t just call log2() from libm — BPF has no libc, and the verifier hates unbounded loops, so a naive “shift until zero” loop is a fight. The in-tree samples solve it with a branchless shift-and-test idiom. This is the canonical implementation, straight from ~/code/linux/samples/bpf/lwt_len_hist.bpf.c:24:
/* samples/bpf/lwt_len_hist.bpf.c:24 — 32-bit branchless log2 */
static unsigned int log2(unsigned int v)
{
unsigned int r;
unsigned int shift;
r = (v > 0xFFFF) << 4; v >>= r;
shift = (v > 0xFF) << 3; v >>= shift; r |= shift;
shift = (v > 0xF) << 2; v >>= shift; r |= shift;
shift = (v > 0x3) << 1; v >>= shift; r |= shift;
r |= (v >> 1);
return r;
}
Read it as a binary search over the bit position: “is the value bigger than 16 bits? then the answer is at least 16, shift those off and keep going.” No loop, no branch the verifier can’t fold — five comparisons, done. Latencies are 64-bit nanoseconds, so you need the 64-bit version, which splits the value into hi/lo 32-bit halves (~/code/linux/samples/bpf/lwt_len_hist.bpf.c:37):
/* samples/bpf/lwt_len_hist.bpf.c:37 — 64-bit: log2 of the high half + 32, else the low half */
static unsigned int log2l(unsigned long v)
{
unsigned int hi = v >> 32;
if (hi)
return log2(hi) + 32;
else
return log2(v);
}
And the increment is exactly the Day 2 pattern — lookup the slot, null-check, atomic-add (~/code/linux/samples/bpf/lwt_len_hist.bpf.c:46):
/* samples/bpf/lwt_len_hist.bpf.c:46 — key = log2l(len), increment that slot */
SEC("len_hist")
int do_len_hist(struct __sk_buff *skb)
{
__u64 *value, key, init_val = 1;
key = log2l(skb->len);
value = bpf_map_lookup_elem(&lwt_len_hist_map, &key);
if (value)
__sync_fetch_and_add(value, 1);
else
bpf_map_update_elem(&lwt_len_hist_map, &key, &init_val, BPF_ANY);
return 0;
}
That sample uses a hash keyed by the log2 value; for a dense 0–63 histogram a BPF_MAP_TYPE_ARRAY (or PERCPU_ARRAY) of 64 slots is even cheaper — direct index, no hashing.
Decade-scaled buckets (optional polish). Powers of two give you ~3 buckets per order of magnitude, which is a bit coarse for a latency display. ~/code/linux/samples/bpf/tracex3.bpf.c:39 shows the trick to rescale into ~10 buckets per decade using the identity log10(x)*10 = log2(x)*3:
/* samples/bpf/tracex3.bpf.c:39 */
static unsigned int log2l(unsigned long long n)
{
#define S(k) if (n >= (1ull << k)) { i += k; n >>= k; }
int i = -(n == 0);
S(32); S(16); S(8); S(4); S(2); S(1);
return i;
#undef S
}
with the comment block at tracex3.bpf.c:78 documenting the decade scaling (index = 29 ~ 1 usec, index = 59 ~ 1 msec, index = 89 ~ 1 sec) via index = (l * 64 + (delta - base) * 64 / base) * 3 / 64. Use the simple powers-of-two version first; reach for this only when polishing the display.
Per-stack-id histograms (what Option A actually asks for)
Option A wants the histogram bucketed by stack id — a separate latency distribution per call site. That’s a one-line change in shape: instead of keying the map by slot alone, key it by the pair (stackid, slot). The stackid comes from bpf_get_stackid() exactly as you used it on Day 9 to aggregate by stack. So:
- a struct key
{ __u32 stackid; __u32 slot; }, slot = log2l(duration_ns),__sync_fetch_and_addon the looked-up value.
Userspace reads the whole map once, groups rows by stackid, and prints one histogram per stack — connecting Day 9’s stackid aggregation to today’s log2 bucketing. The outliers (above your threshold) still emit per-event via ringbuf with full kernel+user stacks; the histogram handles the common case for pennies.
Prerequisite 2: the token-bucket rate-limiting algorithm
Option B’s skeleton says “per-source-IP rate limiting (token bucket in percpu hash).” Day 23 told you “rate-limiting filters in BPF are essential” and moved on — it never showed the algorithm. Here it is, because you can’t build B without it.
The intuition: a bucket that refills at a fixed rate
Picture a bucket that holds tokens. It has a capacity (the burst size — say 100 tokens) and a refill rate (say 50 tokens/sec). Tokens drip in continuously up to the capacity ceiling; they never overflow past it. Every arriving packet must take one token: if a token is available, the packet passes and the token is consumed; if the bucket is empty, the packet is dropped.
This gives you exactly the behavior you want from a rate limiter: a burst of up to capacity packets is allowed instantly (the bucket was full), but the sustained rate is capped at the refill rate, because that’s how fast tokens come back.
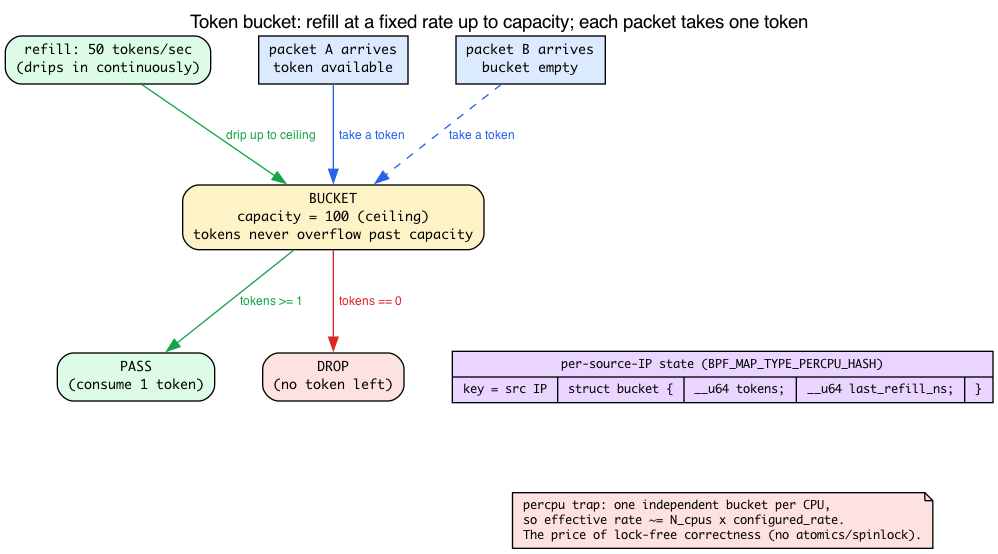
The math: lazy refill on each packet
You don’t run a timer dripping tokens in. That’d be wasteful. Instead you refill lazily, computing how many tokens would have accumulated since you last looked. Each key (source IP) stores just two fields:
struct bucket {
__u64 tokens; /* tokens currently available (fixed-point or whole) */
__u64 last_refill_ns; /* timestamp of the last refill */
};
On each packet:
now = bpf_ktime_get_ns()elapsed = now - last_refill_nstokens += elapsed * rate / 1000000000(tokens that accrued since last time), capped at capacitylast_refill_ns = now- if
tokens >= 1: consume one (tokens -= 1), PASS; else DROP
The clock in step 1 is bpf_ktime_get_ns(), the monotonic nanosecond clock — ~/code/linux/kernel/bpf/helpers.c:178 (BPF_CALL_0(bpf_ktime_get_ns)), which is ktime_get_mono_fast_ns() and NMI-safe. There’s a boot-inclusive sibling at ~/code/linux/kernel/bpf/helpers.c:190 (BPF_CALL_0(bpf_ktime_get_boot_ns)); the difference is that the boot variant keeps counting across suspend. For a rate limiter, monotonic (get_ns) is what you want — you’re measuring short intervals, and you don’t want a suspend to suddenly “refill” the bucket to full. Mention it only if your reader’s tracer needs wall-vs-uptime semantics.
The percpu trap (read this before you benchmark)
Option B says “percpu hash,” and that choice has a subtlety that will surprise you on the benchmark if nobody warns you: a per-CPU map keeps one independent bucket per CPU. A source IP hashing to a given key has N separate buckets, one per logical CPU, and a packet only ever touches the bucket on the CPU it landed on (recall the per-CPU memory model from Day 2 — same key, physically different memory per CPU). So the effective global rate is roughly N_cpus × configured_rate. Configure 50 tokens/sec on an 8-CPU box and your attacker can push ~400/sec.
Is that a bug? No — it’s a deliberate trade. The reason to pick percpu here is lock-free correctness: with a per-CPU map there is no cross-CPU race on the bucket, so you need no atomics and no spinlock on the value. A shared hash would force you to either atomically CAS the {tokens, last_refill} pair or take a bpf_spin_lock on the value — slower, and contended exactly when you’re under attack. Percpu sidesteps all of that. The cost is precision: it’s coarse DoS protection, not an exact global limiter. Call this out in your README so your benchmark numbers don’t look like a bug. If you need a precise global limit, that’s a shared hash with a spin-locked value — note the trade and move on.
Where it fits with Day 15
Connect it back: Day 15’s LPM-trie denylist is the static allow/deny decision (is this CIDR banned, yes/no). The token bucket is the dynamic per-source throttle layered on top (this IP is allowed, but not at that rate). Option B’s full design is: XDP program does LPM lookup first (drop if denied), then token-bucket check (drop if over rate), then PASS — and tcx egress logs the drops. Two map types, two jobs, one packet path.
Prerequisite 3: how a BPF iterator emits output, and how userspace reads it like a file
Option E is built entirely on a mechanism the book has only gestured at: a SEC("iter/task") program that walks every task, “emits via bpf_seq_printf,” and is read by userspace “like a file.” Day 12 mentioned iter.s/task only as an example of a sleepable SEC name — its real subject was page faults. The seq_file emit/read machinery is new, so here it is.
The intuition: pulled, not pushed
Every tracing program you’ve written so far pushes events: something happens in the kernel, your program fires and shoves a record into a ringbuf, userspace drains it. An iterator is the opposite — it’s pulled by userspace. Userspace says “give me the next chunk of output” via read(), and the kernel runs your BPF program on demand to produce that chunk. No ringbuf, no wakeups, no drops. This is the underused capability Option E showcases.
The kernel side: one call per object, plus a NULL footer
An iterator program receives a context whose ctx->meta->seq is a kernel struct seq_file — a growable text buffer. You write into it with the BPF_SEQ_PRINTF(seq, fmt, ...) macro. The exact context Option E’s program receives is ~/code/linux/kernel/bpf/task_iter.c:170:
/* kernel/bpf/task_iter.c:170 */
struct bpf_iter__task {
__bpf_md_ptr(struct bpf_iter_meta *, meta);
__bpf_md_ptr(struct task_struct *, task);
};
The kernel invokes your program once per object being iterated (one call per task), and then one final call with the object pointer NULL so you can emit a footer or summary. Two idioms fall out of that, both visible in the reference program ~/code/linux/tools/testing/selftests/bpf/progs/bpf_iter_tasks.c:20:
/* tools/testing/selftests/bpf/progs/bpf_iter_tasks.c:20 */
SEC("iter/task")
int dump_task(struct bpf_iter__task *ctx)
{
struct seq_file *seq = ctx->meta->seq;
struct task_struct *task = ctx->task;
static char info[] = " === END ===";
if (task == (void *)0) { /* end-of-iteration: emit footer */
BPF_SEQ_PRINTF(seq, "%s\n", info);
return 0;
}
if (ctx->meta->seq_num == 0) /* first call: emit header row */
BPF_SEQ_PRINTF(seq, " tgid gid\n");
BPF_SEQ_PRINTF(seq, "%8d %8d\n", task->tgid, task->pid);
return 0;
}
task == NULL⇒ you’re past the last task; emit the footer/summary.ctx->meta->seq_num == 0⇒ this is the first invocation; emit the header row exactly once.
The BPF_SEQ_PRINTF macro is backed by the bpf_seq_printf helper at ~/code/linux/kernel/trace/bpf_trace.c:458 (BPF_CALL_5(bpf_seq_printf, struct seq_file *m, ...)), which validates the format/args and calls seq_bprintf(m, ...) to append into the buffer.
The userspace side: read the iter fd like a file
This is the “read it like a file” part. Userspace:
- attaches the program to get an iter link,
- calls
bpf_iter_create(link_fd)to get an fd, read()s that fd in a loop until EOF.
Each read() makes the kernel run your BPF program enough times to fill the read buffer, draining task by task. When the iteration is exhausted, read() returns 0 (EOF). That’s literally all “read it like a file” means — and it’s why iterators need no ringbuf: the buffering is the seq_file, and the pacing is the read() syscall.
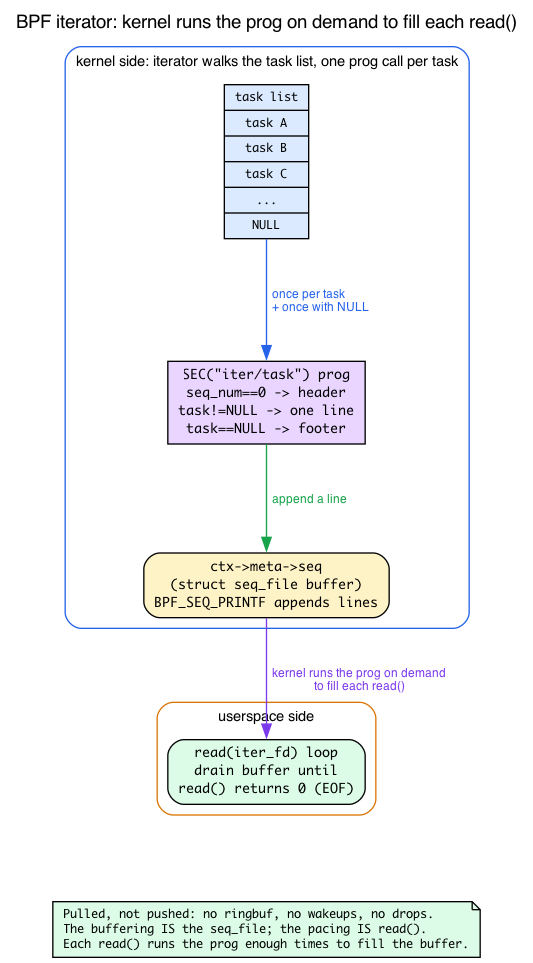
Why sleepable matters here
Day 12 established that iter.s/task is sleepable. That pays off in an iterator: while walking tasks you may want to read the walked task’s user memory (e.g., its argv, a cgroup path string) with bpf_copy_from_user_task, a sleepable-only helper. Be careful which helper you reach for: bpf_copy_from_user reads current’s address space, and during an iterator walk current is the userspace process doing the read(), not ctx->task — so it would silently read the wrong process. bpf_copy_from_user_task(dst, size, user_ptr, task, flags) (helpers.c:682) takes the target task_struct and uses access_process_vm(tsk, …) to read that task’s memory; pass ctx->task. Because the iterator runs in process context (driven by a read() syscall), it can sleep — so it can call those helpers a hot-path tracer cannot. That’s the tie-back to Day 12; no need to re-explain sleepability.
Prerequisite 4: what an EWMA is (one paragraph — see Day 23 for the CC context)
Option C says “modify bpf_dctcp to track RTT EWMA, branch on a threshold.” Day 23 says “alpha EWMA” repeatedly but never defines the term. Quick refresher (the congestion-control context is Day 23’s territory, so this stays short):
An EWMA (exponentially weighted moving average) is a single-variable smoother: avg = avg + ((sample - avg) >> shift) (the parentheses matter — without them, +/- bind tighter than >> and the running average is discarded). It weights recent samples more heavily than old ones, and — crucially for BPF — it needs no array of history, just one number per socket. The >> shift is the weight: a bigger shift means slower adaptation. You can see the exact pattern in the kernel’s own dctcp at ~/code/linux/tools/testing/selftests/bpf/progs/bpf_dctcp.c:44 (the per-socket state __u32 dctcp_alpha;), updated at bpf_dctcp.c:131 as alpha -= min_not_zero(alpha, alpha >> dctcp_shift_g) — that’s (1-g)*alpha in fixed point, the EWMA decay step. For Option C you read srtt_us off the tcp_sock and feed it into your own EWMA. That field is ~/code/linux/include/linux/tcp.h:307: u32 srtt_us; /* smoothed round trip time << 3 in usecs */. Note the << 3: it’s already in eighths of a microsecond, and it’s already an EWMA — the kernel smooths RTT for you. So your EWMA is a coarser smoother layered on an already-smoothed signal; keep that in mind when you tune the 1 ms threshold, or you’ll chase noise that isn’t there.
Pick one
Five suggested projects, ordered roughly from “consolidates earlier days” to “frontier / harder.”
Option A: Latency tracer with histogram and outlier flame graphs
What: Generic latency tracer for any kernel function (chosen via env var). Histogram bucketed by stack id. Outliers above a threshold emit per-event with full kernel + user stack.
Consolidates: Days 6 (fentry/fexit), 9 (stack traces), 13 (ringbuf scaling), 3 (CO-RE for the entry-arg parsing).
Why this is good capstone material: every BPF developer eventually writes a tracer like this. It’s the “hello, real world” of BPF. The simple version is ~150 lines; production-quality is ~500 lines (drop counters, sampling, fold-format export, real-time TUI).
Skeleton plan:
- BPF: fentry on a configurable function name; store entry timestamp in TID-keyed map; fexit computes duration; histogram-bucket the duration with the hand-built
log2lslot index from Prerequisite 1 (there is nolhisthelper — you build it); if dur > threshold, emit ringbuf event with stack ids. - Userspace: parse args (function name, threshold), load + attach, polling loop, read the histogram array once on exit, emit folded format on stop.
- Bonus: live histogram in TUI (use Rust’s
ratatuior Python’srich); flamegraph SVG output.
Option B: XDP firewall with userspace control plane
What: XDP-based packet filter with userspace agent for adding/removing rules. CIDR-based denylist (LPM trie) + per-source-IP rate limiting (token bucket in percpu hash) + tcx egress logging of drop events.
Consolidates: Days 14 (XDP), 15 (LPM), 17 (tcx), 13 (drop counters).
Why this is good: firewall-style applications are how Cilium and similar projects start. Concrete, measurable, immediately useful.
Skeleton plan:
- BPF: XDP program with deny (LPM lookup) + rate-limit (the token-bucket algorithm from Prerequisite 2) logic; tcx egress for outbound logging; shared maps for rules. Remember the percpu trap: effective rate ≈
N_cpus × configured_rate— document it. - Userspace: REST or unix-socket CLI for rule management; stats endpoint; configuration file format.
- Bonus: persist rules to disk; clean detach on exit; deploy in a real veth-based test network.
Option C: BPF TCP CC with adaptive heuristic
What: BPF-implemented TCP congestion control that adapts between two policies based on observed RTT. Below 1 ms RTT (local network), behave like Reno. Above, behave like BBR-ish.
Consolidates: Days 22 (struct_ops), 23 (instrumentation), 7 (BPF_PROG).
Why this is good: struct_ops is one of BPF’s most powerful and least-used features. Building a CC is the canonical example. You’ll learn how careful TCP is.
Skeleton plan:
- Start from
bpf_dctcp.c; readsrtt_usoff thetcp_sock, feed it into your own EWMA (Prerequisite 4), branch on a 1 ms threshold. Remembersrtt_usis already smoothed and in usec<< 3. - Userspace: load, register as
bpf_adaptive, expose stats. - Bonus: A/B benchmark vs Cubic on 100 ms vs 0.1 ms paths; produce a graph.
Option D: Custom sched_ext scheduler
What: Implement a simple two-class scheduler — interactive class (round-robin within priority cgroup) + background class (fair-share with vtime). Tasks self-classify by cgroup membership.
Consolidates: Days 25 (sched_ext), 26 (modify), 27 (read), eBPF Day 19 (cgroup awareness from networking book).
Why this is good: sched_ext is the bleeding edge. Writing a scheduler — even a simple one — puts you in a small club.
Skeleton plan:
- Start from
scx_simple.bpf.c. Add per-cgroup classification, two DSQs, dispatch priority. - Userspace: configurable cgroup paths; safety checks (refuse to load if priority cgroup empty).
- Bonus: latency benchmark (interactive vs background) under load; produce a graph.
Option E: Iterator-based richer ps
What: A BPF iterator that walks every task and emits {pid, comm, cgroup, rss, runtime, ...} to a file descriptor. Userspace tool replaces /proc parsing for a ps-like utility.
Consolidates: Day 7 (BPF_PROG), Day 24 (kfunc/BTF), Day 12 (iterators are sleepable).
Why this is good: less hot-path, more “kernel introspection at scale” — useful for monitoring stacks. Iterator programs are an underused BPF capability.
Skeleton plan:
- BPF:
SEC("iter/task")walking, emitting viaBPF_SEQ_PRINTFintoctx->meta->seq— header onseq_num == 0, footer ontask == NULL(Prerequisite 3). - Userspace:
bpf_iter_create()to get an fd, then read it like a file in a loop until EOF. - Bonus: enrich output (cgroup paths, ns memberships, fd counts) faster than
/proc/<pid>/...parsing; use the iterator’s sleepability tobpf_copy_from_user_task(ctx->task, …)for the walked task’s strings.
Option A — reference solution
The five options above are yours to build; the point of the capstone is to
design one without a guide. But so this book compiles and ships one complete,
end-to-end example, the lab includes a full reference implementation of
Option A — a generic latency tracer — in ebpf/labs/day28-30/. Read it
after you’ve attempted your own; treat it as one answer, not the answer. The
other four options remain deliberately unimplemented exercises.
It is the standalone libbpf pattern from Days 1–13: a shared header, a BPF
object, and a userspace loader, built by make -C ebpf/labs day28-30.
The shared layout — the per-stack histogram and the outlier record both sides agree on:
#ifndef PRACTICAL_EBPF_CAPSTONE_LATENCY_H #define PRACTICAL_EBPF_CAPSTONE_LATENCY_H
/*
- Shared layout for the Days 28-30 capstone (Option A reference solution): a
- generic function-latency tracer. The producer (capstone_latency.bpf.c) and
- the consumer (capstone_latency.c) include this one header, so a change to any
- struct cannot silently desynchronise the two sides.
- Plain C integer types (not __u32/__u64) keep the header identical for the BPF
- object and the userspace loader, matching the Day 1-3 lab headers. */
#define MAX_SLOTS 64 /* one counter per power-of-two latency bucket / #define MAX_STACK_DEPTH 32 / frames captured per stack id */ #define TASK_COMM_LEN 16
/*
- Per-stack latency histogram. slots[i] counts samples whose duration in ns
- has floor(log2(duration)) == i. There is NO lhist helper for libbpf/CO-RE
- programs; we build the histogram by hand (see the .bpf.c log2l). */ struct hist { unsigned long long slots[MAX_SLOTS]; };
/*
- One outlier record, emitted through the ring buffer for every call whose
- duration exceeded the configured threshold. The histogram handles the common
- case for pennies; only the rare outliers pay for a per-event record + stacks. / struct outlier_event { unsigned int pid; unsigned int tid; unsigned long long delta_ns; int kstack_id; / index into the stack-trace map, or <0 on failure */ int ustack_id; char comm[TASK_COMM_LEN]; };
#endif
The hand-built branchless log2l (Prerequisite 1 — there is no lhist helper):
/*
-
Branchless log2 for the histogram slot index. BPF has no libm and the
-
verifier rejects unbounded loops, so we binary-search the bit position with
-
shifts — the canonical idiom from samples/bpf/lwt_len_hist.bpf.c. There is no
-
lhist/hist helper for libbpf programs; this is how you build the bucketing. */ static __always_inline unsigned int log2_u32(unsigned int v) { unsigned int r, shift;
r = (v > 0xFFFF) << 4; v >>= r; shift = (v > 0xFF) << 3; v >>= shift; r |= shift; shift = (v > 0xF) << 2; v >>= shift; r |= shift; shift = (v > 0x3) << 1; v >>= shift; r |= shift; r |= (v >> 1); return r; }
/* 64-bit: log2 of the high half + 32, else the low half. */ static __always_inline unsigned int log2l(unsigned long long v) { unsigned int hi = v >> 32;
if (hi)
return log2_u32(hi) + 32;
return log2_u32(v);
}
The full BPF object: fentry stamps an entry time, fexit computes the duration,
buckets it into the per-stack PERCPU_HASH histogram (one increment, no atomics),
and emits a ring-buffer record with kernel + user stack ids only for outliers
above the threshold:
#include “vmlinux.h” #include <bpf/bpf_helpers.h> #include <bpf/bpf_tracing.h>
#include “capstone_latency.h”
char LICENSE[] SEC(“license”) = “GPL”;
/*
- Load-time configuration (const volatile -> .rodata, set by userspace before
- load). threshold_ns gates the per-event outlier path; targ_tgid, when
- nonzero, restricts tracing to one process. / const volatile unsigned long long threshold_ns = 1000000; / 1 ms / const volatile unsigned int targ_tgid = 0; / 0 = every task */
/* entry timestamp per thread id, written on fentry, consumed on fexit */ struct { __uint(type, BPF_MAP_TYPE_HASH); __uint(max_entries, 10240); __type(key, unsigned int); __type(value, unsigned long long); } starts SEC(“.maps”);
/* kernel/user stack traces, addressed by the id bpf_get_stackid() returns */ struct { __uint(type, BPF_MAP_TYPE_STACK_TRACE); __uint(max_entries, 4096); __uint(key_size, sizeof(unsigned int)); __uint(value_size, MAX_STACK_DEPTH * sizeof(unsigned long long)); } stacks SEC(“.maps”);
/*
- Per-stack histogram. PERCPU_HASH so each CPU bumps its own copy of a slot
- with an ordinary store — no lost counts under contention, no atomics — and
- userspace sums across CPUs. Keyed by kernel stack id: one distribution per
- call site (Option A’s “histogram bucketed by stack id”). */ struct { __uint(type, BPF_MAP_TYPE_PERCPU_HASH); __uint(max_entries, 4096); __type(key, unsigned int); __type(value, struct hist); } hists SEC(“.maps”);
/* outlier events (duration > threshold), one record each */ struct { __uint(type, BPF_MAP_TYPE_RINGBUF); __uint(max_entries, 256 * 1024); } outliers SEC(“.maps”);
/* All-zero template kept in .bss (not on the 512-byte BPF stack) so a new
- histogram entry can be created without a large stack allocation. */ static struct hist zero_hist;
/*
-
Branchless log2 for the histogram slot index. BPF has no libm and the
-
verifier rejects unbounded loops, so we binary-search the bit position with
-
shifts — the canonical idiom from samples/bpf/lwt_len_hist.bpf.c. There is no
-
lhist/hist helper for libbpf programs; this is how you build the bucketing. */ static __always_inline unsigned int log2_u32(unsigned int v) { unsigned int r, shift;
r = (v > 0xFFFF) << 4; v >>= r; shift = (v > 0xFF) << 3; v >>= shift; r |= shift; shift = (v > 0xF) << 2; v >>= shift; r |= shift; shift = (v > 0x3) << 1; v >>= shift; r |= shift; r |= (v >> 1); return r; }
/* 64-bit: log2 of the high half + 32, else the low half. */ static __always_inline unsigned int log2l(unsigned long long v) { unsigned int hi = v >> 32;
if (hi)
return log2_u32(hi) + 32;
return log2_u32(v);
}
/*
-
Entry and exit attach to a kernel function chosen at load time. The SEC names
-
are placeholders; userspace calls bpf_program__set_attach_target() to point
-
both programs at the requested function before load. */ SEC(“fentry/vfs_read”) int BPF_PROG(on_entry) { unsigned long long id = bpf_get_current_pid_tgid(); unsigned int tgid = id >> 32; unsigned int tid = (unsigned int)id; unsigned long long ts;
if (targ_tgid && tgid != targ_tgid) return 0;
ts = bpf_ktime_get_ns(); bpf_map_update_elem(&starts, &tid, &ts, BPF_ANY); return 0; }
SEC(“fexit/vfs_read”) int BPF_PROG(on_exit) { unsigned long long id = bpf_get_current_pid_tgid(); unsigned int tid = (unsigned int)id; unsigned long long *tsp, delta, now; unsigned int slot, key; struct hist *hp; int kstack;
tsp = bpf_map_lookup_elem(&starts, &tid);
if (!tsp)
return 0; /* entry was filtered out or missed */
now = bpf_ktime_get_ns();
delta = now - *tsp;
bpf_map_delete_elem(&starts, &tid);
/* Common-case path: bucket the duration into the per-stack histogram.
* One percpu increment, no ring buffer, no wakeup. */
kstack = bpf_get_stackid(ctx, &stacks, 0);
slot = log2l(delta);
if (slot >= MAX_SLOTS)
slot = MAX_SLOTS - 1; /* also proves the index bound to the verifier */
key = (unsigned int)kstack;
hp = bpf_map_lookup_elem(&hists, &key);
if (!hp) {
bpf_map_update_elem(&hists, &key, &zero_hist, BPF_NOEXIST);
hp = bpf_map_lookup_elem(&hists, &key);
if (!hp)
return 0;
}
hp->slots[slot]++;
/* Rare path: outliers additionally emit a full record with stack ids. */
if (delta > threshold_ns) {
struct outlier_event *e;
e = bpf_ringbuf_reserve(&outliers, sizeof(*e), 0);
if (!e)
return 0;
e->pid = id >> 32;
e->tid = tid;
e->delta_ns = delta;
e->kstack_id = kstack;
e->ustack_id = bpf_get_stackid(ctx, &stacks, BPF_F_USER_STACK);
bpf_get_current_comm(&e->comm, sizeof(e->comm));
bpf_ringbuf_submit(e, 0);
}
return 0;
}
The userspace loader points both programs at a function chosen with -f
(default vfs_read) via bpf_program__set_attach_target, drains the outlier
ring buffer while symbolizing kernel frames from /proc/kallsyms, and reads the
whole histogram once on exit — summing the per-CPU slots as the check question
below demands:
#include <argp.h> #include <errno.h> #include <signal.h> #include <stdbool.h> #include <stdio.h> #include <stdlib.h> #include <string.h> #include <time.h> #include <unistd.h>
#include <bpf/bpf.h> #include <bpf/libbpf.h>
#include “capstone_latency.h” #include “capstone_latency.skel.h”
/*
- Option A reference capstone: a generic latency tracer for any kernel
- function. fentry stamps an entry time, fexit computes the duration, buckets
- it into a per-stack log2 histogram (read once on exit), and emits a
- ring-buffer record with kernel + user stack ids for every outlier above a
- threshold. Kernel stacks are symbolized from /proc/kallsyms. */
static struct env { const char func; unsigned long long threshold_ns; unsigned int pid; int duration; bool verbose; } env = { .func = “vfs_read”, .threshold_ns = 1000000, / 1 ms / .duration = 0, / 0 = until Ctrl-C */ };
const char *argp_program_version = “capstone_latency 1.0”; static const char argp_doc[] = “Latency tracer: per-stack log2 histogram + thresholded outliers.\n” “\n” “USAGE: capstone_latency [-f FUNC] [-t MS] [-p PID] [-d SEC] [-v]\n”;
static const struct argp_option opts[] = { { “func”, ‘f’, “FUNC”, 0, “Kernel function to trace (default vfs_read)” }, { “threshold”, ‘t’, “MS”, 0, “Outlier threshold in milliseconds (default 1)” }, { “pid”, ‘p’, “PID”, 0, “Trace only this process (default all)” }, { “duration”, ‘d’, “SEC”, 0, “Stop after SEC seconds (default: until Ctrl-C)” }, { “verbose”, ‘v’, NULL, 0, “Verbose libbpf output” }, {}, };
static error_t parse_arg(int key, char *arg, struct argp_state *state) { switch (key) { case ‘f’: env.func = arg; break; case ‘t’: env.threshold_ns = strtoull(arg, NULL, 10) * 1000000ULL; break; case ‘p’: env.pid = strtoul(arg, NULL, 10); break; case ‘d’: env.duration = atoi(arg); break; case ‘v’: env.verbose = true; break; case ARGP_KEY_ARG: argp_usage(state); break; default: return ARGP_ERR_UNKNOWN; } return 0; }
/* –– minimal /proc/kallsyms symbolizer for kernel stack frames ––––– */
struct ksym { unsigned long long addr; char *name; };
static struct ksym *ksyms; static size_t ksyms_len;
static int ksym_cmp(const void *a, const void *b) { const struct ksym *ka = a, *kb = b;
return (ka->addr > kb->addr) - (ka->addr < kb->addr);
}
static int load_kallsyms(void) { FILE *f = fopen(“/proc/kallsyms”, “r”); char line[512], name[256], type; unsigned long long addr; size_t cap = 0;
if (!f)
return -errno;
while (fgets(line, sizeof(line), f)) {
if (sscanf(line, "%llx %c %255s", &addr, &type, name) != 3)
continue;
if (type != 't' && type != 'T' && type != 'w' && type != 'W')
continue;
if (addr == 0)
continue;
if (ksyms_len == cap) {
cap = cap ? cap * 2 : 4096;
ksyms = realloc(ksyms, cap * sizeof(*ksyms));
if (!ksyms) {
fclose(f);
return -ENOMEM;
}
}
ksyms[ksyms_len].addr = addr;
ksyms[ksyms_len].name = strdup(name);
ksyms_len++;
}
fclose(f);
qsort(ksyms, ksyms_len, sizeof(*ksyms), ksym_cmp);
return 0;
}
static const struct ksym *ksym_find(unsigned long long addr) { size_t lo = 0, hi = ksyms_len;
if (!ksyms_len || addr < ksyms[0].addr)
return NULL;
while (hi - lo > 1) {
size_t mid = (lo + hi) / 2;
if (ksyms[mid].addr <= addr)
lo = mid;
else
hi = mid;
}
return &ksyms[lo];
}
/* –– stack reading + printing —————————————–– */
static int stacks_fd = -1;
static void print_kernel_stack(int stack_id) { unsigned long long addrs[MAX_STACK_DEPTH] = {}; int i;
if (stack_id < 0) {
printf(" [no kernel stack: %d]\n", stack_id);
return;
}
if (bpf_map_lookup_elem(stacks_fd, &stack_id, addrs) != 0) {
printf(" [kernel stack %d unavailable]\n", stack_id);
return;
}
for (i = 0; i < MAX_STACK_DEPTH && addrs[i]; i++) {
const struct ksym *sym = ksym_find(addrs[i]);
if (sym)
printf(" %s+0x%llx\n", sym->name, addrs[i] - sym->addr);
else
printf(" 0x%llx\n", addrs[i]);
}
}
static void print_user_stack(int stack_id) { unsigned long long addrs[MAX_STACK_DEPTH] = {}; int i;
if (stack_id < 0)
return;
if (bpf_map_lookup_elem(stacks_fd, &stack_id, addrs) != 0)
return;
for (i = 0; i < MAX_STACK_DEPTH && addrs[i]; i++)
printf(" user 0x%llx\n", addrs[i]);
}
static int handle_event(void *ctx, void *data, size_t size) { const struct outlier_event *e = data;
(void)ctx;
if (size != sizeof(*e)) {
fprintf(stderr, "unexpected ringbuf record size: %zu\n", size);
return 0;
}
printf("OUTLIER %s pid=%u tid=%u %.3f ms\n", e->comm, e->pid, e->tid,
e->delta_ns / 1e6);
print_kernel_stack(e->kstack_id);
print_user_stack(e->ustack_id);
return 0;
}
/* Read the whole per-stack histogram once and print one row block per stack. */ static void print_histograms(struct capstone_latency_bpf *skel) { int hists_fd = bpf_map__fd(skel->maps.hists); int nr_cpus = libbpf_num_possible_cpus(); unsigned int key, next; void cur = NULL; / NULL first key so stack id 0 is not skipped */ struct hist *per_cpu;
if (nr_cpus < 0)
return;
per_cpu = calloc(nr_cpus, sizeof(*per_cpu));
if (!per_cpu)
return;
printf("\n=== latency histograms (function: %s) ===\n", env.func);
while (bpf_map_get_next_key(hists_fd, cur, &next) == 0) {
unsigned long long slots[MAX_SLOTS] = {};
int cpu, slot;
bool any = false;
if (bpf_map_lookup_elem(hists_fd, &next, per_cpu) == 0) {
for (cpu = 0; cpu < nr_cpus; cpu++)
for (slot = 0; slot < MAX_SLOTS; slot++)
slots[slot] += per_cpu[cpu].slots[slot];
}
printf("\nstack id %d:\n", (int)next);
print_kernel_stack((int)next);
printf(" %-20s : count\n", "nsec");
for (slot = 0; slot < MAX_SLOTS; slot++) {
unsigned long long lo, hi, count = slots[slot];
int bar;
if (!count)
continue;
any = true;
lo = slot ? (1ULL << slot) : 0;
hi = (1ULL << (slot + 1)) - 1;
printf(" %10llu-%-10llu : %-8llu ", lo, hi, count);
for (bar = 0; bar < (int)(count > 40 ? 40 : count); bar++)
putchar('*');
putchar('\n');
}
if (!any)
printf(" (no samples)\n");
key = next;
cur = &key;
}
free(per_cpu);
}
/* –– libbpf plumbing –––––––––––––––––––––––––– */
static int libbpf_print_fn(enum libbpf_print_level level, const char *format, va_list args) { if (level == LIBBPF_DEBUG && !env.verbose) return 0; return vfprintf(stderr, format, args); }
static volatile sig_atomic_t exiting;
static void handle_signal(int sig) { (void)sig; exiting = 1; }
int main(int argc, char **argv) { static const struct argp argp = { .options = opts, .parser = parse_arg, .doc = argp_doc, }; struct capstone_latency_bpf *skel = NULL; struct ring_buffer *rb = NULL; struct sigaction sa = { .sa_handler = handle_signal }; time_t started; int err;
err = argp_parse(&argp, argc, argv, 0, NULL, NULL);
if (err)
return 1;
setvbuf(stdout, NULL, _IOLBF, 0);
libbpf_set_print(libbpf_print_fn);
sigaction(SIGINT, &sa, NULL);
sigaction(SIGTERM, &sa, NULL);
err = load_kallsyms();
if (err)
fprintf(stderr, "warning: /proc/kallsyms unavailable (%s); "
"kernel frames will print as addresses\n",
strerror(-err));
skel = capstone_latency_bpf__open();
if (!skel) {
fprintf(stderr, "failed to open BPF skeleton\n");
return 1;
}
skel->rodata->threshold_ns = env.threshold_ns;
skel->rodata->targ_tgid = env.pid;
/* Point both tracing programs at the chosen function before load. */
err = bpf_program__set_attach_target(skel->progs.on_entry, 0, env.func);
if (!err)
err = bpf_program__set_attach_target(skel->progs.on_exit, 0, env.func);
if (err) {
fprintf(stderr, "failed to target %s: %s\n", env.func, strerror(-err));
goto cleanup;
}
err = capstone_latency_bpf__load(skel);
if (err) {
fprintf(stderr, "failed to load (is %s a valid fentry target?): %s\n",
env.func, strerror(-err));
goto cleanup;
}
err = capstone_latency_bpf__attach(skel);
if (err) {
fprintf(stderr, "failed to attach: %s\n", strerror(-err));
goto cleanup;
}
stacks_fd = bpf_map__fd(skel->maps.stacks);
rb = ring_buffer__new(bpf_map__fd(skel->maps.outliers), handle_event, NULL, NULL);
if (!rb) {
err = -errno;
fprintf(stderr, "failed to create ringbuf: %s\n", strerror(-err));
goto cleanup;
}
printf("tracing %s (outliers > %.3f ms); Ctrl-C to stop and print histograms\n",
env.func, env.threshold_ns / 1e6);
started = time(NULL);
while (!exiting) {
err = ring_buffer__poll(rb, 200);
if (err == -EINTR) {
err = 0;
continue;
}
if (err < 0) {
fprintf(stderr, "ringbuf poll failed: %s\n", strerror(-err));
break;
}
if (env.duration && time(NULL) - started >= env.duration)
break;
}
print_histograms(skel);
err = 0;
cleanup: ring_buffer__free(rb); capstone_latency_bpf__destroy(skel); for (size_t i = 0; i < ksyms_len; i++) free(ksyms[i].name); free(ksyms); return err != 0; }
Day 28 — Sketch and start
Pick one. Spend the first hour sketching:
- What BPF programs (one or many)?
- What maps and sizes (and concurrency considerations)?
- What userspace responsibilities?
- Where is the verifier most likely to push back?
Write a one-page README with the design before any code. If you can’t articulate the design, you’re not ready to code. The README forces concreteness; vague designs become obvious when you try to write them down.
Then build the minimum viable version. Goal for end of Day 28: it compiles and loads. It might not do anything useful. That’s fine — a loading-but-broken program is way ahead of a perfect-but-unfinished one.
Day 29 — Iterate
Run on a real workload. Measure. Fix verifier rejections. Add the outlier/control-plane/tuning feature you sketched.
Write tests if you can. Selftests in tools/testing/selftests/bpf/ are good models for what BPF tests look like — and as you saw above, they double as reference implementations (bpf_iter_tasks.c, bpf_dctcp.c) for the very techniques the options use.
The bulk of your time today is debugging: verifier logs, kernel dmesg, ringbuf drops, missing fields. Don’t get discouraged — every BPF programmer hits these.
Day 30 — Polish and write up
Drop counters, error messages, clean detach paths. README explaining design decisions and one or two unexpected findings. Take a screenshot of it running.
Write one paragraph on:
“The verifier rejected X. I fixed it by Y. Here’s why.”
This paragraph is the most valuable artifact of the entire 30 days. It crystallizes one piece of knowledge that’s now permanently yours — a verifier rule you understand at the gut level, not just intellectually.
There are no Dumb Questions
Q: I searched
bpf_helpers.handbpf_helper_defs.hforlhistandhistand found nothing. Am I on an old kernel?A: No — they were never there.
lhist/histare bpftrace language builtins, not BPF helpers. In a hand-written libbpf/CO-RE program you build the histogram yourself: a fixed array map plus the branchlesslog2lslot index fromsamples/bpf/lwt_len_hist.bpf.c. If a tutorial implies a histogram helper exists for libbpf programs, it’s confusing bpftrace with libbpf.Q: My token-bucket limiter is set to 1000 pps but the source clearly pushed several thousand. Bug?
A: Almost certainly the percpu trap. A
BPF_MAP_TYPE_PERCPU_HASHkeeps an independent bucket per CPU, so the effective global allowance is roughlyN_cpus × configured_rate. That’s the deliberate price of lock-free correctness. For a precise global cap you need a shared hash with abpf_spin_lock(or atomic CAS) on the{tokens, last_refill}value — slower and contended. Decide which you want and write it in the README.Q: My iterator prints nothing. The program loads and attaches fine.
A: Did you
read()the iter fd? An iterator is pulled, not pushed — the kernel only runs your program when userspace reads. Attaching gets you a link; you still needbpf_iter_create()to get an fd and aread()loop to drain it. No reads, no output. Also check your end condition:read()returning 0 is normal EOF (iteration exhausted), not an error.Q: For Option C, my EWMA never moves even though RTT clearly varies.
A: Two common causes. First,
srtt_usis in microseconds<< 3— if you compare it to a threshold in plain microseconds without shifting, your branch is off by 8×. Second, your shift is too large, so the EWMA adapts slower than your test runs. Remember you’re smoothing an already-smoothed signal (srtt_usis itself an EWMA), so a gentle shift goes a long way.
What to read in the kernel
samples/bpf/lwt_len_hist.bpf.c— the canonical hand-built histogram: branchlesslog2(:24), 64-bitlog2l(:37), and the lookup/__sync_fetch_and_addincrement (:46). This is the pattern Option A needs.samples/bpf/tracex3.bpf.c—log2l(:39) plus the decade-scaling trick (:78,log10(x)*10 = log2(x)*3) for prettier latency buckets.kernel/bpf/helpers.c—bpf_ktime_get_ns(:178) andbpf_ktime_get_boot_ns(:190); the clocks the token-bucket refill math depends on (monotonic vs boot-inclusive).tools/testing/selftests/bpf/progs/bpf_iter_tasks.c— the referenceSEC("iter/task")program (:20):ctx->meta->seq, thetask == NULLfooter, theseq_num == 0header,BPF_SEQ_PRINTF.kernel/bpf/task_iter.c—struct bpf_iter__task(:170), the exact context an iterator receives.kernel/trace/bpf_trace.c—bpf_seq_printf(:458), the helper behindBPF_SEQ_PRINTF.include/linux/tcp.h—srtt_us(:307), the smoothed-RTT field Option C branches on.tools/testing/selftests/bpf/progs/bpf_dctcp.c—dctcp_alpha(:44) and its EWMA decay update (:131); the model Option C extends.kernel/bpf/verifier.c— when your project gets rejected, this is where the message comes from. You’ve read pieces of it all month; now read whatever function printed your error.
Today’s experiment
Before you commit to an option, measure the gap the corresponding prerequisite fills, so the design lands in your hands and not just your head.
Prove there is no lhist helper (Option A)
grep -rn 'lhist\|bpf_hist' ~/code/linux/tools/lib/bpf/ ~/code/linux/tools/testing/selftests/bpf/bpf_helpers.h 2>/dev/null
You’ll find nothing in libbpf — then find the real thing only in the bpftrace ecosystem and in hand-rolled samples. Now grep the sample that does build one:
grep -n 'log2\|__sync_fetch_and_add' ~/code/linux/samples/bpf/lwt_len_hist.bpf.c
Watch the monotonic clock the token bucket uses (Option B)
sudo bpftrace -e 'kprobe:do_nanosleep { printf("%llu\n", nsecs); }' | head -3
nsecs in bpftrace is the same monotonic clock bpf_ktime_get_ns() returns. Watch it advance — that’s the value your refill math subtracts last_refill_ns from.
See an iterator get pulled (Option E)
sudo bpftool iter pin $(find ~/code/linux/tools/testing/selftests/bpf -name 'bpf_iter_tasks.bpf.o' 2>/dev/null | head -1) /sys/fs/bpf/task_iter 2>/dev/null; sudo cat /sys/fs/bpf/task_iter | head
The argument order is bpftool iter pin OBJ PATH — the ELF object first, the pin path second. bpftool has no built-in task iterator; you always supply an object. If the prebuilt bpf_iter_tasks.bpf.o isn’t present, build it first:
make -C ~/code/linux/tools/testing/selftests/bpf bpf_iter_tasks.bpf.o
cat-ing the pinned iter file is exactly the “read it like a file” loop — each read() runs the BPF program on demand to fill the buffer.
After Day 30
You’re not done; you’re operationally fluent.
Next steps depending on direction:
Production tooling
Productize your capstone or contribute to existing projects (Cilium, bpftrace, Parca, Tetragon). Look at issues with good-first-issue labels.
Upstream contribution
Watch the bpf mailing list (vger.kernel.org/bpf). Pick small selftest improvements. Submit your first patch. The barrier is lower than people think — well-written selftest contributions are welcomed.
Frontier
Read what’s coming next: arena, BPF lists/rbtree, dynptr extensions. Each is a chapter not in this 30-day plan because it’s still maturing.
Specialization
Pick a vertical:
- Networking (XDP/Cilium): build packet-path features, contribute to upstream.
- Observability (Pixie / Parca / bpftrace): build tracing tools, contribute to ecosystem.
- Security (Tetragon, BPF LSM): write security policy enforcement.
- Scheduling (sched_ext): build domain-specific schedulers —
scx_layered,scx_lavd,scx_rustyare good prior art.
Bullet Points
- There is no
lhist/histhelper for libbpf programs — those are bpftrace builtins. In a hand-written BPF program you build the histogram: a fixed array map ofu64slots,slot = floor(log2(duration))via the branchlesslog2lidiom, one__sync_fetch_and_addper event, read the whole array once on exit. Per-stack-id histograms just key by(stackid, slot)(Day 9). - Histograms scale where per-event ringbuf doesn’t — one atomic add per event vs. a reserve/commit/wakeup per event; that’s why real tracers aggregate in-kernel and only emit outliers per-event.
- Token bucket: store
{tokens, last_refill_ns}per key; on each packet lazily refilltokens += elapsed * rate / 1e9(capped at capacity) usingbpf_ktime_get_ns(), consume one to PASS or DROP when empty. - The percpu token-bucket trap: one independent bucket per CPU means effective rate ≈
N_cpus × configured_rate. It’s the price of lock-free correctness (no atomics/spinlock). Coarse DoS protection, not a precise global limit — document it. - A BPF iterator is pulled, not pushed. It writes into
ctx->meta->seq(astruct seq_file) withBPF_SEQ_PRINTF; the kernel calls it once per object plus once with the object NULL (footer);seq_num == 0is the header. Userspacebpf_iter_create()s an fd andread()s it like a file — each read runs the program on demand. Being sleepable, it maybpf_copy_from_user_task(ctx->task, …)to read the walked task’s memory while iterating (Day 12). - EWMA in one line:
avg = avg + ((sample - avg) >> shift)— one variable, no history array (mind the parens:>>binds looser than+/-). For Option C,srtt_us(tcp.h:307) is microseconds<< 3and already an EWMA; your EWMA is a coarser layer on top, so tune the threshold accordingly. - The most valuable artifact of all 30 days is one paragraph: “The verifier rejected X. I fixed it by Y. Here’s why.”
Check question
You’re building Option A. You write the BPF histogram, run your tracer under a heavy workload across all 8 CPUs, and on exit your userspace reads the array and the bars look too short — far fewer total samples than the events you know occurred. The increment is a plain hist[slot]++ on a shared BPF_MAP_TYPE_ARRAY. Then you switch the map to BPF_MAP_TYPE_PERCPU_ARRAY (still hist[slot]++, summing across CPUs in userspace), and now the counts are right and it’s faster. Why?
Click to reveal answer
Answer: A plain hist[slot]++ on a shared array is a non-atomic read-modify-write: eight CPUs racing on the same hot slot read the same old value, each add one, and write back — so concurrent increments clobber each other and counts are genuinely lost. That’s the “too short” bars. The naive fix is __sync_fetch_and_add(&hist[slot], 1), which is correct but contended — eight CPUs serialize on the atomic, costing throughput under load. BPF_MAP_TYPE_PERCPU_ARRAY sidesteps both: each CPU increments its own copy of the slot with an ordinary store — no lost counts, no atomic, no cross-CPU contention (the Day 2 per-CPU memory model). Userspace then reads the per-CPU array and sums across CPUs to get the logical total. So: percpu trades a tiny bit of userspace summation work for both correctness and zero kernel-side contention — the same reason percpu maps win for high-rate counters, and (deliberately, in Option B) the same reason a percpu token bucket gives a per-CPU rather than global rate. If your bars are still too short after switching, you forgot to sum the per-CPU values — read all nr_cpus entries, not just index 0.
End of 30-day plan
You’ve come from “what is BPF?” to “I shipped a thing.” Specifically:
- Day 1: First fentry program with ringbuf
- Day 5: Verifier intuition (PTR_TO_MAP_VALUE_OR_NULL, bounded loops)
- Day 10: Userspace tracing via uprobes
- Day 15: XDP-based firewall
- Day 20: kfuncs and acquire/release semantics
- Day 25: BPF scheduler
- Day 30: Your project
The codebase keeps moving. Your fluency is durable; specific APIs are not. Re-read kernel/bpf/verifier.c every six months. Subscribe to the bpf list. Run tools/testing/selftests/bpf/test_progs after kernel upgrades and read what changed.
Welcome to the party.