Day 30 — Capstone: trace one packet end to end
Mission: pick one real packet from your system. Trace it through every kernel layer you’ve learned over the last 29 days. Write up what you saw, with kernel function names and rough timings. Along the way you’ll learn the two last pieces of background the capstone leans on — how to read raw
trace-cmdoutput, and the per-CPU “backlog” device that loopback’s receive side runs on. ~4–5 hours.
Why this exercise
Twenty-nine days have given you a vocabulary: sk_buff, NAPI, qdisc, fib_lookup, conntrack, netfilter hook, sk_prot, congestion control, retransmit timer, MPTCP, kTLS. Each in isolation. The capstone is to see them cooperate on one real, observable packet.
When you can describe a single ping or HTTP request as a sequence of kernel operations with names, you’ve internalized the model. That’s the goal.
There are two small bits of machinery you’ve leaned on implicitly but never had to read directly, and the capstone is the first place you stare at them up close:
- Raw
trace-cmd reportoutput. Days 2 and 3 showed you the symbolic call chain (netif_receive_skb → __netif_receive_skb_one_core → ip_rcv). Today you’ll paste literal multi-column trace lines and pull a call tree and a duration out of them. We decode that format once, below. - The per-CPU backlog (software NAPI) device. Day 2 taught the hardware NAPI path — a driver’s
->polldraining an RX ring. Loopback has no ring and no driver; its receive side runs on a second, software NAPI instance per CPU called the backlog. That’s why the experiment graphs-g tcp_v4_rcvinstead of-g netif_receive_skb, and we teach exactly why below.
Both are short. Then you trace your packet.
The exercise
Pick a packet — your choice of:
- A TCP request/response over a real network:
curl https://example.com, watching the SYN go out and the response come back. - A simple ICMP exchange:
ping -c 1 8.8.8.8. - A UDP service interaction:
dig @8.8.8.8 example.com. - A bridged packet: traffic between two namespaces over a Linux bridge.
- A NAT’d packet: outgoing traffic via a masquerade rule, tracking conntrack state.
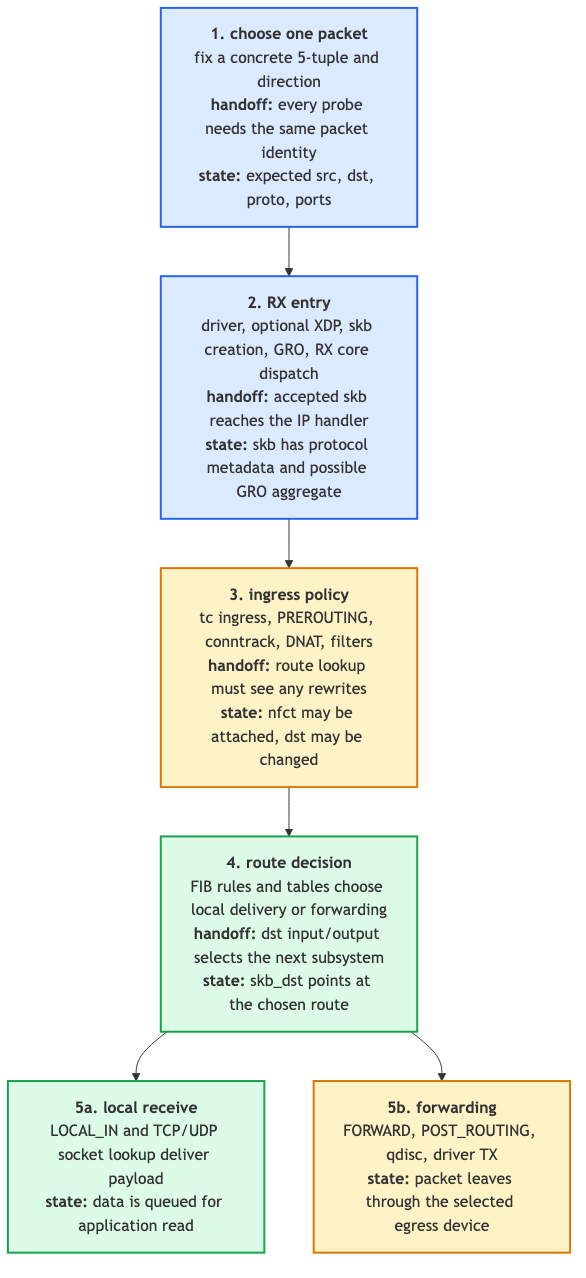
Trace it through, identify each kernel layer it traverses, and write up the journey.
Tools you’ll use
trace-cmd record -p function_graph: full function-call tree.perf trace: event-level visibility across syscalls and tracepoints.bpftraceone-liners: targeted measurements for specific functions.tcpdump: wire-level view (what actually went out vs what kernel state thinks).tsharkworks too if installed (apt install tshark), buttcpdumpalone is sufficient here.ss -tipsm: socket-level state at any moment./proc/net/*and/proc/sys/net/*: kernel state and tunables.bpftool: BPF program inspection if you’ve got any attached.
Reading raw function_graph output
For 29 days you’ve read the symbolic chain — netif_receive_skb → __netif_receive_skb_one_core → ip_rcv — drawn for you with arrows. The capstone’s deliverable asks you to produce that chain yourself from a literal trace-cmd report, plus a total elapsed time. So before anything else, decode one real line.
Why function_graph can draw a tree at all
There are two relevant ftrace tracers. The plain function tracer probes each function only on entry — it can tell you a function ran, but not when it returned or how long it took. function_graph “traces on both entry and exit of the functions” and “then provides the ability to draw a graph of function calls similar to C code source” (Documentation/trace/ftrace.rst ~line 828). Because it sees both ends, it “calculates the timings of when the function starts and returns internally.”
That is the whole reason Day 2’s experiment (and today’s) uses -p function_graph: entry and exit means the tracer can open a { brace when a function is called and close the matching } when it returns, and the indentation depth equals the call-stack depth. A nested { ... } literally is “this function called that one.” That nesting is what you’ll transcribe into your tcp_sendmsg → tcp_sendmsg_locked → ... arrow chain.
Decoding one line, column by column
Here is one real line from the send side (we’ll meet the whole block again below):
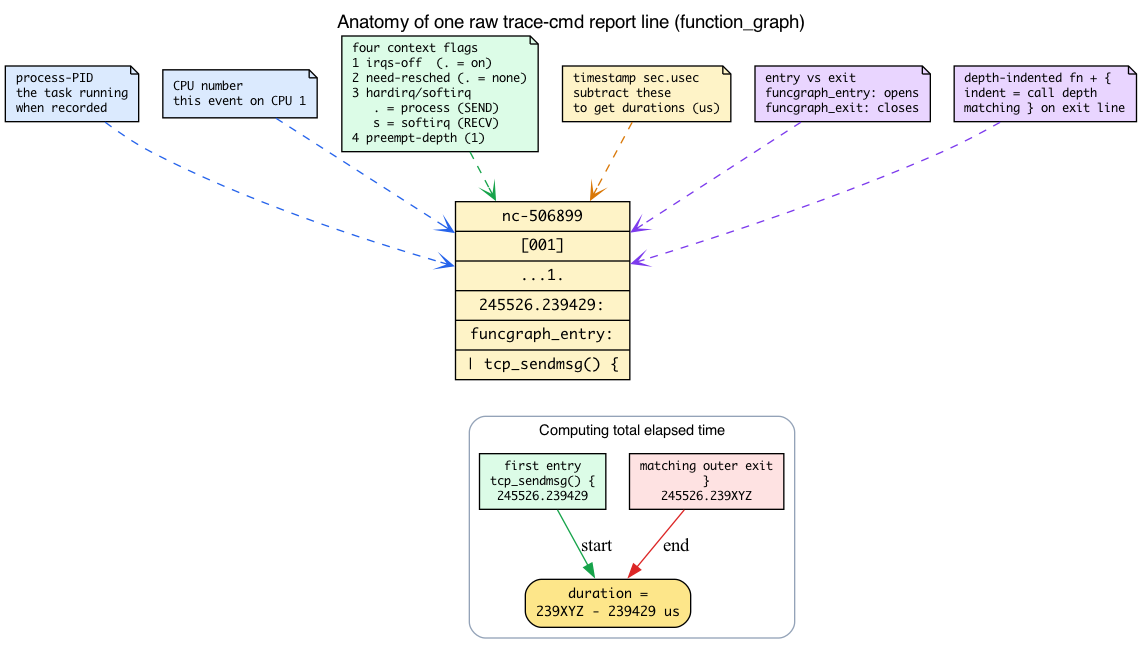
nc-506899 [001] ...1. 245526.239429: funcgraph_entry: | tcp_sendmsg() {
Reading left to right — and the column legend is right there in the kernel docs (Documentation/trace/ftrace.rst:961-964):
nc-506899— the process name and PID that was running when this line was recorded. Here, ourncgenerator, PID 506899.[001]— the CPU number, in brackets. This event happened on CPU 1....1.— the four context-flag positions (ftrace.rst:1063-1083). Decode them one at a time:- position 1 — irqs-off:
dif interrupts are disabled,.otherwise. - position 2 — need-resched:
N/n/.etc. — whether the scheduler wants to switch tasks. - position 3 — hardirq/softirq:
h= a hard IRQ is running,s= a soft IRQ is running,.= normal (process) context. - position 4 — preempt-depth: the digit is the level of
preempt_disablenesting (here1). - The trailing
.is the delay marker column.
- position 1 — irqs-off:
245526.239429— the timestamp in seconds.microseconds since boot (six fractional digits, astrace-cmd reportrenders it; ftrace’s underlying clock is nanosecond-resolution but the report rounds it to microseconds). This is what you subtract to get durations.funcgraph_entry:— this line is a function entry (the other kind isfuncgraph_exit:).| tcp_sendmsg() {— the depth-indented function, with a{opening a frame. The matching}appears later on afuncgraph_exit:line at the same indentation.
The position-3 flag is the one to care about for packet tracing. . (normal context) means the function ran in process context — the send side, running off a syscall like send(). s (soft irq running) means softirq context — the receive side, running off NAPI / net_rx_action. So just by glancing at the third flag column you can tell whether you’re looking at the transmit half or the receive half of your flow. That’s the send-vs-receive distinction this whole chapter draws, visible in one character.
Computing the “total time elapsed” the deliverable asks for
The walk-through deliverable demands “total time elapsed (the displayed timestamps are seconds.microseconds; you can compute this).” Here’s the arithmetic, on the pasted example. Each frame’s duration is the timestamp of its closing funcgraph_exit: minus the timestamp of its opening funcgraph_entry:. For the whole tcp_sendmsg() subtree, find the first tcp_sendmsg() { entry timestamp and the matching outer } exit timestamp:
funcgraph_entry:  245526.239429   tcp_sendmsg() {     <- first entry
...
funcgraph_exit:   245526.239XYZ   }                   <- matching outer exit
Subtract: 239XYZ − 239429 microseconds is your total (the displayed timestamps are sec.usec, so the difference is in microseconds — don’t mislabel it ns). You don’t even have to do it by hand — when funcgraph-tail/duration is enabled (Day 2 and Day 3 both record with -O funcgraph-tail), trace-cmd report prints a duration column on each funcgraph_exit line (also in us units), so you can read the elapsed time straight off the outer }.
One trap to expect (don’t think your trace is broken)
Some frames you “expect” won’t appear, for two reasons you already met in Day 2:
- Inlined wrappers vanish.
ip_rcv_finishis inlined, so the trace showsip_rcv_finish_coreinstead;deliver_skbis inlined into__netif_receive_skb_coreand never appears as its own node. - Compiler suffixes rename symbols. You’ll see
__netif_receive_skb_core.constprop.0or names with.isra.N— same function, decorated by the compiler.
This is the same caveat Day 2 spelled out — we don’t re-explain it, just remember it so a missing or renamed frame doesn’t make you think your trace.dat is wrong.
The backlog device: how loopback’s receive side works
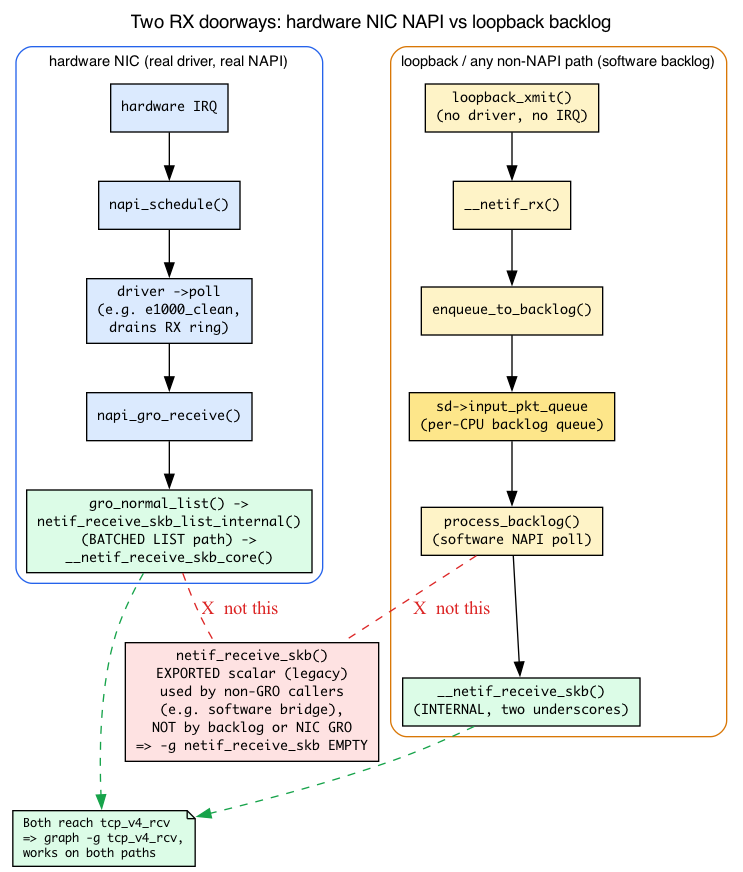
Day 2 taught the hardware RX path in full: a NIC raises an IRQ, the driver’s top half calls napi_schedule, net_rx_action walks the per-CPU poll_list, and each NIC queue’s ->poll (e.g. e1000_clean, weight 64) drains the RX ring, building skbs and feeding them to GRO. Modern GRO then flushes them through the batched list path: gro_normal_list() (include/net/gro.h:519) → netif_receive_skb_list_internal() (net/core/dev.c:6406) → __netif_receive_skb_list() → __netif_receive_skb_list_core(), which calls the per-skb core. (Recall the RX descriptor ring + DMA from Day 1.)
Loopback has none of that. There is no NIC, no IRQ, no DMA ring, no driver poll routine. So how does a packet you nc localhost ever “arrive”? Through a second, software NAPI instance that exists per CPU — the backlog.
One backlog NAPI per CPU, hanging off softnet_data
Every CPU’s struct softnet_data carries its own embedded backlog NAPI plus the two queues that feed it (include/linux/netdevice.h:3551):
struct softnet_data {
    struct sk_buff_head  process_queue;   /* :3553  drained by the poll */
    /* ... */
    struct sk_buff_head  input_pkt_queue; /* :3597  where new skbs land */
    struct napi_struct   backlog;         /* :3599  the software NAPI    */
};
At boot, each CPU’s backlog is wired to a poll routine called process_backlog (net/core/dev.c:13256):
sd->backlog.poll = process_backlog;
So the backlog is a NAPI device — it sits on the same per-CPU poll_list, gets polled by the same net_rx_action, under the same budgets — but it is a degenerate one: there’s no hardware ring to drain, just a software queue of skbs that something netif_rx’d.
Following the loopback TX→RX hop concretely
When you send to localhost, the loopback device’s transmit routine runs and immediately hands the skb to the receive side of the same CPU. Trace it:
loopback_xmit()(drivers/net/loopback.c:70) doesskb->protocol = eth_type_trans(skb, dev)and then, at line ~89,if (likely(__netif_rx(skb) == NET_RX_SUCCESS)). There’s the hop: TX calls straight into the RX entry point.__netif_rx()(net/core/dev.c:5732) →netif_rx_internal()(:5692) →enqueue_to_backlog()(:5373).enqueue_to_backlogdoes__skb_queue_tail(&sd->input_pkt_queue, skb)(net/core/dev.c:5405) — parking the skb on this CPU’s backlog input queue — and, if the queue was empty, setsNAPI_STATE_SCHEDonsd->backlogand callsnapi_schedule_rps(sd)to put the backlog on the poll list and raiseNET_RX_SOFTIRQ.- Later,
net_rx_actionpolls the backlog:process_backlog()(net/core/dev.c:6644) splicesinput_pkt_queueintoprocess_queueand, for each skb, calls__netif_receive_skb(skb).
That is the entire loopback receive path: loopback_xmit → __netif_rx → enqueue_to_backlog → sd->input_pkt_queue → process_backlog → __netif_receive_skb. Any non-NAPI or software path — loopback, the veth/tun slow paths, legacy non-NAPI drivers — feeds this same backlog.
Why -g netif_receive_skb comes up empty on loopback
Look closely at step 4. process_backlog calls the internal __netif_receive_skb (two underscores), not the exported netif_receive_skb (one underscore). And here’s the subtler point worth getting right: a real NIC doesn’t reach the exported scalar netif_receive_skb either. Modern NAPI GRO flushes through the batched list path (netif_receive_skb_list_internal → __netif_receive_skb_list → __netif_receive_skb_core), and the exported single-skb netif_receive_skb() (net/core/dev.c:6454) is a legacy entry point used by a few non-GRO callers — notably the software bridge via br_handle_frame_finish — not by NIC GRO.
So -g netif_receive_skb is an unreliable doorway on both paths: loopback enters via __netif_receive_skb, and a real NIC enters via the list path. That is exactly why the experiment graphs -g tcp_v4_rcv instead: it sits below the list-receive, scalar-receive, and backlog paths alike, so it is reliably reached by loopback nc, real curl, and ping traffic. Same packet, dependable doorway.
Tying it back to “what loopback skips”
Because loopback’s RX is the backlog, it has no driver, no hardware IRQ, no real NAPI ring drain, and no GRO coalescing — process_backlog just dequeues and delivers. That is why the worked example’s NIC layers are simply absent on lo.
A worked example: curl http://example.com
Let’s pre-walk what your trace might look like.
Step 1: DNS lookup (UDP)
curl calls getaddrinfo("example.com") → glibc → DNS query.
- Userspace:
socket(AF_INET, SOCK_DGRAM, 0)→sendto(...)to your DNS server’s port 53. - Kernel:
udp_sendmsg(net/ipv4/udp.c:1233) builds an skb, hands to IP. - Outbound:
ip_send_skb→ routing →dev_queue_xmit→ qdisc (fq_codel) → driver → wire. - Wait for response.
- Inbound: NIC RX → NAPI poll → driver allocates skb → GRO →
__netif_receive_skb_core→ip_rcv→ routing →udp_rcv(net/ipv4/udp.c:2588) → 4-tuple lookup → enqueue onsk_receive_queue→ wakerecvfrom. - Userspace:
recvfromreturns the DNS response.
Step 2: TCP connect (SYN)
curl calls socket(AF_INET, SOCK_STREAM) → connect(example.com:80).
- Userspace: connect syscall.
- Kernel:
tcp_v4_connect(net/ipv4/tcp_ipv4.c:221).- Route lookup → fib_lookup →
fib_table_lookup(net/ipv4/fib_trie.c). - Pick source port →
inet_csk_get_port→ ehash insert. - Build SYN segment →
tcp_transmit_skb(net/ipv4/tcp_output.c).
- Route lookup → fib_lookup →
- IP layer:
ip_queue_xmit→ip_local_out→NF_INET_LOCAL_OUTnetfilter hook → conntrack creates NEW entry →dst_output→ip_output→NF_INET_POST_ROUTINGhook → conntrack possibly NATs →ip_finish_output2→ neighbor resolution (ARP if not cached) →dev_queue_xmit→ qdisc → driver. - Sock state:
TCP_SYN_SENT.
Step 3: TCP handshake completion (SYN-ACK + ACK)
Inbound SYN-ACK:
- NIC → NAPI → driver → skb → GRO (probably no coalesce for 1 packet) →
ip_rcv→NF_INET_PRE_ROUTING→ conntrack matches →ip_rcv_finish→ routing →ip_local_deliver→NF_INET_LOCAL_INhook →tcp_v4_rcv(net/ipv4/tcp_ipv4.c:2068) → ehash lookup finds our sock in SYN_SENT →tcp_rcv_state_process(net/ipv4/tcp_input.c:7119) sees SYN+ACK → callstcp_set_state(sk, TCP_ESTABLISHED)and queues outgoing ACK.
Outbound ACK: same path as the SYN, just smaller and through a now-EST sock.
Step 4: HTTP request (TCP send)
curl calls send(fd, "GET / HTTP/1.1\r\n...", n, 0).
tcp_sendmsg(net/ipv4/tcp.c:1447) →tcp_sendmsg_locked→ copy to skb → append tosk_write_queue→tcp_push→tcp_write_xmitdecides to send (cwnd open, snd_wnd open, Nagle satisfied) →tcp_transmit_skb→ IP → … → wire.
Step 5: HTTP response (TCP recv)
Inbound packets arrive: NIC → NAPI → driver → skb → GRO (coalesce up to 64 KB!) → ip_rcv → tcp_v4_rcv → tcp state machine:
- ACKs advance
snd_una, free skbs fromsk_write_queue, possibly grow cwnd via the CC algorithm’scong_avoid. - DATA segments append to
sk_receive_queue, wakerecvmsg.
curl calls recv(fd, buf, n, 0) → tcp_recvmsg → copies from sk_receive_queue to user buffer.
Step 6: TCP close
curl finishes, calls close(fd). tcp_close (net/ipv4/tcp.c:3310) builds FIN, sends it, transitions to TCP_FIN_WAIT_1, waits for peer’s ACK, transitions to TCP_FIN_WAIT_2, waits for peer’s FIN, transitions to TCP_TIME_WAIT. ~60s later: state CLOSED, sock freed.
What you saw
A single web fetch involves: 2 DNS packets (UDP), 7 TCP packets minimum (SYN, SYN-ACK, ACK, request, response, FIN, FIN-ACK), routing lookups, neighbor resolution, GRO coalescing, congestion control, the netfilter PREROUTING/LOCAL_IN/LOCAL_OUT/POSTROUTING hooks ×N, conntrack state, qdisc scheduling. That’s the kernel networking stack in action.
Suggested concrete experiment
# 0. Remove any stale trace.dat. trace-cmd writes it as root, and a leftover
#    file from a prior run makes `report` silently read OLD data instead of
#    erroring.
sudo rm -f trace.dat

# 1. Set up tracing — records for 8s as a background job in THIS shell
sudo trace-cmd record -p function_graph \
    -g tcp_sendmsg \
    -g tcp_v4_rcv \
    -e net:* \
    -e tcp:* \
    -e skb:kfree_skb \
    sleep 8 &

# 2. Generate one packet exchange in this same shell
nc -l 9999 >/dev/null &
sleep 0.5
echo "test" | nc -q 1 localhost 9999

# 3. Wait for the background trace-cmd recorder (sleep 8) to exit, so
#    trace.dat is fully finalized before we read it. `wait` (no args) blocks
#    on the recorder; it also reaps the nc listener, which has already exited
#    once the client closed the connection.
wait

# 4. Generate the report
sudo trace-cmd report > /tmp/packet_trace.txt

# 5. Walk through the report
less /tmp/packet_trace.txt

# 6. Clean up — trace-cmd dropped a (potentially large) trace.dat here
rm -f trace.dat
pkill -f 'nc -l 9999' 2>/dev/null  # usually already gone after the single connection
Why loopback, and what it skips. This experiment uses
nc localhostfor reproducibility — no external network needed. Be aware that loopback is a degenerate path: it uses thenoqueueqdisc (nofq_codel), has no driver/NAPI, no GRO coalescing, no ARP/neighbor resolution, and no routing to a gateway — i.e. most of the layers the worked example above emphasizes. Loopback’s RX is the backlog (see the backlog section above), so-g netif_receive_skbis empty here; we graph-g tcp_v4_rcvinstead. To see the full stack — qdisc, GRO, neighbor, routing, driver — re-run while driving real off-box traffic, e.g.curl -s http://example.com >/dev/nullorping -c1 8.8.8.8, on a real interface.
The send side comes out looking like this (function_graph nesting; CPU/timestamp columns trimmed for width):
  nc-506899 [001] ...1. 245526.239429: funcgraph_entry: |  tcp_sendmsg() {
  nc-506899 [001] ...1. 245526.239432: funcgraph_entry: |    tcp_sendmsg_locked() {
  nc-506899 [001] ...1. 245526.239452: funcgraph_entry: |      tcp_push() {
  nc-506899 [001] ...1. 245526.239453: funcgraph_entry: |        tcp_write_xmit() {
  nc-506899 [001] ...1. 245526.239456: funcgraph_entry: |          __tcp_transmit_skb() {
  nc-506899 [001] ...1. 245526.239498: funcgraph_entry: |            ip_queue_xmit() {
  nc-506899 [001] ...2. 245526.239500: funcgraph_entry: |              ip_local_out() {
  nc-506899 [001] ...2. 245526.239512: funcgraph_entry: |                ip_output() {
  nc-506899 [001] ...3. 245526.239515: funcgraph_entry: |                  ip_finish_output2() {
Now you can read every column of that block. The ...1. flags say: irqs on, no resched pending, normal/process context (position 3 is .), preempt-depth 1 — confirming this is the send side running off the send() syscall, exactly as the context-flags section predicted. (Notice the preempt-depth digit climbing 1→2→3 as locks nest deeper toward ip_finish_output2.) The indentation/brace nesting is the call tree: tcp_sendmsg calls tcp_sendmsg_locked calls tcp_push … — which is precisely the arrow chain you’ll write in the deliverable. And the timestamps (239429 → 239515 µs so far) are what you subtract for durations.
The receive side opens with tcp_v4_rcv() { → tcp_inbound_hash(). On the receive lines, expect position-3 of the flags to read s (soft irq running), since tcp_v4_rcv runs out of the backlog poll inside net_rx_action, in softirq context — the visible counterpart to the send side’s .. The indented nesting above is the raw trace-cmd report format — it maps onto the arrow chain you’ll write below. Confirm your trace.dat actually contains this tcp_sendmsg/tcp_v4_rcv subtree before you invest 1–2 hours on the write-up.
The report will be long — hundreds to thousands of lines. Pick one TCP segment (the SYN you sent, or the response you received) and follow it through the kernel:
- Find the entry point (e.g.,
tcp_sendmsgfor an outgoing segment,tcp_v4_rcvfor incoming). - Note every function called in sequence (read the brace nesting as call depth).
- For each, look up which file/line it’s at (click any
path:Nreference to open that file/line on GitHub at the pinned kernel tag). - Write the sequence as: “tcp_sendmsg → tcp_sendmsg_locked → ip_queue_xmit → ip_local_out → …”.
Annotated walk-through deliverable
Your final write-up should be ~1–2 pages covering:
- The packet you traced and its purpose.
- Each kernel function it touched, in order.
- For each function: the file/line, what it did, what data structure it touched.
- Total time elapsed (the displayed timestamps are sec.usec, so the difference is in microseconds; you can compute this — subtract the first
funcgraph_entrytimestamp from the matching outerfuncgraph_exit, or read the duration column when-O funcgraph-tailis on). - One surprise you found (“I didn’t realize netfilter ran twice for forwarded traffic”).
That document is the artifact that proves you understood the system. Save it; use it as a reference.
There are no Dumb Questions
Q: My
trace.datis 50,000 lines. How do I isolate just my flow?A: A few quick filters.
trace-cmd report -F 'sched:*'won’t help here, buttrace-cmd report | grep -A40 'tcp_sendmsg() {'jumps straight to your send subtree. To cut by task, record with-P <pid>or filter the report by thenc-<pid>column. To cut by CPU, grep the[001]bracket. Easiest of all: graph a narrow-g tcp_sendmsg -g tcp_v4_rcv(as the experiment does) so the capture only contains those two subtrees in the first place.
Q:
perf tracevstrace-cmd— when do I reach for each?A:
trace-cmd record -p function_graphgives you the in-kernel call tree with timings — the right tool for “what functions did this packet traverse, in order, and how long did each take.”perf traceis closer to anstraceacross syscalls and tracepoints — the right tool for “what syscalls and net events fired, with arguments, across the whole system.” Usetrace-cmdfor the capstone’s function-by-function deliverable; reach forperf tracewhen you want the syscall-and-tracepoint event stream instead.
Q: Why does
tcp_v4_rcvshow up undernet_rx_actionand not under myncPID?A: Receive runs in softirq context, decoupled from the process. The skb is delivered by
net_rx_action(theNET_RX_SOFTIRQhandler) draining the backlog/NAPI poll — that’s whatever task happened to be running on the CPU when the softirq fired, not yournc. That is also why the receive lines carrysin the flags’ third position. Yournconly re-enters the picture later, whenrecvmsgcopies the queued data out in process context.
Q: Some functions from the worked example don’t appear in my trace. Is it incomplete?
A: Probably not.
ip_rcv_finishis inlined (you’ll seeip_rcv_finish_core),deliver_skbis inlined into__netif_receive_skb_core, and the compiler renames others with.constprop.N/.isra.Nsuffixes. Same caveat as Day 2 — a missing or renamed frame is a compiler artifact, not a lost packet.
What to read in the kernel
Documentation/trace/ftrace.rst— thefunction_graphtracer description (~line 828: traces entry and exit, draws the call graph, computes timings internally), the column legend (:961-964), and the per-flag meanings (:1063-1083: irqs-off, need-resched, hardirq/softirqh/s/., preempt-depth).drivers/net/loopback.c—loopback_xmit(line 70); noteeth_type_transthen__netif_rx(skb)at line ~89 — the TX→RX hop with no driver in between.net/core/dev.c— the backlog machinery:__netif_rx(line 5732) →netif_rx_internal(line 5692) →enqueue_to_backlog(line 5373), which does__skb_queue_tail(&sd->input_pkt_queue, skb)(line 5405);process_backlog(line 6644), the backlog poll that calls the internal__netif_receive_skb; andsd->backlog.poll = process_backlog(line 13256).include/linux/netdevice.h—struct softnet_data(line 3551):process_queue(3553),input_pkt_queue(3597), and the embeddedstruct napi_struct backlog(3599) — the per-CPU software-NAPI state.- The seven protocol entry points the worked example cites:
udp_sendmsg(net/ipv4/udp.c:1233),udp_rcv(net/ipv4/udp.c:2588),tcp_v4_connect(net/ipv4/tcp_ipv4.c:221),tcp_v4_rcv(net/ipv4/tcp_ipv4.c:2068),tcp_rcv_state_process(net/ipv4/tcp_input.c:7119),tcp_sendmsg(net/ipv4/tcp.c:1447),tcp_close(net/ipv4/tcp.c:3310).
What’s not covered
In 30 days you skipped:
- rxrpc (AFS-style transport —
net/rxrpc/). - SCTP — interesting alternate transport (
net/sctp/). - DCCP — mostly historical; the in-tree implementation was removed in 6.16, so there’s no longer a
net/dccp/. - RDS, TIPC, Sun RPC — niche transports.
- Bluetooth (
net/bluetooth/) — entirely different stack with its own protocols. - CAN bus (
net/can/) — automotive networking. - NFC (
net/nfc/). - L2TP, PPP, X.25 — legacy/specialized protocols.
- Phonet, QRTR, etc. — single-application stacks.
If your work touches one of these, apply the same methodology — read source, trace with tools, observe — to learn it. The patterns repeat.
Bullet Points
function_graphtraces both entry and exit, so it can draw a call tree ({/}braces, indentation = call depth) and compute per-function timings internally. Plainfunctiononly probes entry.- A raw
trace-cmd reportline is: process-PID, CPU[NNN], the four context-flag positions (irqs-off / need-resched / hardirq-softirq / preempt-depth), the sec.usec timestamp,funcgraph_entry:/funcgraph_exit:, then the depth-indented function. - The third flag is the send/receive tell:
.= process context (send, off a syscall),s= softirq (receive, off NAPI/backlog),h= hardirq. - Total elapsed time = outer
funcgraph_exittimestamp − firstfuncgraph_entrytimestamp (displayed as sec.usec, so the result is microseconds); or read the duration column printed when-O funcgraph-tailis on. - Inlined wrappers (
ip_rcv_finish,deliver_skb) and compiler suffixes (.constprop.N/.isra.N) make some frames vanish or rename — not a broken trace. - The backlog is a per-CPU software NAPI (
sd->backlog, poll =process_backlog) used by loopback and any non-NAPI path. Loopback RX:loopback_xmit → __netif_rx → enqueue_to_backlog → sd->input_pkt_queue → process_backlog → __netif_receive_skb. process_backlogcalls the internal__netif_receive_skb, not the exportednetif_receive_skb— so-g netif_receive_skbis empty on loopback. Graph-g tcp_v4_rcvinstead (works on both paths).- Loopback is degenerate (
noqueueqdisc, no driver/IRQ/NAPI ring, no GRO, no ARP, no routing) precisely because its RX is the backlog. Drive real off-box traffic to exercise the full stack. - The capstone deliverable — packet + purpose, each function in order with file/line and data structure, total time in microseconds, one surprise — is the artifact that proves you understood the system.
After Day 30
Real fluency comes from working on the stack, not just reading it. Pick one of:
- Submit a fix. Look at the netdev mailing list, find a
Reported-byyou can verify, propose a fix. - Write a tool. Build a tracer for something you want to know — a kernel-side per-flow latency histogram, a custom drop-categorizer, a cgroup-aware bandwidth tracker.
- Optimize a workload. Take a real performance problem you face — high latency, drops, packet reordering — and use what you learned to diagnose and fix.
- Read the eBPF book (the companion to this one). It builds on the kernel-networking foundation laid here, showing you how to write the BPF programs that hook into all these places.
You now know the Linux kernel network stack from first principles. That’s a durable skill. Welcome to the community.