Day 29 — Recent additions: PSP, drop_monitor, devlink, NETLINK YAML
Today’s mission: know what’s new in the network stack as of kernel 7.1 — PSP encryption, categorized drop attribution, generic device control, and the YAML-driven netlink toolchain — what each subsystem is for, and where it fits alongside everything you’ve already learned. Along the way we’ll teach the two pieces of plumbing the whole chapter rests on but no earlier day covered: tracepoints (the static instrumentation hooks that make
kfree_skbobservable) and generic netlink (the family layer PSP, devlink, and ethtool all sit on). Total time: ~110 minutes.
This is a survey day. It is less “here is one struct, dissected to the field” and more “here are four recent subsystems, and here is exactly enough of the machinery underneath each that none of them is a black box.” Two of those machines — tracepoints and generic netlink — are load-bearing for the whole chapter, so we teach them properly, intuition first, before the subsystem that leans on them.
Background 1: what a tracepoint actually is
The entire observability story today — perf trace, dropwatch, eBPF watching drops — rests on one mechanism the book has used but never explained: the tracepoint. Before we can say “drop_monitor listens on the skb:kfree_skb tracepoint,” you need to know what that hook is.
The problem: instrument the kernel without paying for it when nobody’s watching
You want to be able to ask “every time the kernel frees a packet, tell me where and why.” The naive way — a printk at the free site — is a disaster: it fires on every single freed skb whether or not anyone is listening, drowning the box. What you want is a hook that is completely free when no one is attached and only does work when a consumer turns it on.
That is a tracepoint: a named, statically-placed hook compiled into the kernel at a fixed source location, costing essentially nothing when off (the call site is patched out to a no-op via a static key — a runtime-patched branch), and dispatching to every registered listener when on.
TRACE_EVENT: declaring the hook and its payload
A tracepoint is declared with the TRACE_EVENT macro, which defines two things: the hook’s argument list (TP_PROTO) and the fixed payload record copied to every listener (TP_STRUCT__entry). Here is the real declaration for the one this chapter cares about (include/trace/events/skb.h:24):
TRACE_EVENT(kfree_skb,

    TP_PROTO(struct sk_buff *skb, void *location,
             enum skb_drop_reason reason, struct sock *rx_sk),   /* skb.h:26 */

    TP_STRUCT__entry(
        __field(void *,            skbaddr)     /* skb.h:32 */
        __field(void *,            location)
        __field(void *,            rx_sk)
        __field(unsigned short,    protocol)
        __field(enum skb_drop_reason, reason)
    ),

    TP_printk("skbaddr=%p rx_sk=%p protocol=%u location=%pS reason: %s",
              __entry->skbaddr, __entry->rx_sk, __entry->protocol,
              __entry->location,
              __print_symbolic(__entry->reason,
                               DEFINE_DROP_REASON(FN, FNe)))     /* skb.h:47 */
);
Read that payload carefully, because it is the whole reason this chapter exists:
skbaddr— which skb died.location— the kernel call site that freed it, printed as a symbol (%pSturns the raw address intotcp_v4_rcv+0x2a).protocol— the EtherType (recallskb->protocolfrom the Day 2 demux).rx_sk— the receiving socket, if any.reason— the drop-reason enum, rendered to a human string by__print_symbolicoverDEFINE_DROP_REASON.
That reason is a structured field in the payload, not a free-text log string. That single fact is the chapter’s whole thesis: because the reason is an enum that travels in the record, “why was this packet dropped?” becomes machine-aggregatable — you can count drops by reason, the way you’ll do in today’s experiment.
Who fires it: kfree_skb_reason
You met this on Day 1. Every time the kernel frees a packet on the drop path it calls kfree_skb_reason(skb, reason) (include/linux/skbuff.h:1322), which is what trips the kfree_skb tracepoint. And the plain old kfree_skb(skb) you’ve seen for years is now literally just the reason’d version with the reason left blank (skbuff.h:1333):
static inline void kfree_skb(struct sk_buff *skb)
{
    kfree_skb_reason(skb, SKB_DROP_REASON_NOT_SPECIFIED);   /* skbuff.h:1333 */
}
So a call site that still uses bare kfree_skb does fire the tracepoint — but its reason field is the useless NOT_SPECIFIED. Converting it to kfree_skb_reason(skb, SKB_DROP_REASON_X) costs one argument and turns a “something died here” event into a categorized one (the structured-enum property from Background 1). (Hold that thought — it is exactly today’s Check question.)
Many consumers, one hook
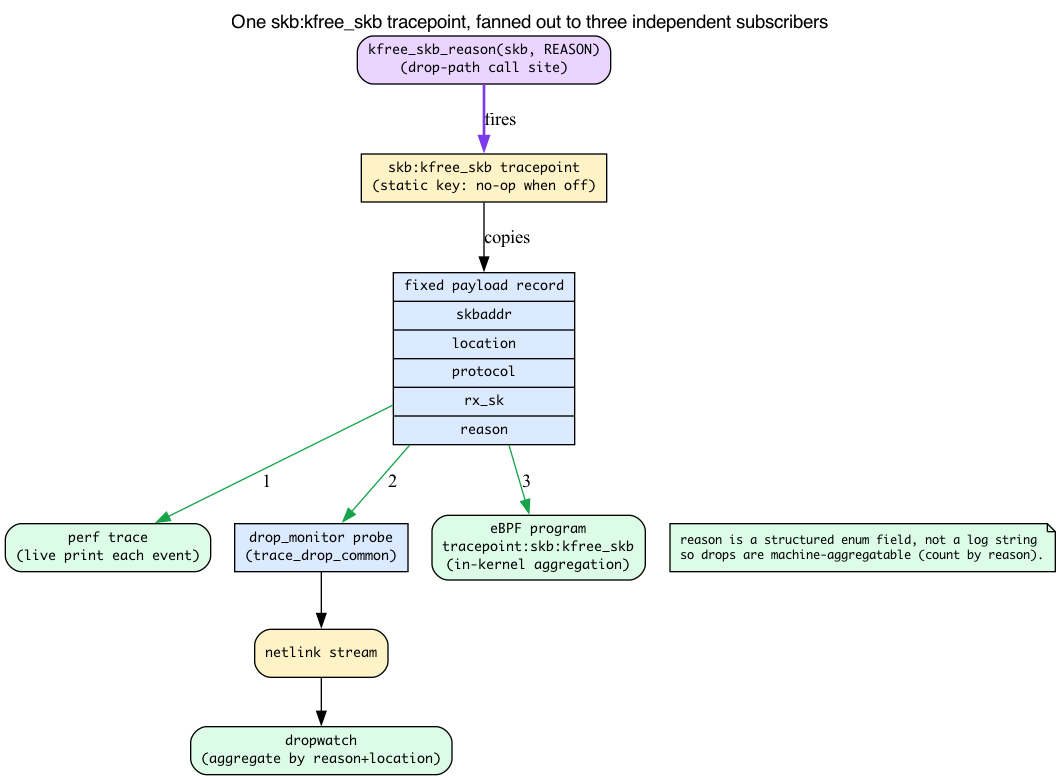
The payoff the chapter keeps asserting — “perf, dropwatch, and BPF all see the same drops” — falls straight out of how tracepoints dispatch. Multiple consumers attach to the same hook independently, and the kernel fans the payload out to all of them:
perf tracesubscribes and prints each event live.- The in-kernel
drop_monitorregisters a probe withregister_trace_kfree_skb(ops->kfree_skb_probe, NULL)(net/core/drop_monitor.c:1164); the registered probe istrace_kfree_skb_hit(drop_monitor.c:485), which dispatches to the shared aggregatortrace_drop_common(drop_monitor.c:216) and forwards events to userspace over netlink — which is what thedropwatchtool reads. - eBPF programs can attach to
tracepoint:skb:kfree_skband run arbitrary aggregation in-kernel.
One kfree_skb_reason call site, three independent subscribers, zero cost when none are attached. That is why this chapter’s observability all comes back to a single hook.
Background 2: generic netlink — the family layer PSP, devlink, and ethtool share
Three of today’s subsystems (PSP config, devlink, and the ethtool the YAML toolchain talks to) speak generic netlink. Day 8 already taught you the netlink substrate; here we teach only the one new layer on top.
Recall from Day 8 (Background 4, the rtnetlink path): netlink is a socket-based control-plane protocol — userspace opens an
AF_NETLINKsocket and exchanges structured messages built from TLV (type-length-value) attributes, with a dump form (list everything) and a do form (one operation). Day 8’sip/ss/tctraffic all rodeNETLINK_ROUTE, a fixed, statically-numbered protocol. We do not re-teach any of that.
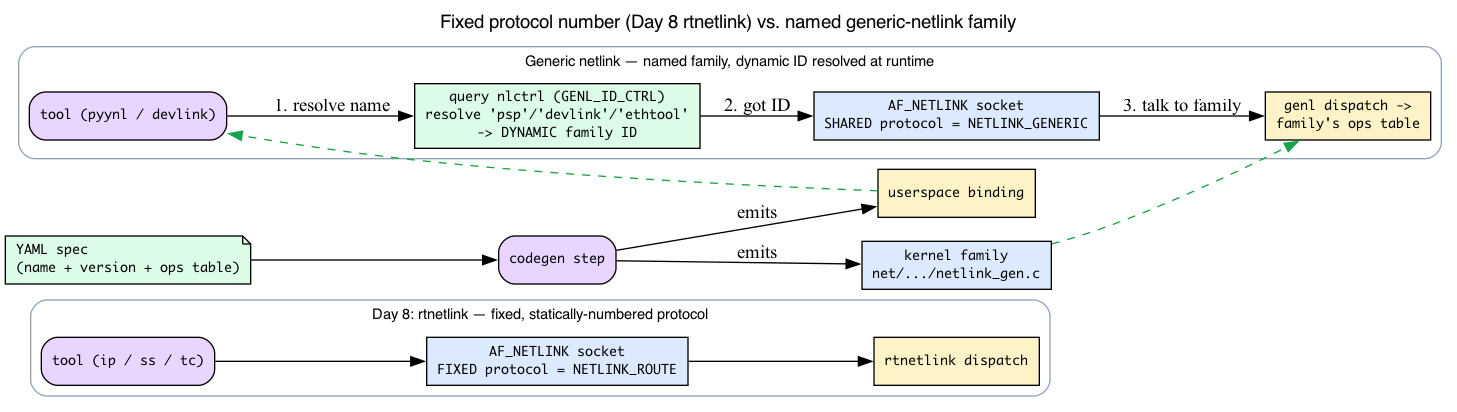
Here is the new problem. A netlink socket is opened against one of a small, fixed set of NETLINK_* protocol numbers — NETLINK_ROUTE, NETLINK_NETFILTER, and so on. There are only 32 such slots, and they are a scarce, static resource. If every new subsystem — PSP, devlink, ethtool, DPLL, conntrack-over-netlink — claimed its own NETLINK_* number, the space would have been exhausted years ago.
So modern subsystems do not each grab a protocol number. Instead they register a generic netlink family: a named multiplexed channel living under the single shared protocol NETLINK_GENERIC. The family is identified by a string name — "psp", "devlink", "ethtool" — not a compiled-in number:
/* net/psp/psp-nl-gen.c:129 */
struct genl_family psp_nl_family __ro_after_init = {
    .name = PSP_FAMILY_NAME,          /* "psp"  — include/uapi/linux/psp.h:10 */
    /* .version, .ops table, ... */
};

/* net/devlink/netlink.c:398 */
struct genl_family devlink_nl_family __ro_after_init = {
    .name = DEVLINK_GENL_NAME,        /* "devlink" — include/uapi/linux/devlink.h:18 */
    /* ... */
};
(ethtool’s family name is ETHTOOL_GENL_NAME "ethtool", include/uapi/linux/ethtool_netlink_generated.h:10 — that’s the family the working pyynl rings-get dump at the end of this chapter talks to.)
Name → ID resolved at runtime
The family’s numeric ID is allocated dynamically at registration. genl_register_family(struct genl_family *family) (net/netlink/genetlink.c:775, EXPORT_SYMBOL at :840) hands out an ID at boot/module-load time — PSP comes online via exactly this call (net/psp/psp_main.c:377: return genl_register_family(&psp_nl_family);).
So how does a userspace tool find that runtime ID? It asks the one family with a fixed ID — the controller family nlctrl (.id = GENL_ID_CTRL, .name = "nlctrl", genetlink.c:1805-1806). The tool sends nlctrl a “resolve this name” request, gets back the dynamic family ID, and then talks to the subsystem. This runtime name resolution is precisely why pyynl/cli.py takes a --spec and a family name and “just works” with no hand-assigned protocol number.
Why this makes the YAML codegen possible
Look at the struct again: a genl family is just a name, a version, and an ops table. That regularity is what lets the YAML story (next-to-last section) work — a YAML spec describes exactly those fields, so a generator can emit both the kernel-side family (net/.../netlink_gen.c) and the userspace binding from one file. A statically-numbered protocol with hand-rolled message parsing (Day 8’s rtnetlink) couldn’t be generated that mechanically; a genl family can.
PSP — Packet Security Protocol
A datacenter-scale L4 encryption protocol developed by Google, contributed to Linux in 2025 (in-tree by 7.x).
- What: symmetric authenticated encryption applied to L4 payloads inside a UDP encapsulation (
PSP_DEFAULT_UDP_PORT1000); the in-tree Linux socket integration upgrades TCP connections. Per-flow keys, designed for hardware offload (NICs with PSP-aware crypto). - Why: datacenter operators want confidentiality and integrity on internal traffic without IPsec’s complexity (IKE, SA database, kernel SADB) or TLS’s per-connection handshake. PSP is lightweight: per-flow shared secret negotiated out of band, then plain symmetric crypto on every packet.
- When: datacenter East-West traffic between trusted hosts running compatible PSP stacks. Not for internet-facing.
- Where:
net/psp/—psp_main.c(registration),psp_sock.c(socket integration),psp_nl.c(netlink config interface),psp.h(UAPI). - Status: in-tree but new; tooling (
ip psp ...via iproute2) is being established. Practical use is mostly inside Google for now; broader adoption pending.
You already have every prerequisite for PSP from earlier days — PSP is mostly a recombination of things you’ve built:
The UDP encapsulation (recall Day 12). PSP rides UDP destination port 1000 — the same encapsulate-then-demux-by-port pattern you built for VXLAN in Day 12. On TX,
psp_dev_encapsulate(net/psp/psp_main.c:224) callspsp_write_headers, which setsuh->dest = htons(PSP_DEFAULT_UDP_PORT)(psp_main.c:171); on RX,psp_dev_rcvdemuxes onuh->dest == htons(PSP_DEFAULT_UDP_PORT)(psp_main.c:313). No new tunnel mechanism — reuse Day 12’s mental model.
The crypto (recall Day 25). “Symmetric authenticated encryption” and “per-flow shared secret negotiated out of band, then plain symmetric crypto on every packet” is the same AEAD-after-out-of-band-handshake split you saw in kTLS on Day 25 — bulk symmetric crypto in the steady state, key negotiation done elsewhere. The contrast worth one sentence: kTLS keys are per-TCP-connection (a ULP) and aimed at the software/offload boundary, whereas PSP keys are per-flow and designed specifically for hardware crypto offload in the NIC. The per-flow key material lives in a PSP association created by
psp_assoc_create(net/psp/psp_sock.c:47); installing it for offload ispsp_dev_tx_key_add→psd->ops->tx_key_add(psp_sock.c:80), which hands the key down to the NIC.psp_key_size(version)(psp_main.c:149) returns how much key material a given PSP version needs.
So PSP is genuinely new as a protocol, but for a reader who did Day 12 and Day 25 there is no new background to learn — only a new place those two ideas combine, registered as a generic-netlink family (psp, Background 2) and brought online by genl_register_family(&psp_nl_family) at psp_main.c:377.
drop_monitor + kfree_skb_reason
Observability infrastructure for “where do packets get dropped?” — and now (Background 1) you know exactly what it’s built on.
net/core/drop_monitor.c. It registers a probe on the skb:kfree_skb tracepoint (register_trace_kfree_skb, drop_monitor.c:1164) and, in its default summary mode, aggregates the events by call-site location inside the kernel (trace_drop_common, drop_monitor.c:216 — the summary record struct net_dm_drop_point carries only pc + count, no reason field, so trace_kfree_skb_hit passes the reason argument straight through to trace_drop_common without keying on it), forwarding the aggregate to userspace over netlink. The drop reason is carried per-event only in drop_monitor’s optional packet mode (net_dm_packet_trace_kfree_skb_hit stashes cb->reason and emits NET_DM_ATTR_REASON); the live histogram you build later aggregates by reason in userspace (perf trace | awk | sort | uniq), not in the drop_monitor summary path. Combined with kfree_skb_reason (Day 1), that gives you a categorized dropwatch.
The kfree_skb_reason API:
kfree_skb_reason(skb, SKB_DROP_REASON_TCP_INVALID_SEQUENCE);
Replaces the older kfree_skb(skb) (which, recall from Background 1, is now just this with NOT_SPECIFIED). The reason is one of ~125 categories — the core enum in include/net/dropreason-core.h runs up to SKB_DROP_REASON_MAX (dropreason-core.h:613), and subsystems add their own on top:
enum skb_drop_reason {     /* include/net/dropreason-core.h:138; values/order abridged */
    SKB_DROP_REASON_NOT_SPECIFIED,        // :146  legacy callers (what plain kfree_skb emits)
    SKB_DROP_REASON_NO_SOCKET,            // :154  no listener
    SKB_DROP_REASON_PKT_TOO_SMALL,        // :173  truncated
    SKB_DROP_REASON_TCP_CSUM,             //       bad TCP checksum
    SKB_DROP_REASON_SOCKET_FILTER,        //       BPF socket filter dropped
    SKB_DROP_REASON_UDP_CSUM,
    SKB_DROP_REASON_NETFILTER_DROP,       //       iptables/nftables rule
    SKB_DROP_REASON_TC_INGRESS,
    /* ... up to SKB_DROP_REASON_MAX at :613, plus per-subsystem reasons ... */
};
The names are real; the order/values are abridged for illustration. The list is generated from the DEFINE_DROP_REASON table — the same table TP_printk uses (Background 1) to render reason into a string.
Why the change: old kfree_skb gave no signal beyond “a packet died here.” With reasons, dropwatch tells you SOCKET_FILTER (a BPF filter dropped) vs NETFILTER_DROP (a firewall rule did) vs IP_INHDR (the packet was malformed). Differentiating those is the difference between “fix my firewall rules” and “fix my broken sender” — and the structured-enum property from Background 1 is what makes those categories countable in the histogram you’re about to build.
Inspect drops:
An idle box drops almost nothing, so provoke some NO_SOCKET drops first. In another terminal, hit a closed port a few times — each attempt is dropped with no listener:
for i in $(seq 1 50); do curl -s --max-time 1 http://localhost:1 >/dev/null; done
While that runs, watch the live event stream. perf trace is one of the tracepoint subscribers from Background 1 — it attaches to skb:kfree_skb and prints each payload record as it fires:
# Live event stream with reasons (timeout so it terminates cleanly)
sudo timeout 10 perf trace --no-syscalls -e skb:kfree_skb 2>&1 | head -50
Each line names the call site that freed the skb plus the reason category — these are the location and reason fields of the payload record we read in Background 1:
0.104 curl/506057 skb:kfree_skb(skbaddr: 0xffff..., location: 0xffff..., rx_sk: 0xffff..., protocol: 2048, reason: SKB_DROP_REASON_NO_SOCKET)
dropwatch is the second subscriber from Background 1 — it reads the drop_monitor netlink stream and aggregates the same tracepoint by call-site location (and, in packet mode, surfaces the per-event reason). It ships in its own dropwatch package (apt install dropwatch / dnf install dropwatch) — skip this block if it isn’t installed:
sudo dropwatch -l kw # 'kw' = kallsyms based
That drops you at dropwatch’s interactive prompt (dropwatch>); type start, generate drops, then stop. The parenthesized reason below appears only when dropwatch is run in packet mode — the -l kw summary mode shown here emits call-site location + count only (Background 1’s net_dm_drop_point), so a real summary line carries no reason string:
dropwatch> start
1 drops at tcp_v4_rcv+0x2a (SKB_DROP_REASON_NO_SOCKET)   # reason shown only in packet mode
dropwatch> stop
To aggregate reasons over a window, bound perf trace with timeout before the pipe — perf trace streams forever, and sort/uniq only print after the input stream ends, so they need a clean EOF:
# Aggregate by reason
sudo timeout 10 perf trace --no-syscalls -e skb:kfree_skb 2>&1 | awk '{print $NF}' | sort | uniq -c | sort -rn | head
With the closed-port loop running, one category dominates the histogram. Which one is path- and environment-dependent: the loopback RST path may yield SKB_DROP_REASON_NO_SOCKET, but you’ll also commonly see SKB_DROP_REASON_QUEUE_PURGE or SKB_DROP_REASON_NOT_SPECIFIED depending on how the closed-port reset is handled:
160 SKB_DROP_REASON_NO_SOCKET)
That histogram is only possible because reason is a structured enum field, not a log message — the mechanism Background 1 spelled out.
Adopting kfree_skb_reason is an ongoing kernel project. Many call sites still use plain kfree_skb; new code is expected to use _reason.
devlink — generic device control
net/devlink/. A netlink-based generic interface for device-level configuration that doesn’t fit ethtool. Concretely (Background 2) it’s the generic-netlink family named "devlink" (net/devlink/netlink.c:398) — which is why a brand-new device knob doesn’t need its own NETLINK_* number.
What ethtool does: per-NIC counters, ring sizes, offload flags. It’s been growing for years and getting sloppy at the edges.
What devlink does: more abstract device knobs.
- SR-IOV management: configure virtual functions, switchdev mode, port representors.
- Health reporting: hardware/firmware telemetry, recovery actions.
- Resource control: device-internal table sizes (bridge FDB, IPv4 routes, ACLs).
- DPLL (Digital PLL): time-synchronization for 5G and HFT applications.
- Per-port congestion-control profiles: configure NIC-level CC behavior.
That first bullet packs four terms no earlier day taught. Here’s the one-paragraph demystifier so the bullet stops being four black boxes:
Refresher: SR-IOV, PF/VF, switchdev, port representors
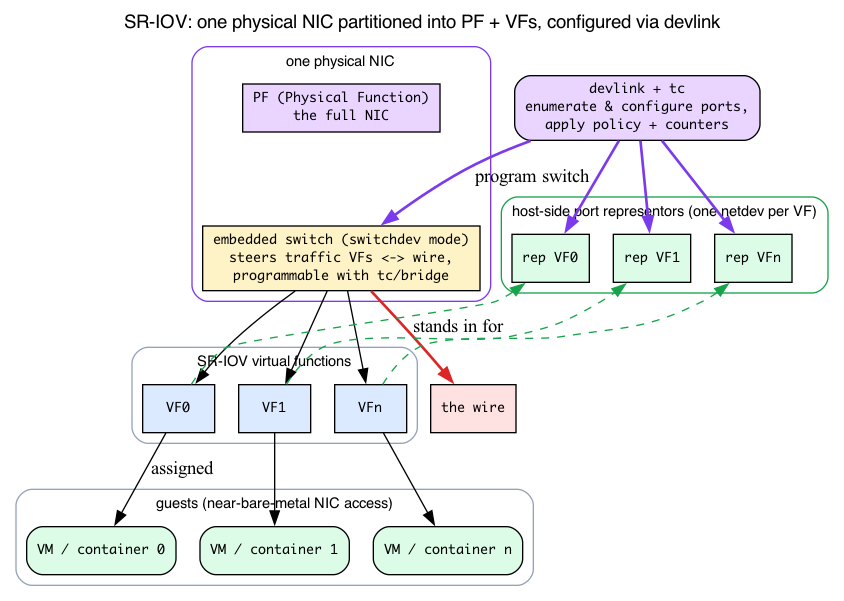
SR-IOV (Single-Root I/O Virtualization) lets one physical NIC present itself as many lightweight PCIe devices: one Physical Function (PF) — the full NIC — plus N Virtual Functions (VFs), each assignable to a VM or container so it gets near-bare-metal NIC access without the host’s software switch sitting on its data path. switchdev mode means the NIC’s built-in hardware switch — the thing that steers traffic between those VFs and the wire — is exposed to Linux so you can program it with ordinary
tc/bridgetooling instead of vendor-proprietary knobs. A port representor is a host-side netdev that stands in for one VF (or one physical port), so the host can attach counters,tcrules, and policy to a VF’s traffic it otherwise couldn’t see. devlink is the channel that enumerates and configures all of this — which is why SR-IOV lives under devlink, not ethtool. (Kernel side:net/devlink/port.cholds the port objects behinddevlink port show, including port-flavour/representor handling; the per-port rate and shared-buffer knobs behind the “per-port congestion-control” and “resource control” bullets live innet/devlink/rate.candnet/devlink/sb.c.)
Tools: devlink dev show, devlink port show, devlink dev info, devlink resource show. The iproute2 package ships the devlink binary.
Run devlink dev show first and copy one of the listed handles into the next two commands — pci/0000:01:00.0 below is a placeholder that almost certainly won’t match your NIC:
devlink dev show
# Substitute a handle from the line above, e.g.:
devlink dev info pci/0000:01:00.0
devlink resource show pci/0000:01:00.0
On virtio-net / hv_netvsc / most cloud-VM NICs devlink dev show prints nothing — those drivers don’t register a devlink instance, so there is no handle to inspect. You need an mlx5 / ice / nfp device (some cloud VMs expose an mlx5 SR-IOV VF) to see real output. Even then resource show often returns Operation not supported — it’s driver-specific (see below).
devlink is driver-specific — each driver opts in by registering its capabilities. mlx5, ice (Intel), nfp (Netronome) have rich devlink support; many older drivers don’t.
NETLINK YAML and libynl
Netlink is the kernel’s preferred control-plane protocol — ip, ss, nft, tc, all of devlink, and most modern subsystems use it (and, as Background 2 showed, the newer ones via generic-netlink families). Adding new netlink ops historically required:
- Define the protocol’s UAPI structs/enums.
- Implement the kernel-side handler.
- Write the userspace parsing/formatting code (often in libnl, iproute2, or a custom binding).
The third step was the bottleneck — every binding had to be written by hand for every new netlink subsystem. So the kernel community now writes netlink protocols as YAML specifications, and tooling auto-generates bindings. This is exactly the regularity Background 2 pointed at: a genl family is just a name + version + ops table, so a YAML file can describe it completely and a generator can emit both ends.
The YAML specs live at Documentation/netlink/specs/:
Documentation/netlink/specs/
├── conntrack.yaml
├── devlink.yaml
├── dpll.yaml
├── ethtool.yaml
├── handshake.yaml
├── nlctrl.yaml       # the controller family from Background 2
├── psp.yaml          # PSP's spec
└── ...
Each spec describes the protocol’s messages, attributes, types. From these, tools generate:
- C bindings for the kernel side (in
net/.../netlink_gen.c— e.g. devlink’snet/devlink/netlink_gen.c). - Python bindings (
tools/net/ynl/pyynl/). - C library code (
tools/net/ynl/lib/). - Test scaffolding.
The generator is tools/net/ynl/. Adding a new netlink protocol is now: write the YAML, run the generator, implement only the actual logic.
Practical impact: new features land with bindings on day one. Less drift between kernel UAPI and userspace tooling.
Other 2024–2026 highlights
A grab bag of features that aren’t dedicated days but matter:
Resilient nexthop groups (Day 9)
ECMP that survives nexthop changes without re-hashing every flow.
tcx and netkit (Day 17 of eBPF book / Day 23 of network book)
Modern tc-bpf attach with bpf_link lifecycle and link-based multi-program ordering. Replaces classic tc filter add bpf for new code.
bigtcp
TCP segments larger than 64 KB on the local stack (up to ~512 KB, GSO_MAX_SIZE). Useful for very fast NICs (200/400 Gbps) where the per-segment overhead becomes the bottleneck. Configurable via ip link set <dev> gso_max_size <bytes> and matching gro_max_size.
Page Pool memory provider
Improved zero-copy receive (in progress). Lets receivers get packet payloads without copying from kernel page-cache pages. Integrated with io_uring’s zero-copy recv work.
net_iov and skb fragments
Unifies the “skb frags hold pages” model with io_uring’s iovec model. Gives a single representation that both kernel networking and io_uring’s I/O batching can use. Reduces translation overhead. (You met net_iov already on Day 1 — it’s the non-page memory a frag’s netmem_ref can encode.)
Smart NIC offload progress
Per-flow TLS offload (Day 25) is well-established. Inline IPsec offload landed in 2024. Per-flow QoS offload (some NICs support arbitrary classification rules) keeps maturing.
There are no Dumb Questions
Q: If a tracepoint is “zero cost when off,” how does turning it on not require recompiling the kernel?
A: The call site is patched at runtime. A tracepoint compiles to a static key — a branch that the kernel rewrites in place (a no-op when no consumer is attached, a real call when one is). Registering a probe (
register_trace_kfree_skb,perf, or a BPF attach) flips the key on; the last consumer detaching flips it back off. So “off” is genuinely a no-op in the instruction stream, and “on” needs no rebuild — only a live code patch.
Q: Why does PSP get a generic-netlink family instead of its own
NETLINK_*number like rtnetlink?A: Because the 32
NETLINK_*protocol slots are a scarce static resource (Background 2). Every modern subsystem — PSP, devlink, ethtool, DPLL — registers a named generic-netlink family under the single sharedNETLINK_GENERICprotocol instead, getting a dynamically-allocated ID that userspace resolves at runtime by name vianlctrl. That’s also what makes the YAML codegen possible: a family is a uniform name+version+ops record a generator can describe.
Q:
perf trace,dropwatch, and a BPF program are all watching drops at once. Do they interfere?A: No — they’re independent subscribers to the same
skb:kfree_skbtracepoint (Background 1). The kernel fans each fired payload record out to every registered listener.perfprints,dropwatch(via the drop_monitor probe and netlink) aggregates, BPF runs its own program — none of them consumes the event so the others miss it.
Today’s experiment
The drop_monitor section already walked you through the full perf trace histogram (provoke NO_SOCKET drops with the closed-port curl loop, then aggregate by reason) — re-run that histogram now if you skipped it, then move on to the two probes the body only described but never ran hands-on: devlink enumeration and a YAML-generated python tool.
# Probe devlink
which devlink && devlink dev show
Prints one device handle per registered device — or nothing on virtio/cloud NICs that register no devlink instance.
# Look at the YAML netlink specs
cd ~/code/linux                    # your kernel source tree
ls Documentation/netlink/specs/
Lists the per-protocol .yaml spec files, including devlink.yaml, ethtool.yaml, and psp.yaml.
# Try a YAML-generated python tool. Install the ynl deps first:
pip install -r tools/net/ynl/requirements.txt   # or: pip install jsonschema pyyaml
cd tools/net/ynl
# ethtool's spec decodes cleanly against a stock NIC — dump the ring sizes:
python3 ./pyynl/cli.py --spec ../../../Documentation/netlink/specs/ethtool.yaml \
    --dump rings-get 2>&1 | head     # may need root
This prints a JSON object per interface — the kernel’s ethtool ring config, fetched over netlink with zero hand-written C (the nlctrl name-resolution from Background 2 does the wiring):
[{'header': {'dev-index': 2, 'dev-name': 'eth0'}, 'rx': 9362, 'rx-max': 18139, ...}]
The genuinely new lesson here is two gotchas the body’s YAML section didn’t cover. Op naming: ops are get/rings-get, not dev-get — --do dev-get raises KeyError: 'dev-get'. Use --dump <op> (lists every instance, like devlink dev show) since the --do form needs a specific id. Spec-vs-kernel skew: the YAML specs track mainline, so dumping a spec whose attributes are newer/older than your running driver can raise YnlException: Space '...' has no attribute with value 'N' — e.g. devlink.yaml --dump get against an mlx5 device on this kernel. That’s a spec/kernel version mismatch, not a bug in your invocation; the stabler specs like ethtool.yaml decode cleanly. Without the deps you’ll instead see ModuleNotFoundError: No module named 'jsonschema'.
What to read in the kernel
-
include/trace/events/skb.h— theTRACE_EVENT(kfree_skb)declaration (line 24). ReadTP_PROTO(line 26),TP_STRUCT__entry(line 31), and theTP_printk(line 47) to see the exact payload every subscriber receives. -
net/psp/— PSP. Readpsp_main.cfirst (~380 lines — confirmed 380) for the registration model (genl_register_family(&psp_nl_family)at line 377), thenpsp_sock.cfor the socket-side integration (psp_assoc_createat line 47,psp_dev_tx_key_addat line 80). -
include/net/dropreason-core.h— theenum skb_drop_reasonlist (line 138, up toSKB_DROP_REASON_MAXat line 613). Skim. Tells you what categories of drops dropwatch can report. -
net/core/drop_monitor.c— the drop-monitor implementation. Readtrace_drop_common(line 216) to see how the tracepoint is dispatched to userspace via netlink, andregister_trace_kfree_skb(line 1164) to see the probe attach. -
net/netlink/genetlink.c— generic netlink core.genl_register_family(line 775) for dynamic ID allocation, and the controller familynlctrl(.id = GENL_ID_CTRL, lines 1805-1806) that userspace queries to resolve a family name. -
net/devlink/— devlink core. ~15000 lines across multiple files. Readcore.cfor the registration model,dev.cfor device lifecycle,health.cfor the health-reporter framework, andport.c/rate.c/sb.cfor the SR-IOV port and per-port-resource knobs. -
Documentation/netlink/specs/— the YAML protocol specs. Opendevlink.yamlorethtool.yaml; the structure is self-descriptive. -
tools/net/ynl/— the YAML processing toolchain.pyynl/cli.pyis a runnable example. -
Documentation/networking/devlink/— devlink user-facing docs. Subsystem-specific writeups. -
External: the netdev mailing list (
netdev@vger.kernel.org) is where these things land. Subscribe if you want to track future features in real time.
Bullet Points
- A tracepoint is a named, static, zero-cost-when-off hook declared with
TRACE_EVENT;kfree_skb_reasonfiresskb:kfree_skb, whose payload carriesskbaddr/location/protocol/rx_sk/reason. Thereasonbeing a structured enum (not a log string) is what makes drops machine-aggregatable. - Generic netlink lets PSP/devlink/ethtool register named families under the single
NETLINK_GENERICprotocol (vs. Day 8’s fixedNETLINK_ROUTE); IDs are allocated atgenl_register_familyand resolved by name at runtime vianlctrl. This regularity is what makes the YAML codegen possible. - PSP — Google’s lightweight datacenter L4 encryption. UDP-encapsulated (port 1000, recall Day 12) with per-flow AEAD keys for NIC offload (recall Day 25). In-tree 7.x;
net/psp/. kfree_skb_reason+ drop_monitor — categorized drop attribution over theskb:kfree_skbtracepoint. Replacekfree_skbin new code.- devlink — netlink-based generic device control. Replaces ad-hoc ethtool extensions for SR-IOV (PF/VF/switchdev/representors), DPLL, health reporting, resource control.
- NETLINK YAML + libynl (
tools/net/ynl/) — YAML-driven binding generation. New protocols ship with bindings. - bigtcp — segments > 64 KB locally for very fast NICs.
- Resilient nexthop groups — ECMP without re-hash on nexthop change (Day 9).
- tcx + netkit — modern tc-bpf with link-based lifecycle.
Check question
Why is kfree_skb_reason strictly better than kfree_skb in new code, and what infrastructure depends on it?
Click to reveal answer
Answer: It feeds the drop monitor with a category enum, making “where do my drops come from?” answerable. Plain kfree_skb just disposes of the skb; kfree_skb_reason(skb, SKB_DROP_REASON_X) does the same plus emits a tracepoint skb:kfree_skb whose payload includes the reason (Background 1). Tools that depend on this:
dropwatchaggregates drops by category and source location, reporting top contributors over time (via the drop_monitor probe → netlink).perf trace --no-syscalls -e skb:kfree_skbprints each drop with the category in real time.- eBPF programs can attach to the tracepoint (e.g.,
tracepoint:skb:kfree_skb) and apply custom aggregation.
All three are independent subscribers to the same hook — that’s the tracepoint fan-out from Background 1.
Without _reason, you can still see that a drop happened (the tracepoint fires for plain kfree_skb too, since kfree_skb is literally kfree_skb_reason(skb, NOT_SPECIFIED)) but you can’t tell why — and the most common reason of all becomes SKB_DROP_REASON_NOT_SPECIFIED, which is useless for diagnosis.
In a kernel with full _reason adoption, you can do meaningful “why are my packets being dropped?” analysis without strace, ftrace, or guesswork. The conversion of every legacy kfree_skb call site is an ongoing project; new code is required to use the reason’d variant.
Tomorrow
Day 30: capstone — pick a real packet and trace it end to end through every kernel layer you’ve learned.