Day 6 — fentry/fexit and the latency-measurement pattern
Today’s mission: measure the latency of every
vfs_readon your system. Build a map keyed by thread, store the entry timestamp on call-in, retrieve it on call-out, emit duration to userspace. Along the way: meetfexitand understand exactly how it differs from the olderkretprobe(the return-address swap, the instance pool, why bursts get missed), learn whatvfs_readactually is and what its return value means, and pick the right per-thread key. Total time: ~110 minutes.
Phase 2 starts here. Days 1–5 made you fluent with libbpf, CO-RE, maps, and the Verifier. Days 6–13 turn that fluency into tracing: typed kernel-function tracing at scale, tracepoints, stack traces, uprobes, and sleepable programs. By Day 13 you’ll be able to write the kind of tracer that ships in production observability tools.
The pattern that powers every tracer
Most tracing problems reduce to one shape:
“When event A happens, remember something. When the matching event B happens, retrieve and act on it.”
For latency: A = function entry, B = function exit. Remember the timestamp on A; on B compute now - remembered.
Yesterday you saw fentry. Today you meet its other half — fexit — and use them as a pair to do the most common BPF tracing pattern in the world.
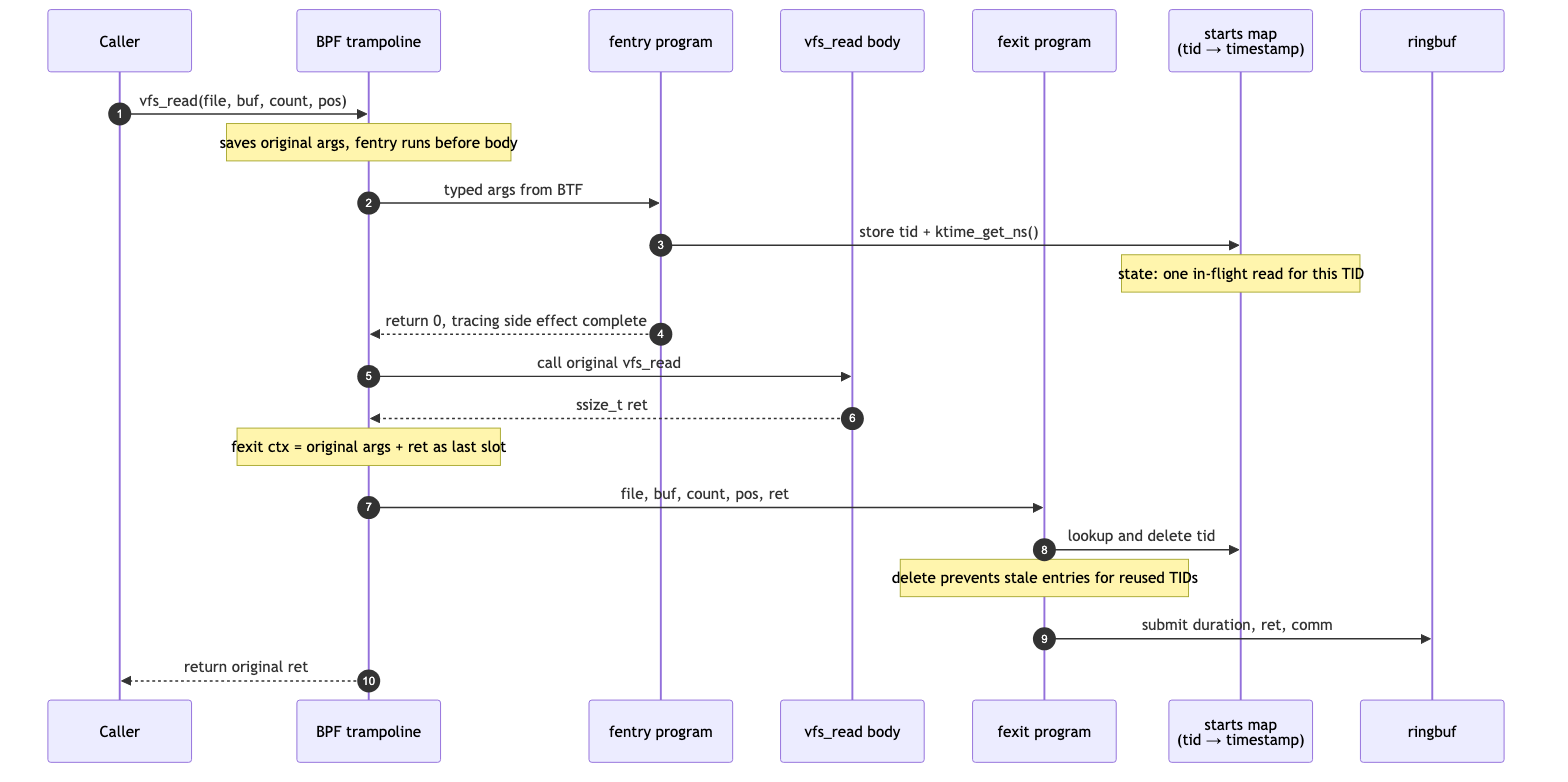
The fentry program runs before the function body. The fexit program runs after it. Both are connected to the same trampoline; the kernel installs them as a coordinated pair when you load the BPF object. Between entry and exit, the function does its work — could be 100 ns, could be 100 ms.
What is vfs_read, and what does its return value mean?
Before we hook anything, know your target. Today we trace vfs_read, and the lab only makes sense if you know two facts about it.
First: vfs_read is the kernel’s single central entry point for the read(2)/pread(2) family of syscalls. Every file-descriptor read — whether the fd is a regular file, a socket, a pipe, /dev/zero, or a procfs node — funnels through vfs_read before the kernel dispatches to that particular filesystem’s own read handler. That makes it a perfect chokepoint: hook vfs_read once and you see all reads on the box. (You actually used fentry/vfs_read back in a Day 2 break without explanation — now you know why it’s such a popular target.)
Second: its signature is exactly the four typed arguments our fentry program will declare, and its return type is exactly what fexit captures. In v7.1:
/* fs/read_write.c:554 */
ssize_t vfs_read(struct file *file, char __user *buf, size_t count, loff_t *pos)
struct file *file— the open file the fd refers to (Day 1 notedstruct filelives invmlinux.h; that’s all we need).char __user *buf— the userspace destination buffer.size_t count— how many bytes the caller asked for.loff_t *pos— pointer to the file offset.
The return type ssize_t is the contract our fexit program reads. On success it’s the number of bytes actually read — which can be less than count (a short read, or EOF returning 0). On failure it’s a negative errno. You can see all three failure returns right at the top of the function:
/* fs/read_write.c:558-563 */
if (!(file->f_mode & FMODE_READ))
    return -EBADF;
if (!(file->f_mode & FMODE_CAN_READ))
    return -EINVAL;
if (unlikely(!access_ok(buf, count)))
    return -EFAULT;
and the success value comes straight from the filesystem’s own read op:
/* fs/read_write.c:571-573 */
if (file->f_op->read)
    ret = file->f_op->read(file, buf, count, pos);
else if (file->f_op->read_iter)
    ret = new_sync_read(file, buf, count, pos);
That’s why today’s lab prints the return value as a signed number labelled “bytes”: vfs_read → 2543 bytes is a successful 2543-byte read; a negative number would be an errno. We don’t need the full VFS read path (->read vs ->read_iter dispatch) — just “central read chokepoint” and “return = bytes-or-negative-errno,” so the output isn’t magic.
Meet fexit
fexit is the counterpart to fentry: it attaches at function return. But unlike fentry, you also get the return value handed to you as a typed argument. That last argument matters — it’s what makes fexit strictly more powerful than the older kretprobe.
To appreciate why fexit is the better tool, you have to understand how the old return-probe machinery works — because the chapter is about to contrast against it repeatedly, and a kretprobe hooks a function’s return in a fundamentally trickier way than the entry kprobe you already know.
Refresher: the entry kprobe (Day 1)
Day 1 already explained the entry kprobe: it overwrites the probed function’s first instruction with an int3 breakpoint byte. When the CPU executes that byte it traps, the kprobe handler runs, then the original instruction is single-stepped or emulated and execution continues. On x86 the emulation helpers are right there — int3_emulate_call, int3_emulate_ret, int3_emulate_jmp (arch/x86/kernel/kprobes/core.c:507-525). We do not re-teach that here. The entry hook is solved.
The new question is: how do you run code at the return? There’s no single instruction to breakpoint — a function can ret from many places, and the same code runs for every caller.
How a kretprobe hijacks the return address
A kretprobe is layered on top of an entry kprobe, and it plays a stack trick:
- At function entry, the kprobe handler reads the function’s real return address off the kernel stack and saves it in a per-call object. Then it overwrites that saved return address on the stack with the address of a kernel trampoline.
- The function runs normally and eventually does
ret. Butretnow pops the trampoline address, not the real caller — so control lands in the trampoline. - The trampoline runs your return handler (which can read the return value), then jumps to the real saved caller address so the program continues as if nothing happened.
On x86 that trampoline is hand-written assembly whose address is what gets stuffed onto the stack:
/* arch/x86/kernel/rethook.c:26-38 */
"arch_rethook_trampoline:\n"
    ...
    "   pushq $arch_rethook_trampoline\n"   /* fake return addr for the unwinder */
    ...
    "   call arch_rethook_trampoline_callback\n"
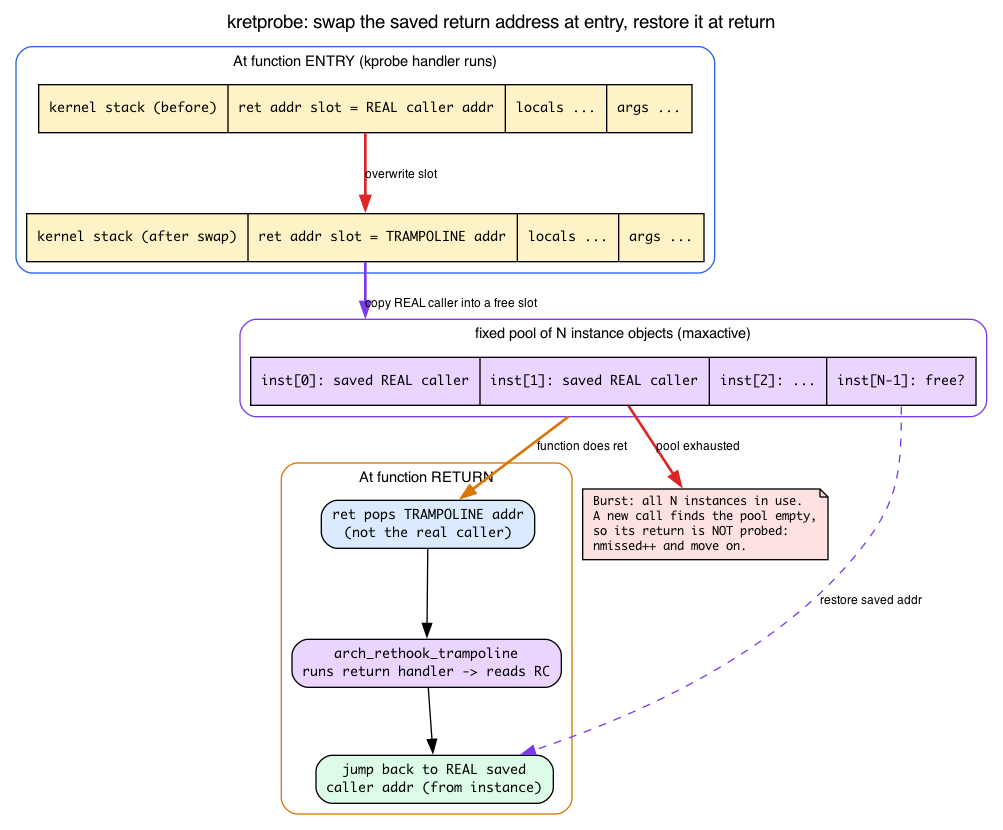
The instance pool. To save that real return address you need one object per in-flight call. Recursion, preemption, and many CPUs all mean several calls to the same function can be “in flight” at once, each needing its own saved address. So the kernel pre-allocates a fixed pool of these objects, sized by maxactive. The fields live right in struct kretprobe:
/* include/linux/kprobes.h:150-154 */
int maxactive;
int nmissed;
...
struct rethook *rh;
and the per-call save object is:
/* include/linux/kprobes.h:162-164 */
struct kretprobe_instance {
    ...
    struct rethook_node node;
    ...
};
The in-tree comment spells out the sizing contract: “maxactive - The maximum number of instances of the probed function that can be active concurrently” and “nmissed - tracks the number of times the probed function’s return was ignored, due to maxactive being too low” (include/linux/kprobes.h:135-138). If more calls are in flight simultaneously than the pool size, the extra returns simply aren’t probed — the kernel bumps nmissed and moves on. That’s what “bursts can exhaust the instances pool” means, made concrete: a sudden flood of concurrent calls silently loses return events.
The unwinder problem. Because the kretprobe rewrote the saved return address, anything that walks the kernel stack to reconstruct caller frames sees the trampoline address where the true caller should be. In the kernel this means the in-kernel stack unwinders (ORC on x86_64, frame-pointer unwinding) that back dump_stack(), /proc/<pid>/stack, perf/ftrace backtraces, and bpf_get_stack — there is no C++ exception machinery in the kernel; it’s all C. (The x86 trampoline even pushes a fake $arch_rethook_trampoline frame to tell the unwinder “this is a rethook,” precisely because the real return address is hidden.) This is the “stack-modifying tricks break unwinding” remark, made concrete.
Why fexit avoids all of that
fexit is part of the same trampoline fentry uses. The trampoline saves arguments on entry, calls fentry programs, calls the original function, gets the return value, appends it to the context array, then calls fexit programs.
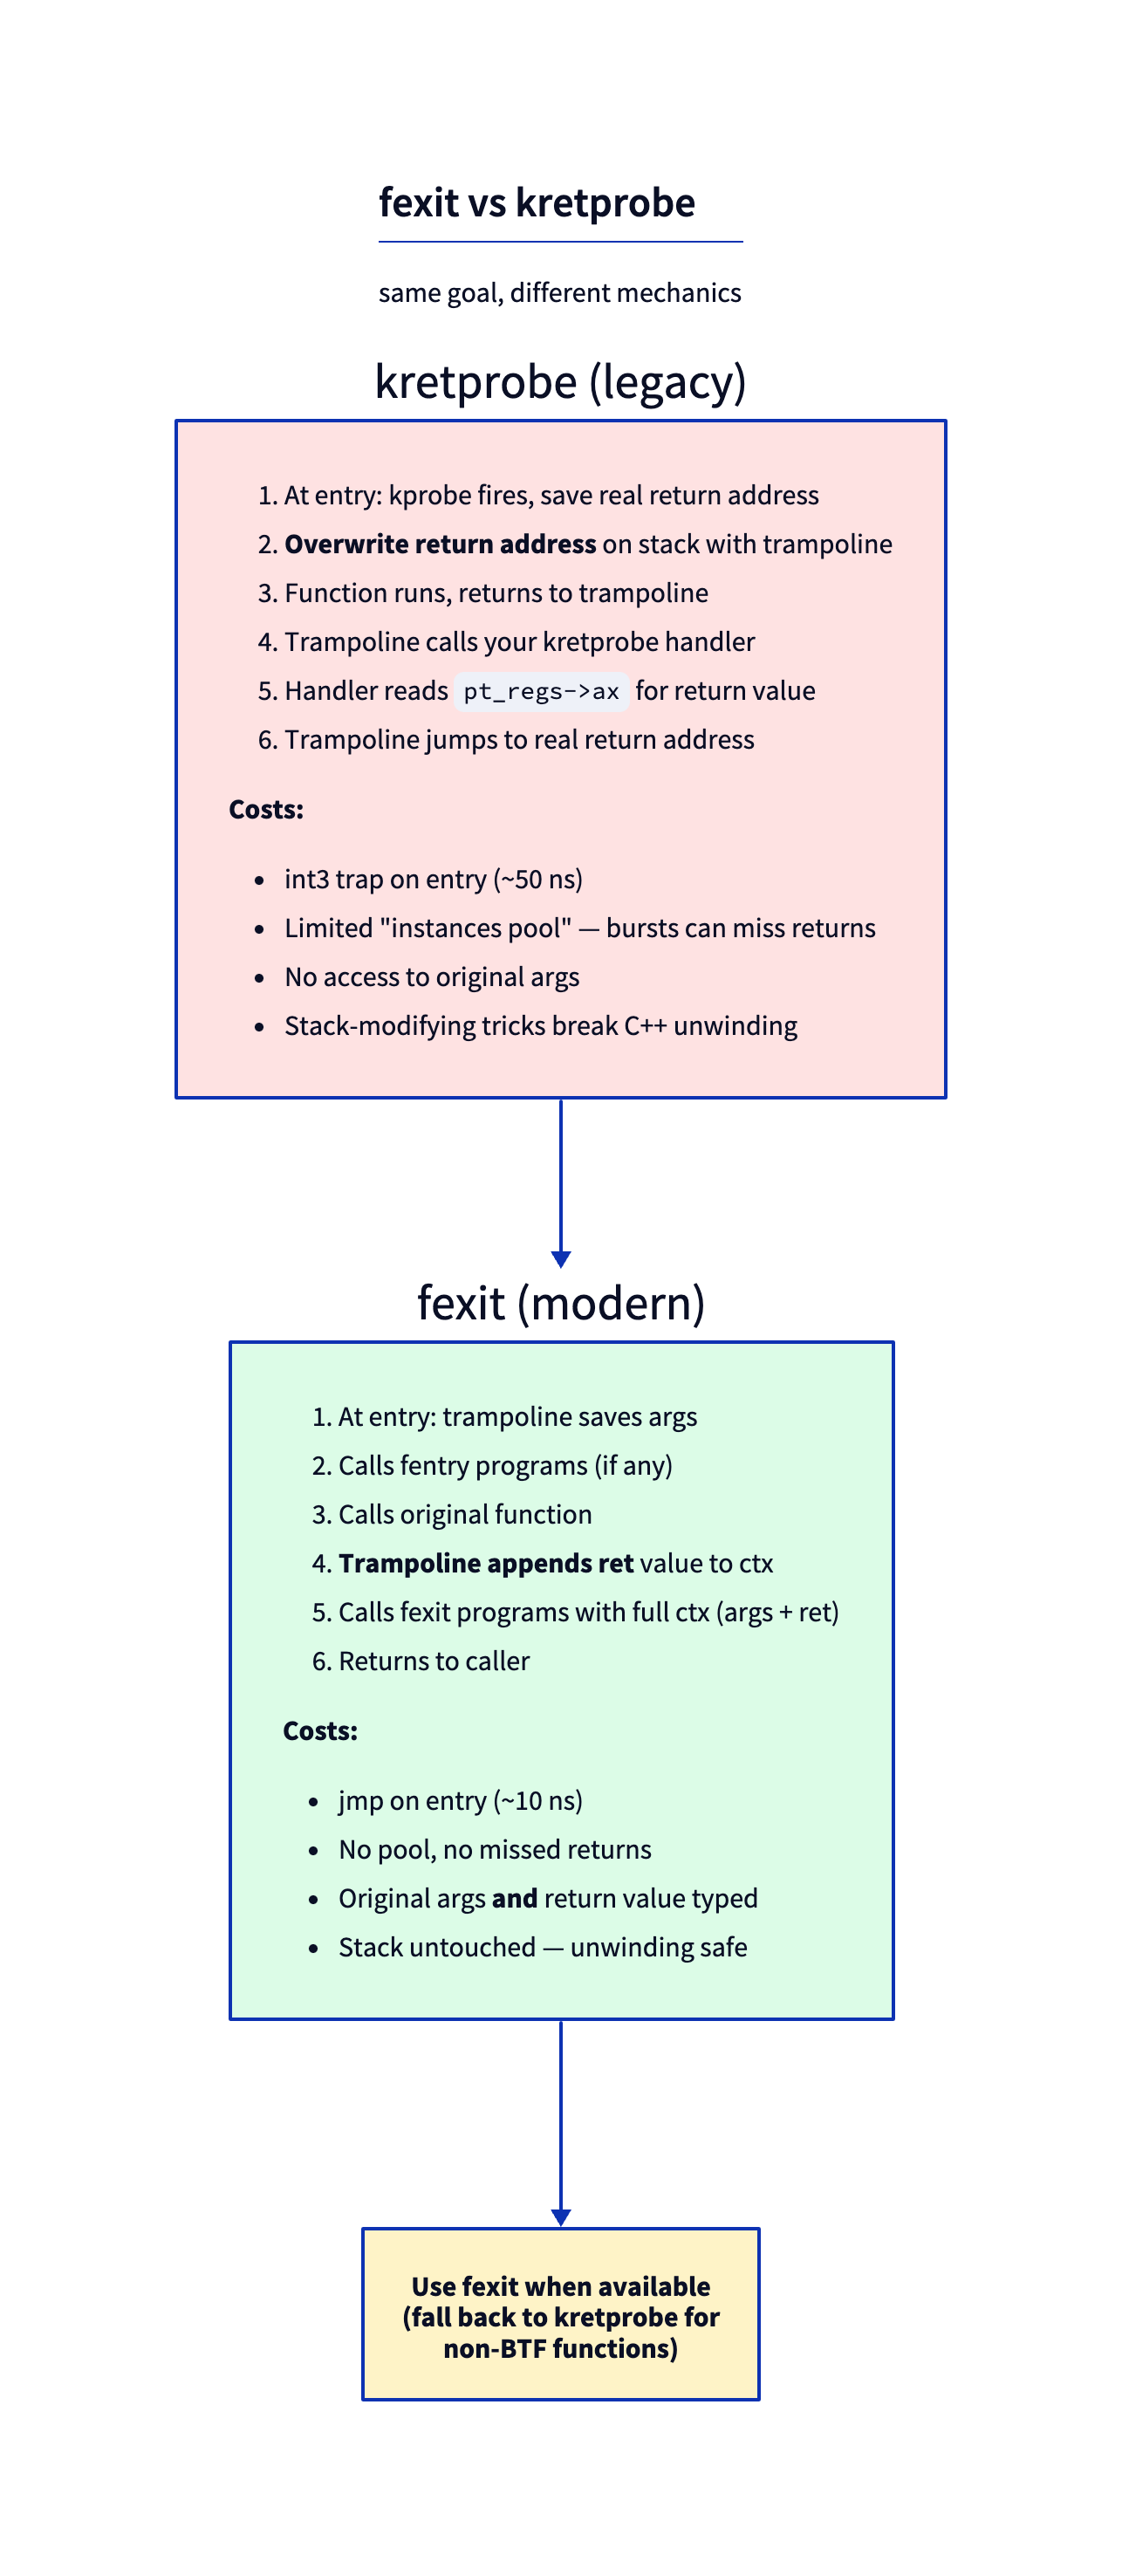
Compare the two mechanisms point for point:
- kretprobe rewrites the saved return address, needs a finite per-probe instance pool, drops returns (
nmissed++) on bursts, and confuses stack unwinders. Effective, but invasive. - fexit never touches the return address. The original function returns normally to its real caller; the trampoline captured the return value alongside, so there’s no stack rewrite, no finite pool, and no missed-on-burst failure mode.
That’s the whole argument: prefer fexit wherever it’s available — any function with BTF info (essentially every non-__attribute__((always_inline)) kernel function on a modern build). Use kretprobe only when fexit isn’t available.
There are no Dumb Questions
Q: Are fentry and fexit two separate hooks, or one?
A: One hook with two callbacks, conceptually. The kernel builds a single trampoline per attach target that invokes all attached fentry programs and all attached fexit programs in sequence. You can attach an fentry without an fexit, or vice versa. They share the trampoline infrastructure (
kernel/bpf/trampoline.c) but are independent BPF programs from your perspective.Q: What if the function never returns (panic, BUG_ON)?
A: Then fexit doesn’t run. Your map entry stays in the hash table indefinitely. We’ll see this exact failure mode in today’s “what to break” — it’s the source of slow leaks in tracers that run for weeks.
Q: Can a function be called recursively?
A: Yes, and it’s the case where TID-as-key breaks down. Today’s check question at the end walks through exactly why. For most kernel functions you trace, recursion isn’t an issue.
Meet bpf_ktime_get_ns
__u64 ts = bpf_ktime_get_ns();
Returns nanoseconds on the monotonic clock (CLOCK_MONOTONIC): time advances steadily and never goes backward, but it excludes any interval the machine spent suspended, so it isn’t literally “elapsed since boot.” That’s exactly what you want for measuring a latency delta — both reads use the same clock and the difference is meaningful. Cheap — implemented as ktime_get_mono_fast_ns under the hood, no locking, single read of a kernel timekeeping cache. ~10ns to invoke. It is not calendar/wall-clock time and you can’t correlate it with userspace clock_gettime(CLOCK_REALTIME) timestamps. If you need elapsed real time that also counts suspend, use bpf_ktime_get_boot_ns (CLOCK_BOOTTIME — still a monotonic count from boot, just inclusive of suspend, not wall-clock). The closest thing to wall-clock here is bpf_ktime_get_tai_ns (CLOCK_TAI, which tracks UTC up to a fixed leap-second offset).
TID vs TGID — pick the right key
This is the bug that bites everyone the first time they write a per-thread tracer. Read this carefully before writing code today.
bpf_get_current_pid_tgid() returns a packed u64:
+------------------+------------------+
| TGID (upper 32)  | TID (lower 32)   |
+------------------+------------------+
Linux kernel terminology and userspace terminology don’t match:
- What userspace calls “PID” is the kernel’s TGID (thread group ID — the leader thread’s TID).
- What the kernel calls TID is the per-thread identifier.
A multi-threaded process has many TIDs sharing one TGID. Inside bpf_get_current_pid_tgid:
__u32 tgid = bpf_get_current_pid_tgid() >> 32;       // userspace "PID"
__u32 tid  = bpf_get_current_pid_tgid() & 0xffffffff; // unique per thread
For tracking concurrent in-flight calls, you need per-thread granularity:
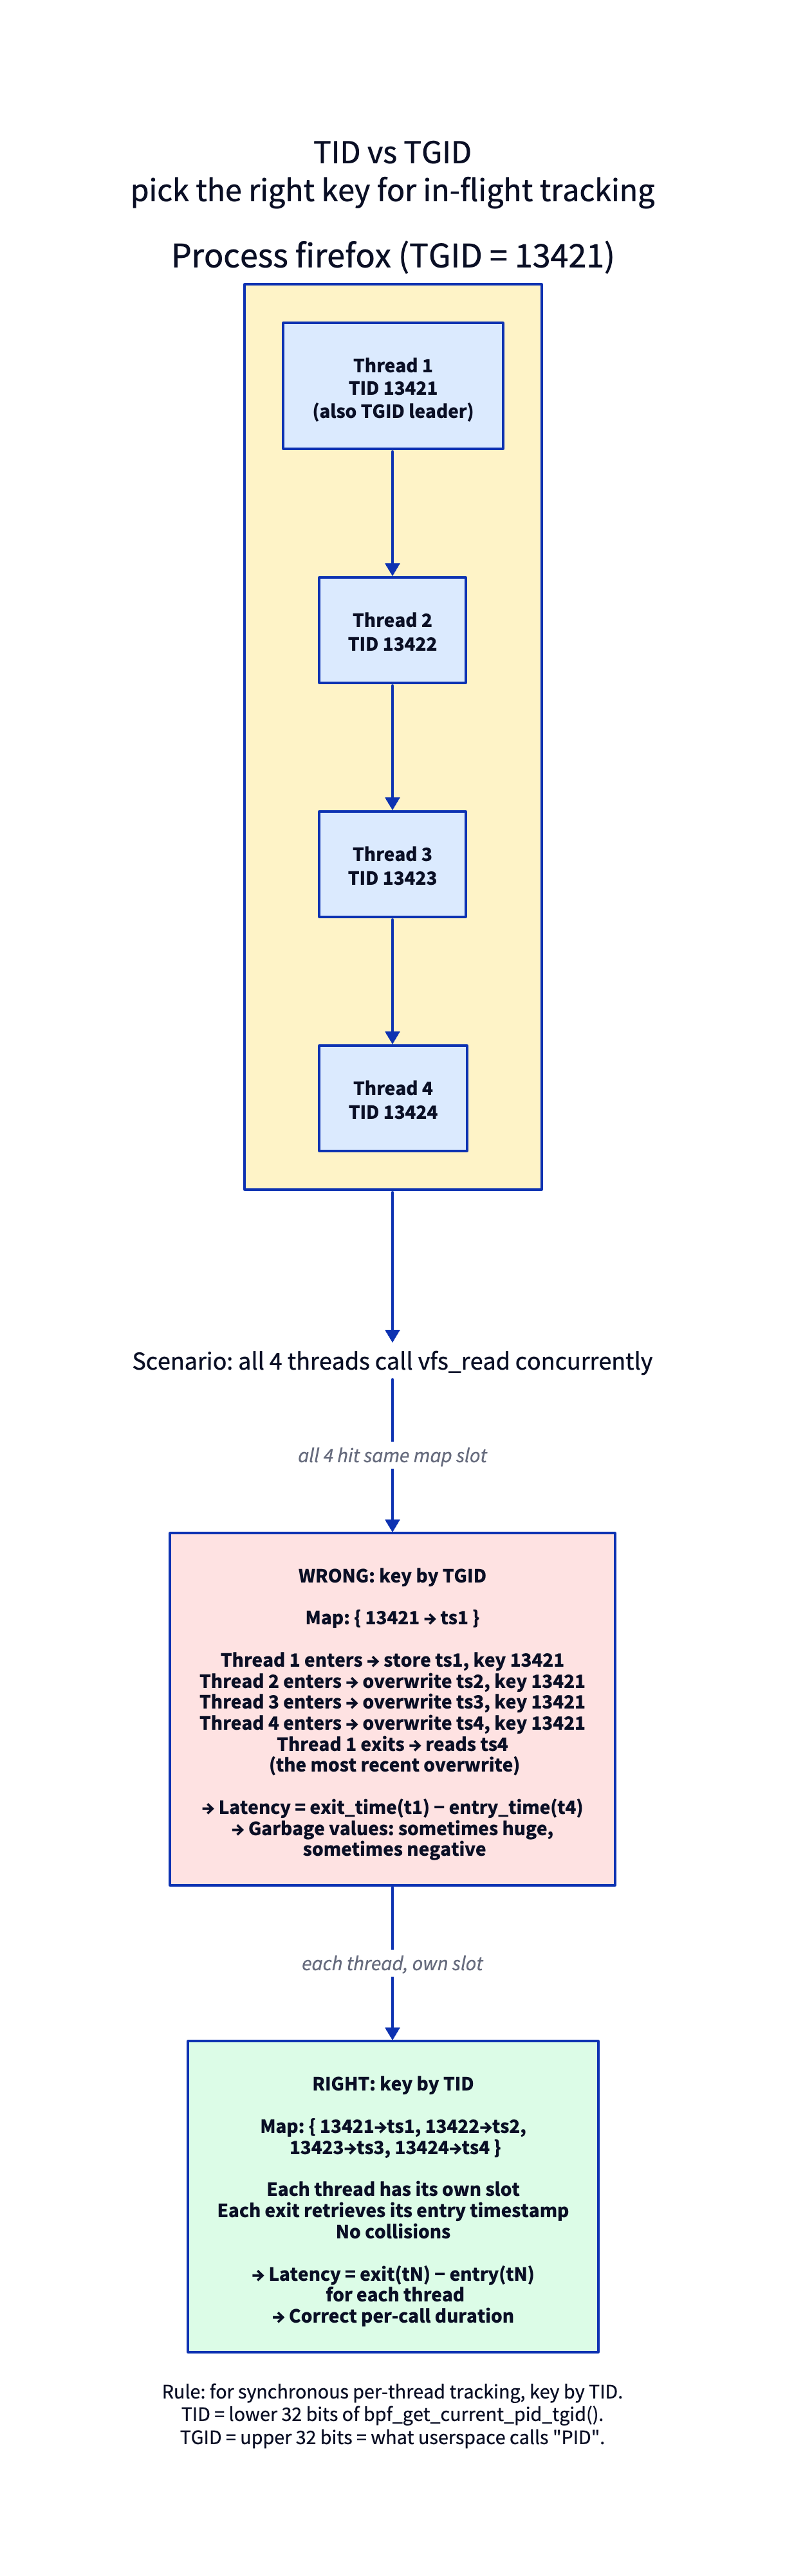
If you key by TGID, four threads of the same process all hit the same map slot, overwriting each other’s timestamps. The latency reading is garbage. Use TID.
Sharpen your pencil
Why doesn’t the kernel just give you a single “thread identifier” without ambiguity? Why does
bpf_get_current_pid_tgidpack two fields into one return value?.
.
.Answer: because one helper call is cheaper than two. The kernel only ever exposed the combined helper
bpf_get_current_pid_tgid(helper id 14) — there was never a separatebpf_get_current_pidorbpf_get_current_tgidin the UAPI. The single call returns both fields packed together, mirroring whattask_structitself carries: bothpid(kernel meaning) andtgid. The body is literallyreturn (u64) task->tgid << 32 | task->pid;(kernel/bpf/helpers.c:225-233). The naming confusion is historical — userspace called processes “PIDs” before threads existed.
The lifecycle, explicitly
Walk through what the map looks like over time when two threads concurrently read:
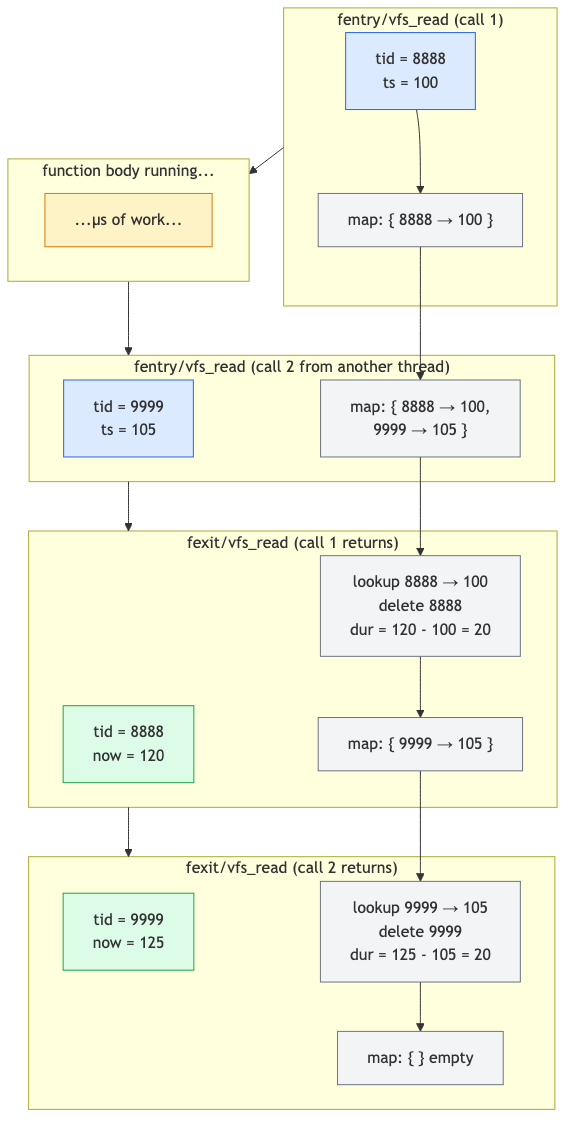
Each thread enters → its TID gets a slot. Each thread exits → its TID’s slot is read and deleted. The map is empty when nothing is in flight. The delete is critical — without it, the map fills as threads come and go.
The lab
latency.h — the shared event record
The producer and consumer share one struct through a header, exactly as Days 1 and 3 did:
#ifndef PRACTICAL_EBPF_LATENCY_H
#define PRACTICAL_EBPF_LATENCY_H

struct event {
    unsigned int pid;
    unsigned int tid;
    unsigned long long dur_ns;
    long long ret;
    char comm[16];
};

#endif
latency.bpf.c
#include "vmlinux.h"
#include <bpf/bpf_helpers.h>
#include <bpf/bpf_tracing.h>

#include "latency.h"

char LICENSE[] SEC("license") = "GPL";

struct {
    __uint(type, BPF_MAP_TYPE_HASH);
    __uint(max_entries, 10240);
    __type(key, __u64);    /* tid */
    __type(value, __u64);  /* ns timestamp */
} starts SEC(".maps");

struct {
    __uint(type, BPF_MAP_TYPE_RINGBUF);
    __uint(max_entries, 256 * 1024);
} rb SEC(".maps");

SEC("fentry/vfs_read")
int BPF_PROG(on_enter, struct file *f, char *buf, size_t n, loff_t *pos)
{
    __u64 tid = bpf_get_current_pid_tgid() & 0xffffffff;
    __u64 ts = bpf_ktime_get_ns();
    bpf_map_update_elem(&starts, &tid, &ts, BPF_ANY);
    return 0;
}

SEC("fexit/vfs_read")
int BPF_PROG(on_exit, struct file *f, char *buf, size_t n, loff_t *pos, ssize_t ret)
{
    __u64 id = bpf_get_current_pid_tgid();
    __u64 tid = id & 0xffffffff;
    __u64 *ts = bpf_map_lookup_elem(&starts, &tid);
    if (!ts)
        return 0;
    __u64 dur = bpf_ktime_get_ns() - *ts;
    bpf_map_delete_elem(&starts, &tid);

    struct event *e = bpf_ringbuf_reserve(&rb, sizeof(*e), 0);
    if (!e) return 0;
    e->pid = id >> 32;
    e->tid = tid;
    e->dur_ns = dur;
    e->ret = ret;
    bpf_get_current_comm(&e->comm, sizeof(e->comm));
    bpf_ringbuf_submit(e, 0);
    return 0;
}
The fentry signature (struct file *f, char *buf, size_t n, loff_t *pos) is exactly the four vfs_read arguments we read off fs/read_write.c:554 above. The fexit signature is those same four args plus the captured ssize_t ret — the byte-count-or-negative-errno we discussed, which is what e->ret carries to userspace.
What’s new since Day 1–5
- Two programs in one object, sharing maps. The skeleton exposes both as
skel->progs.on_enterandskel->progs.on_exit. Both auto-attach when you calllatency_bpf__attach(skel). BPF_PROG(on_exit, ..., loff_t *pos, ssize_t ret)— fexit receives all function arguments first, then the return value as the last parameter. TheBPF_PROGmacro knows fexit programs receive one extra ctx slot. We meetBPF_PROG’s mechanics in detail on Day 7.bpf_map_update_elem(..., BPF_ANY)— insert-or-update. Note we useBPF_ANYhere, notBPF_NOEXIST, because we don’t care if the same TID had a stale entry from a missedfexit(e.g., the previous call panicked). Overwriting is correct.bpf_map_lookup_elemreturns a pointer into live map memory. You can read it directly. The Verifier requires the null check.bpf_map_delete_elem— do not skip this. It’s the line that prevents the map from filling forever.
latency.c
Standard ringbuf consumer. Print:
printf("PID %u TID %u vfs_read → %lld bytes in %llu µs (%s)\n",
       e->pid, e->tid, (long long)e->ret,
       e->dur_ns / 1000, e->comm);
(We don’t capture the request size in this minimal version. Add it as an exercise.)
Run it
Use two terminals so the tracer and the workload don’t fight over one shell.
Terminal A — build and run the tracer in the foreground, and wait until it has attached before generating work (a vfs_read issued before latency_bpf__attach() returns is silently missed):
make
sudo ./latency
Terminal B — once the tracer is live, generate some reads:
cat /etc/passwd > /dev/null
dd if=/dev/zero of=/dev/null bs=1k count=100
Expected (in Terminal A):
PID 14001 TID 14001 vfs_read → 2543 bytes in 12 µs (cat)
PID 14002 TID 14002 vfs_read → 1024 bytes in 8 µs (dd)
PID 14002 TID 14002 vfs_read → 1024 bytes in 6 µs (dd)
...
The → N bytes column is vfs_read’s return value: 2543 bytes read by cat, 1024 per dd block. A negative value there would be an errno (e.g. -9 for -EBADF) — that’s the contract we read off fs/read_write.c:558-573.
This traces every vfs_read on the box, not just cat/dd — sshd, systemd, journald, and the shell itself all read constantly, so those two lines are buried in a flood of unrelated events. To isolate them, pipe Terminal A through grep -E 'cat|dd' (or filter by comm in the consumer). Stop the tracer with Ctrl-C in Terminal A when done. (If you prefer to background it with sudo ./latency &, remember to sleep 1 before generating work so attach completes, and sudo pkill latency to stop it.)
You just measured every kernel-side vfs_read on your system in real time, with typed argument access and a few hundred nanoseconds of overhead per call. This is what eBPF is for.
What to break, in order
Break 1 — Forget the bpf_map_delete_elem
You saw a preview of this back in Day 2 (Break 4, flagged as a Day 9 teaser); here it’s the actual failure mode of today’s tracer, so it earns a full walk-through. Day 2 used the quick-and-dirty wc -l counter — below we teach the dependable -j | jq length form instead, which is the count you should trust.
Comment it out, then make and relaunch a fresh tracer (sudo pkill latency; make && sudo ./latency &) — the starts map only exists while the loaded program is running, so bpftool map ... name starts finds nothing if the tracer isn’t up. Drive load from another terminal with find /usr -type f -exec cat {} + >/dev/null, then periodically read the live entry count. The reliable, version-independent way is the JSON dump piped to jq length:
sudo bpftool map dump -j name starts | jq length
21
(Plain bpftool map dump name starts prints the entries themselves — on the v7.x bpftool here as key: … value: … lines with a trailing Found N elements footer; only the -j flag emits a JSON array. The format varies across builds, which is exactly why the -j | jq length form above is the dependable counter. Don’t use bpftool map show name starts for this — it reports only the static max_entries 10240 ceiling and key/value sizes, never the live count. And don’t pipe map dump through wc -l: it counts formatting/footer lines, not elements.)
Watch N climb. Slowly at first, then steady. As it plateaus toward max_entries=10240, bpf_map_update_elem silently fails on every new TID. Your tracer’s coverage degrades to “only TIDs that were already in flight when the map filled.”
This is the slow-poison failure mode. Always delete on exit.
Break 2 — Use TGID instead of TID
In both programs, key the map on the TGID — bpf_get_current_pid_tgid() >> 32 — instead of the TID. (Note the entry program computes tid directly and has no id variable, so you’re changing the masked expression in each, not reusing an id.) The collision only shows up when several threads of one process (one shared TGID, many TIDs) read concurrently — separate processes each have a distinct TGID, so they never clash. Drive that with a single multi-threaded reader:
python3 - <<'EOF'
import threading, time
def r():
    while True:
        with open('/etc/passwd') as f:
            f.read()
for _ in range(8):
    threading.Thread(target=r, daemon=True).start()
time.sleep(10)
EOF
All 8 threads share one TGID and all call vfs_read, so a TGID-keyed map collides on every concurrent read: when thread B’s fentry overwrites thread A’s start timestamp with B’s own (later) timestamp, A’s fexit then reads B’s timestamp and computes a bogus delta. Watch your output. Two symptoms dominate. First, understated durations: bpf_ktime_get_ns is monotonic, so the timestamp sitting in the slot is essentially always earlier than the now a later fexit reads — the subtraction stays positive but tiny (now - ts_B instead of the true now - ts_A), so latencies come out implausibly low. Second, the event count drops: whichever thread’s fexit runs first deletes the shared slot, so the other thread’s fexit finds no entry (bpf_map_lookup_elem returns NULL) and silently bails. (A giant ~10^18 “underflowed” duration is not the expected symptom with a monotonic clock — that would require the stored timestamp to be greater than now, which only happens in a narrow race where another CPU’s fentry rewrites the slot value between this fexit’s clock read and its dereference; it’s a rare artifact, not the headline.) Contrast with TID keying: one entry per thread, so deltas stay correct and no events are lost.
Lesson stays: TID for synchronous per-thread tracking.
Break 3 — Drop the null check in fexit
__u64 *ts = bpf_map_lookup_elem(&starts, &tid);
__u64 dur = bpf_ktime_get_ns() - *ts;   // no null check
Verifier rejects with the same R0 type=map_value_or_null error from Day 4. Re-read the log; the rejection should now feel completely unsurprising.
Break 4 — Convert to kretprobe
Change SEC("fexit/vfs_read") to SEC("kretprobe/vfs_read"). Rebuild. Things break:
BPF_PROGmacro doesn’t know about kretprobe — useBPF_KRETPROBEinstead.- The argument list is wrong. kretprobe’s ctx is
struct pt_regs *, not the typed args + return. You can only get the return value viaPT_REGS_RC(ctx). - You can’t access
f,buf,n, orpos— they were the entry arguments and are gone by now.
This is the operational reason fexit is strictly better. With fexit you have entry args + return value; with kretprobe you have only return value (PT_REGS_RC reads it out of the trampoline’s saved registers) — and, as the mechanism section showed, you also inherit the instance pool, the nmissed burst drops, and the unwinder confusion.
The full equivalent kretprobe version:
SEC("kretprobe/vfs_read")
int BPF_KRETPROBE(on_exit_kretprobe, ssize_t ret)
{
    /* same body, but only `ret` is available */
}
Break 5 — A function that doesn’t always return
Try kernel_clone (the function that implements fork). Most calls return; a few may not (do_exit paths, exotic flags). Run for a long time. Check that the map stays bounded — kernel_clone is well-behaved here. Now try to attach fexit to do_exit itself:
SEC("fentry/do_exit")
int BPF_PROG(on_exit_enter) {
    /* ... store ... */
}

SEC("fexit/do_exit")
int BPF_PROG(on_exit_exit) {
    /* do_exit never returns */
}
On 7.1 this doesn’t even load. The Verifier knows do_exit is marked __noreturn, and it refuses to attach fexit to a function that can never return:
Attaching fexit/fsession/fmod_ret to __noreturn function 'do_exit' is rejected.
The kernel keeps a noreturn_deny BTF set (kernel/bpf/verifier.c) — do_exit, do_group_exit, make_task_dead, __module_put_and_kthread_exit, and friends — and rejects fexit/fmod_ret on any of them at load time. So the leak you might expect here never happens: the Verifier protects you up front.
The leak lesson still stands, though — it just applies to functions the denylist can’t catch. A function that returns on most paths but conditionally doesn’t (a goto into a do_exit call, an unwound error path that calls panic) isn’t __noreturn, so fexit attaches happily — and then silently never fires on the non-returning path, leaking that thread’s map entry. Not every function has a sensible fexit pair. For those, you need a different cleanup strategy (a periodic sweep from userspace, or a tracepoint at task termination such as sched_process_exit).
What to read in the kernel
kernel/bpf/trampoline.c— open it. Searcharch_prepare_bpf_trampoline. The trampoline is generated assembly that saves arguments, calls fentry programs, calls the original function, captures the return value into the ctx array, and calls fexit programs. The ASM is per-arch (x86_64, arm64, etc.) but the structure is consistent.tools/lib/bpf/bpf_tracing.h— searchBPF_PROG. The macro is ~30 lines of variadic-template-style C macros. Read it once. You’ll see how theu64 *ctxarray gets unpacked into typed parameters via((__u64 *)ctx)[N]casts. After this, the macro stops feeling magic.kernel/trace/bpf_trace.c— searchbpf_get_func_argandbpf_get_func_ret(bpf_get_func_ret_protois atbpf_trace.c:1223). These are helper-based access patterns for the same data, used whenBPF_PROG’s positional args don’t fit (e.g., variadic kernel functions).arch/x86/kernel/rethook.c— the hand-writtenarch_rethook_trampoline(:26) whose address a kretprobe swaps onto the stack. Read it once after today and the return-address trick stops being abstract.Documentation/bpf/libbpf/program_types.rst— the official doc listing tracing program types (fentry,fexit,fsession). One read, optional.
Bullet Points
vfs_readis the kernel’s central read chokepoint (fs/read_write.c:554); itsssize_treturn is bytes-read on success or a negative errno on failure — that’s the “→ N bytes” you print.fexitattaches at function return; receives original arguments and the return value as typed parameters.- A kretprobe hooks the return by swapping the saved return address on the stack for a trampoline at entry, using a finite instance pool (
maxactive); bursts beyond the pool are dropped and counted innmissed, and the swap confuses stack unwinders. - Use fexit > kretprobe wherever fexit is available (any function with BTF): same trampoline as fentry, no return-address rewrite, no pool, no missed-on-burst. kretprobe is legacy.
bpf_ktime_get_ns()returnsCLOCK_MONOTONICnanoseconds (excludes suspend, not wall-clock); cheap, ~10ns to call. Perfect for a latency delta, useless for calendar time.- Key per-thread tracers by TID, not TGID. Multi-threaded processes will collide on TGID-keyed maps.
- The latency pattern:
fentrystores entry timestamp keyed by TID;fexitretrieves it, computes duration, deletes the entry, emits the event. - Don’t forget
bpf_map_delete_elem. Tracers that don’t clean up degrade silently as their map fills. - Some kernel functions don’t return (e.g.,
do_exit); fexit-based tracking can’t handle them. The Verifier even rejects fexit on__noreturnfunctions up front. Use a different mechanism (tracepoints, periodic sweeps). BPF_PROGmacro unpacks typed arguments from the trampoline’su64 *ctxarray — same macro for fentry and fexit; fexit just has one extra arg (the return value) at the end.
Check question
You attach an fentry+fexit pair to a function that, on some paths, calls itself recursively. The latency map is keyed by TID. Does the measurement still work?
Click to reveal answer
Answer: No. On the recursive call, the second fentry overwrites the first’s timestamp (same TID). When the inner call’s fexit runs, it reads its own timestamp and deletes the entry. The outer fexit then can’t find any entry — bpf_map_lookup_elem returns NULL, the duration computation is skipped, and the event is silently dropped. To handle this, you need a recursion-aware key like (tid, depth) where depth is tracked in a percpu map, or you switch to bpf_get_func_ip(ctx) plus stack-allocated counters. Most kernel functions don’t recurse meaningfully, so this rarely matters in practice — but when it does, you’ve found a real subtlety.
Tomorrow
Day 7: the BPF_PROG macro demystified. The ctx array, PT_REGS_* for kprobes, function argument access patterns, and the helper-vs-kfunc distinction. Less hands-on building, more “now you understand what the macros are doing.”