Day 7 — BPF_PROG demystified, ctx layouts, helpers vs kfuncs
Today’s mission: stop thinking of
BPF_PROG/BPF_KPROBE/BPF_KRETPROBEas magic. See what they expand to. Understand why each program type hands you arguments in a different shape — a typed trampoline array, a saved-register snapshot, or a copied event struct — and why the Verifier trusts some of those shapes and not others. Total time: ~120 minutes. Light on coding, heavy on understanding.
Why this day exists
Yesterday you wrote BPF_PROG(on_exit, struct file *f, char *buf, size_t n, loff_t *pos, ssize_t ret) and it just worked. Today we open the hood.
This matters because:
- When you start using non-trivial program types (kprobe, raw tracepoint, sk_msg, sock_ops), the macro and ctx access differ.
- When the macro doesn’t fit your case (variadic functions, exotic signatures), you need to access ctx by hand.
- When the Verifier complains about a register’s type, knowing where that type came from in the proto is the difference between minutes and hours of debugging.
There are three pieces of background you’ve never been shown that every example today leans on:
struct pt_regs— the saved-register snapshot a kprobe hands you, and why offset 0 of it is not the first argument.bpf_printkandtrace_pipe— the debug-output channel today’s lab reads. Days 1–6 sent data out through ringbuf and maps; today is the first time you’ll print straight to the kernel’s shared trace buffer.- What a tracepoint actually is — the
TRACE_EVENTmacro, the generatedtrace_event_raw_*struct, theformatfile, and the raw-args array. Three of today’s five program flavors hang on this.
We’ll teach each as we hit the part that depends on it.
What BPF_PROG actually does
The trampoline calls your BPF program with a single argument — unsigned long long *ctx — pointing at an array of u64 values, one per kernel-function argument (plus, for fexit, the return value at the end).
You don’t want to write (struct file *)ctx[0] everywhere. So BPF_PROG exists.
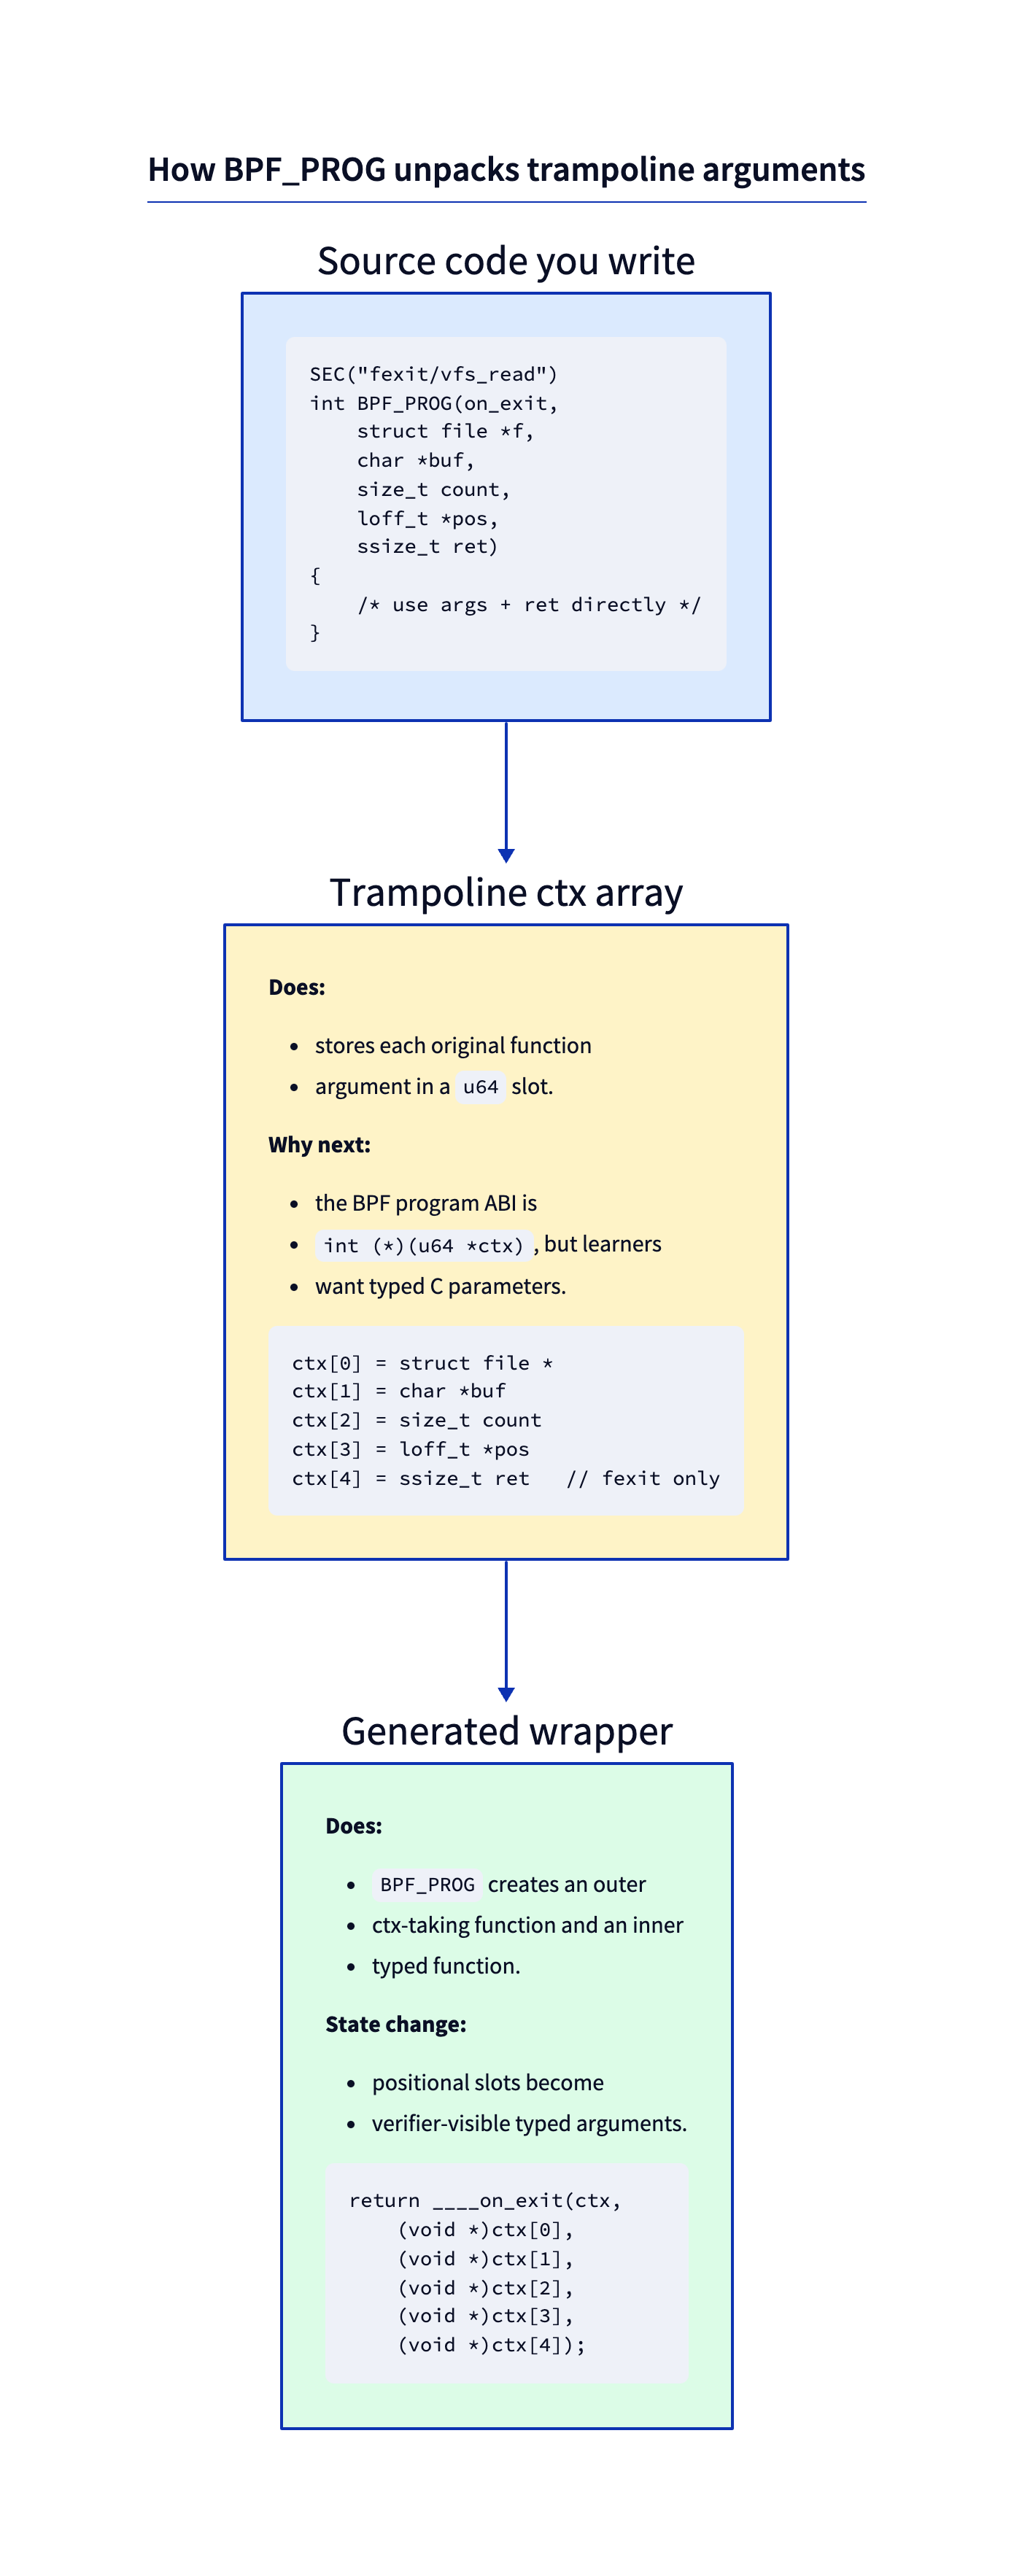
The macro is variadic-template-style C — it generates an outer function that the BPF program calls (taking only ctx), and an inner __always_inline function that takes your typed parameters. The outer function casts each ctx[N] slot to the right type and forwards into the inner.
You can read the actual macro at tools/lib/bpf/bpf_tracing.h:672 (the #define BPF_PROG(name, args...) line). It’s about 30 lines of variadic macros. Worth opening once. After you do, there’s no more magic — BPF_PROG is a code generator that saves you from writing position-based casts. The line that does the real work is its forwarding through ___bpf_ctx_cast, which expands to ctx[0], ctx[1], ctx[2]… — literal indices into that u64 array.
There are no Dumb Questions
Q: How does the macro know how many arguments my function has?
A: C variadic macros (
__VA_ARGS__) plus a counting trick (___bpf_narg) that uses preprocessor recursion to figure out the arity.bpf_tracing.hthen dispatches through___bpf_ctx_castto the right___bpf_ctx_cast0..___bpf_ctx_cast12slot-caster (supporting up to 12 args). The actual implementation is gnarly C macro magic but the concept is simple.Q: What if my function has more than 12 arguments?
A: You’re using the wrong tool. Most kernel functions have ≤ 6 args (matching the System V calling convention). For variadic kernel functions, use
bpf_get_func_arg(ctx, N, &out)— a helper that reads the Nth argument by index and writes it toout(BPF_FUNC_get_func_arg= 183,include/uapi/linux/bpf.h:6088; implemented atkernel/trace/bpf_trace.c:1194). We won’t use it today.Q: Why does
BPF_PROG’s syntax look weird? Why isn’t it just a normal function?A: Because the BPF program’s real signature must be
int (*)(unsigned long long *)— that’s what the trampoline calls. Without the macro, you’d write that signature and unpackctx[]manually. The macro pretends you wrote a normal C function but generates the unpacking glue.
Two shapes of ctx: the trampoline array vs. the register snapshot
Before the five-flavor chart, you need to see clearly that the word “ctx” means two physically different things depending on program type. Get this and half of today’s surprises evaporate.
Shape A — the trampoline u64 ctx[] (fentry/fexit/tp_btf). This is the array you met on Day 1: the trampoline saves the traced function’s arguments into a small u64[] and hands you a pointer to it. ctx[0] is the first typed argument, ctx[1] the second, and so on. BPF_PROG indexes straight into it (___bpf_ctx_cast → ctx[0], ctx[1]…), which is why BPF_PROG’s forwarding lives at bpf_tracing.h:672.
Shape B — the struct pt_regs * snapshot (kprobe/kretprobe). A kprobe doesn’t get a tidy array. Recall from Day 1: a kprobe fires via the int3 trap — the kernel overwrites the first byte of the traced instruction with a breakpoint, and when the CPU hits it the trap handler runs. At that moment the handler captures every general-purpose register into a struct pt_regs and hands your program a pointer to that. So a kprobe’s ctx is a frozen photograph of the CPU registers, not a per-argument array.
That difference is the whole reason BPF_KPROBE is a separate macro from BPF_PROG. BPF_KPROBE (tools/lib/bpf/bpf_tracing.h:816) declares ctx as struct pt_regs * and, instead of indexing an array, forwards each argument through PT_REGS_PARM1, PT_REGS_PARM2, … — macros that read a named register slot out of the snapshot.
Why offset 0 of pt_regs is the saved r15, not your first argument
Here is the layout that makes every “+112”, “+0x70”, “+0x60” you’ll see today legible. The x86-64 struct pt_regs is at arch/x86/include/asm/ptrace.h:103, and its fields are laid out in this exact order:
/* arch/x86/include/asm/ptrace.h:103 — x86-64 struct pt_regs */
unsigned long r15;   /* offset 0x00  ← FIRST member */
unsigned long r14;   /* 0x08 */
unsigned long r13;   /* 0x10 */
unsigned long r12;   /* 0x18 */
unsigned long bp;    /* 0x20 */
unsigned long bx;    /* 0x28 */
unsigned long r11;   /* 0x30 */
unsigned long r10;   /* 0x38 */
unsigned long r9;    /* 0x40 */
unsigned long r8;    /* 0x48 */
unsigned long ax;    /* 0x50 */
unsigned long cx;    /* 0x58 */
unsigned long dx;    /* 0x60  ← arg3 */
unsigned long si;    /* 0x68  ← arg2 */
unsigned long di;    /* 0x70  ← arg1 */
/* ... orig_ax, ip, cs, flags, sp, ss ... */
Two facts fall straight out of this picture:
- Byte offset 0 is
r15— a callee-saved register that has nothing to do with your function’s arguments. This is exactly why Break 2 below produces garbage: when you (wrongly) putBPF_PROGon a kprobe, the macro reads “ctx[0]” = the 8 bytes at offset 0 = the savedr15, casts it tostruct file *, and you’re off into the weeds. disits 15th in the struct → offset 14 × 8 = 112 =0x70. That’s the number you’ll see the kprobe program load from in both the verifier log (r1 +112) and the disassembly (r1 + 0x70).dxis 13th → offset 96 =0x60(arg3).
The layout is deliberately arch-specific. There’s a separate 32-bit struct pt_regs at arch/x86/include/asm/ptrace.h:12 that starts bx, cx, dx, si, di, … — a completely different order. The offsets only make sense once you’ve pinned down the architecture, which is why the build needs -D__TARGET_ARCH_x86 (more on that at the lab).
Mapping System V arguments onto register slots
Recall from Day 1: the System V x86-64 calling convention passes the first integer/pointer argument in rdi, the second in rsi, the third in rdx. The PT_REGS_PARM* macros are just that convention written down. In tools/lib/bpf/bpf_tracing.h:
/* tools/lib/bpf/bpf_tracing.h:87 */
#define __PT_PARM1_REG di
#define __PT_PARM2_REG si
#define __PT_PARM3_REG dx
...
/* tools/lib/bpf/bpf_tracing.h:492 */
#define PT_REGS_PARM1(x) (__PT_REGS_CAST(x)->__PT_PARM1_REG)
So PT_REGS_PARM1(ctx) reads ctx->di, PT_REGS_PARM2(ctx) reads ctx->si, PT_REGS_PARM3(ctx) reads ctx->dx. This is the bridge that makes the disassembly’s “+0x70 = di = PT_REGS_PARM1 = f” and “+0x60 = dx” lines readable: argument 1 of vfs_read is struct file *f, it was passed in rdi, the trap saved rdi at offset 0x70, and the kprobe program loads f from there.
Contrast the two shapes one more time: fentry hands you the trampoline’s u64 ctx[] where ctx[0] genuinely is the typed first argument; kprobe hands you pt_regs where you must dig the argument out of a named register slot. That is why BPF_PROG indexes ctx[] and BPF_KPROBE wraps PT_REGS_PARM*. Same data, two different containers.
![Side-by-side fentry trampoline ctx[] vs struct pt_regs register snapshot](diagrams/day07_ctx_vs_ptregs.png)
What a tracepoint actually is
Three of today’s five flavors (regular tracepoint, raw tracepoint, tp_btf) hook a tracepoint, and you’ve only ever seen the word in passing. Let’s make it concrete, because the structs those flavors declare come from a specific macro and live in a specific file.
A tracepoint is a named, static instrumentation site compiled into the kernel — sched_switch, sys_enter, kfree_skb, and hundreds more. Unlike fentry or kprobe, which hook an arbitrary function you name, a tracepoint is a deliberately placed, stable hook with a declared field schema. Kernel developers put it where it’s useful and promise to keep its fields meaningful across releases.
Every tracepoint is declared with the TRACE_EVENT() macro:
/* include/linux/tracepoint.h:671 */
#define TRACE_EVENT(name, proto, args, struct, assign, print) ...
That one macro generates a lot of code. The piece you care about today is a C struct describing the event’s copied payload:
/* include/trace/trace_events.h:62 — generated for every tracepoint */
struct trace_event_raw_##name {
    ...
};
So sched_switch gets a struct trace_event_raw_sched_switch, sys_enter gets a struct trace_event_raw_sys_enter, and so on. These structs are compiled into the kernel and end up in its BTF, which is why they appear in your vmlinux.h and why the flavor-3 program below can just declare struct trace_event_raw_sys_enter *ctx without defining it.
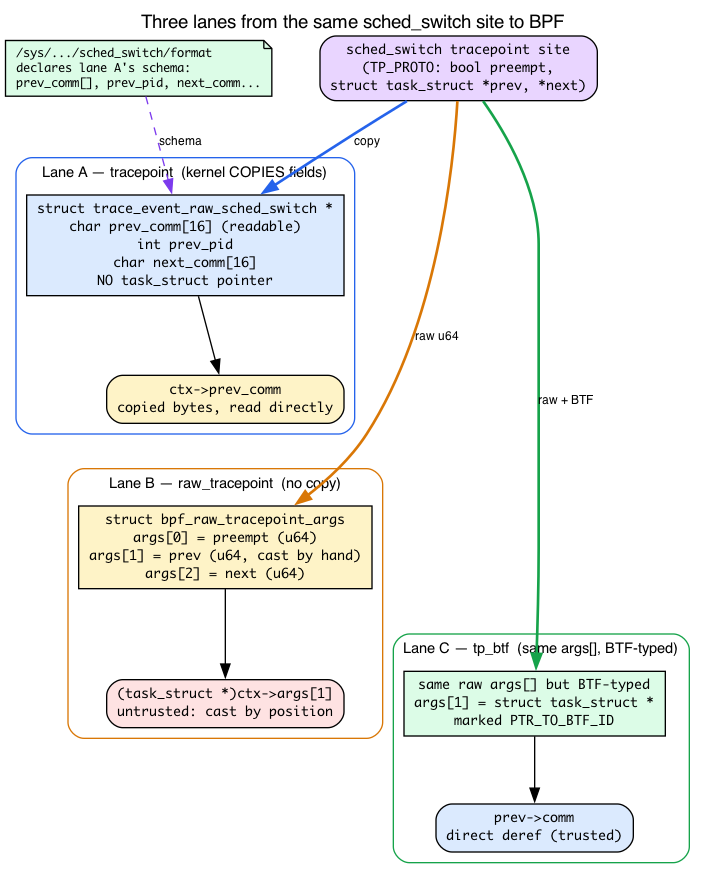
The crucial property: the kernel copies the chosen fields into that struct. When the tracepoint fires, it fills a trace_event_raw_* instance with the selected values and hands your program a pointer to those copied bytes — not to live kernel objects. That single fact explains Break 3 at the bottom: you can read ctx->prev_comm directly (it’s an embedded char array, copied in for you), but you cannot reach the parent task, because no pointer to it was ever copied.
The format file: a tracepoint’s public schema
Because a tracepoint has a declared schema, the kernel exposes it in human-readable form under tracefs:
sudo cat /sys/kernel/tracing/events/raw_syscalls/sys_enter/format
For sys_enter you’ll see fields including long id and unsigned long args[6]. (Note the path is raw_syscalls/, not syscalls/: the syscalls/ directory holds only the per-syscall nodes like sys_enter_read, whose format lists typed fields fd/buf/count. The generic id + args[6] schema that the flavor-3 program reads is the raw_syscalls:sys_enter tracepoint.) That’s not a coincidence — it comes straight from the declaration in include/trace/events/syscalls.h:18:
/* include/trace/events/syscalls.h:18 */
TRACE_EVENT_SYSCALL(sys_enter,
    TP_PROTO(struct pt_regs *regs, long id),
    ...
    TP_STRUCT__entry(
        __field( long,          id        )
        __array( unsigned long, args, 6   )
    ),
    ...
The __array(unsigned long, args, 6) is why the flavor-3 program reads ctx->args[0] to get the syscall’s first argument (the fd for read()): the kernel copied all six syscall arguments into that args[6] array for you. The format file is the contract; ctx->args[0] is you reading it.
Raw tracepoints: skip the copy, get positional u64s
A raw tracepoint (flavor 4) is the same instrumentation site without the copy step. Instead of a typed trace_event_raw_* struct, the kernel hands you:
/* include/uapi/linux/bpf.h:7286 */
struct bpf_raw_tracepoint_args {
    __u64 args[0];
};
That’s it — a bare array of __u64, one slot per TP_PROTO argument, unmodified. For sched_switch the TP_PROTO is (bool preempt, struct task_struct *prev, struct task_struct *next, …), so ctx->args[0] is the preempt bool, ctx->args[1] is a task_struct * you cast by hand, ctx->args[2] the next one. No fields are copied, no schema is applied; you unpack by position and you’re responsible for the casts.
tp_btf (flavor 5, detailed tomorrow) is the same raw argument array, but BTF-typed: the Verifier knows args[1] is a struct task_struct * and marks it PTR_TO_BTF_ID (recall from Day 1: a trusted, typed kernel pointer the Verifier will let you dereference), so you can dereference it directly. Raw args, but trusted.
Argument access by program type — five flavors
Different program types access arguments five different ways. This is the chart you’ll come back to whenever you’re confused about a “wrong type” verifier rejection — and now you have the background to read every row of it.
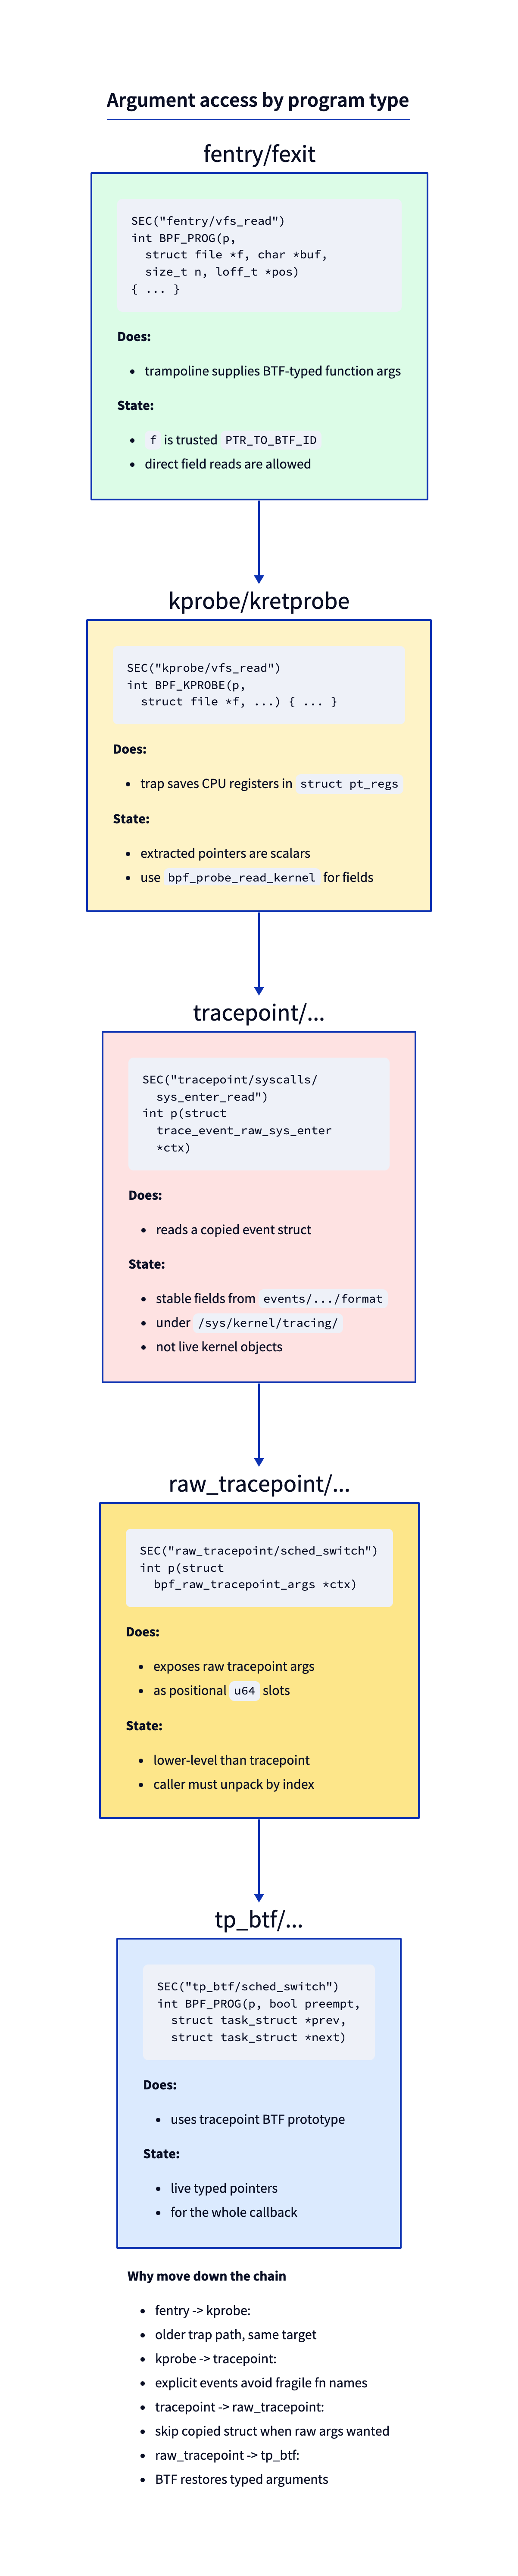
1. fentry/fexit — typed args from BTF
SEC("fentry/vfs_read")
int BPF_PROG(p, struct file *f, char *buf, size_t n, loff_t *pos) {
    loff_t cur = f->f_pos;   // direct deref allowed
}
The trampoline gives you a u64 *ctx. BPF_PROG casts each slot to your declared type. Because BTF has the original function’s signature, the cast is meaningful — f really is a struct file * pointing at a live kernel object. The Verifier marks f as PTR_TO_BTF_ID (typed kernel pointer), allowing direct dereference of fields.
Pros: typed, fast, direct deref. Cons: requires BTF (essentially always present in modern kernels).
2. kprobe/kretprobe — pt_regs from a trap
SEC("kprobe/vfs_read")
int BPF_KPROBE(p, struct file *f, char *buf, size_t n, loff_t *pos) {
    /* f is pt_regs->di on x86_64 */
}
BPF_KPROBE is a different macro that knows ctx is struct pt_regs * (a saved register snapshot from the entry trap). It expands to ((struct file *)PT_REGS_PARM1(ctx)) for the first argument, etc. The values are correct — they’re whatever was in RDI, RSI, etc. when the int3 fired — but the pointers are not marked as PTR_TO_BTF_ID because the Verifier can’t trust them in a kprobe context (the function’s BTF signature isn’t bound to the regs).
You access fields via bpf_probe_read_kernel:
loff_t pos;
bpf_probe_read_kernel(&pos, sizeof(pos), &f->f_pos);
This is why kprobes feel clunkier than fentry. Same data, more friction.
3. tracepoint/... — copied event context
SEC("tracepoint/syscalls/sys_enter_read")
int p(struct trace_event_raw_sys_enter *ctx) {
    int fd = (int)ctx->args[0];
}
The regular tracepoint program sees a stable kernel-defined event struct. The kernel copies the relevant fields into that per-tracepoint struct, and ctx points at the copied bytes. You don’t get live pointers. Useful when you want the stable event format in /sys/kernel/tracing/events/.../format.
4. raw_tracepoint/... — raw tracepoint argument array
SEC("raw_tracepoint/sched_switch")
int p(struct bpf_raw_tracepoint_args *ctx) {
    bool preempt = (bool)ctx->args[0];
    struct task_struct *prev = (void *)ctx->args[1];
    struct task_struct *next = (void *)ctx->args[2];
}
Raw tracepoints skip the copied event struct and expose the tracepoint arguments as raw u64 slots. You unpack by position. The verifier does not give you the same typed-argument ergonomics as tp_btf, so new code usually prefers tp_btf when BTF is available.
5. tp_btf — typed kernel pointers from a tracepoint
SEC("tp_btf/sched_switch")
int BPF_PROG(p, bool preempt, struct task_struct *prev, struct task_struct *next) {
    bpf_printk("%s -> %s", prev->comm, next->comm);  // direct deref
}
This is the modern typed interface to the same tracepoint event. The kernel hands you typed pointers (BTF-tagged) rather than copied bytes or raw positional slots. Direct deref works. Use tp_btf instead of raw tracepoint for new code when BTF is available — we’ll see this in detail tomorrow.
Sharpen your pencil
A function
int foo(struct file *f, void *data, size_t len)is in the kernel. You attach an fentry. You want to readf->f_inode->i_ino. Three ways to do it:
__u64 ino = f->f_inode->i_ino;__u64 ino = BPF_CORE_READ(f, f_inode, i_ino);(CO-RE, from Day 3 — walks the pointer chain with relocations, each hop viabpf_probe_read_kernel)__u64 ino; bpf_probe_read_kernel(&ino, sizeof(ino), &f->f_inode->i_ino);Which works? Which is preferred?
.
.
.Answers: All three load. (1) and (2) work cleanly because
fisPTR_TO_BTF_IDand the Verifier proves the chain. (1) is fastest: it’s a direct verified load — the Verifier permits the deref as a plain BPF load (LDX) and records it in the kernel exception table for fault handling, so there’s no helper call and nothing lowers tobpf_probe_read_kernel. (2) is safe-by-default (returns 0 on bad pointer) and is what (3) is the explicit form of —BPF_CORE_READlowers tobpf_probe_read_kernel. Prefer (1) for trusted chains, (2) for chains where any hop could be NULL. (3) is rarely written by hand anymore.
Helpers vs kfuncs — the two extension mechanisms
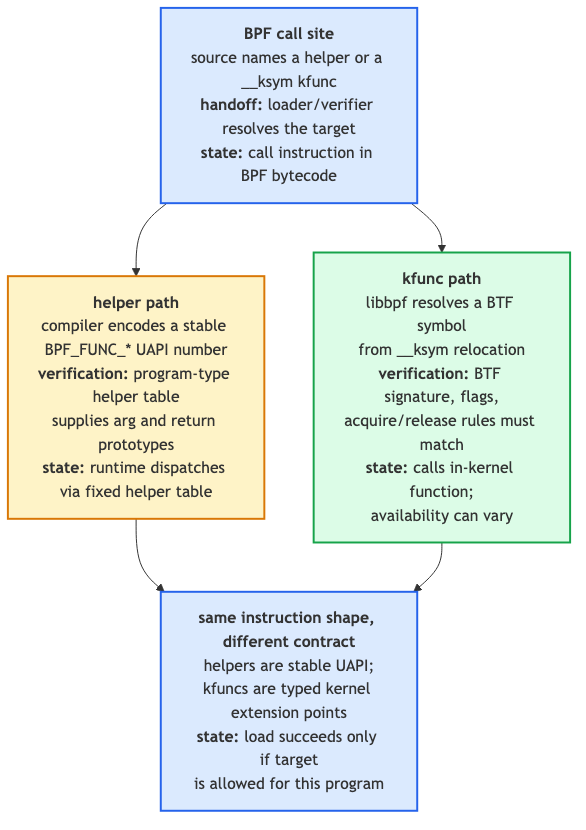
Yesterday you used bpf_get_current_pid_tgid, bpf_ktime_get_ns, bpf_map_lookup_elem. Those are helpers — a frozen UAPI list of functions BPF programs can call. You declared them via bpf_helpers.h, the linker resolves them to enum values (BPF_FUNC_get_current_pid_tgid = 14, etc.), and at load time the verifier/JIT resolves the call against a per-program-type proto table.
But there’s a second, newer mechanism: kfuncs. Functions declared in any kernel C file, registered via BTF_KFUNCS_START, that BPF programs can call by name (matched against kernel BTF at load time).
Why both exist:
- Helpers are frozen UAPI. Adding a helper is a forever commitment; removing or changing one breaks user programs. Process to add a helper is heavyweight.
- kfuncs are not UAPI. They can evolve, be added, removed, renamed. The maintainers can change a kfunc’s signature in the next release; user programs that use the old name fail to load on the new kernel. Lower commitment.
Around 2022, the kernel community decided to stop adding new helpers and add functionality as kfuncs instead. This is why your “use this BPF feature” docs from 2024+ talk about kfuncs more than helpers.
You’ll meet kfuncs properly on Day 20. For now, just know: when you see extern struct task_struct *bpf_task_acquire(struct task_struct *) __ksym;, that’s a kfunc. The __ksym attribute tells libbpf “match this name to a kfunc in kernel BTF at load time.”
There are no Dumb Questions
Q: How do I know if
bpf_xxxis a helper or a kfunc?A: Helpers are listed in
include/uapi/linux/bpf.h(theenum bpf_func_idtable starting withBPF_FUNC_unspec). Kfuncs aren’t UAPI; their list lives in source files viaBTF_KFUNCS_STARTblocks.bpftool feature probeshows what’s available on your kernel. Or just check: does it appear in<bpf/bpf_helpers.h>? If yes, helper. If no but you see__ksym, kfunc.Q: Are helpers going away?
A: No. Existing helpers are stable forever (UAPI). New functionality comes as kfuncs. So the helper list will keep working but won’t grow.
bpf_printk and the trace_pipe debug channel
Today’s lab is the first in this book to use bpf_printk, so let’s be precise about what it is — because it does not go through the ringbuf or maps you’ve used on Days 1–6.
bpf_printk is not a function — it’s a libbpf macro. It builds a format string and dispatches to a helper:
/* tools/lib/bpf/bpf_helpers.h:341 */
#define bpf_printk(fmt, args...) ___bpf_pick_printk(args)(fmt, ##args)
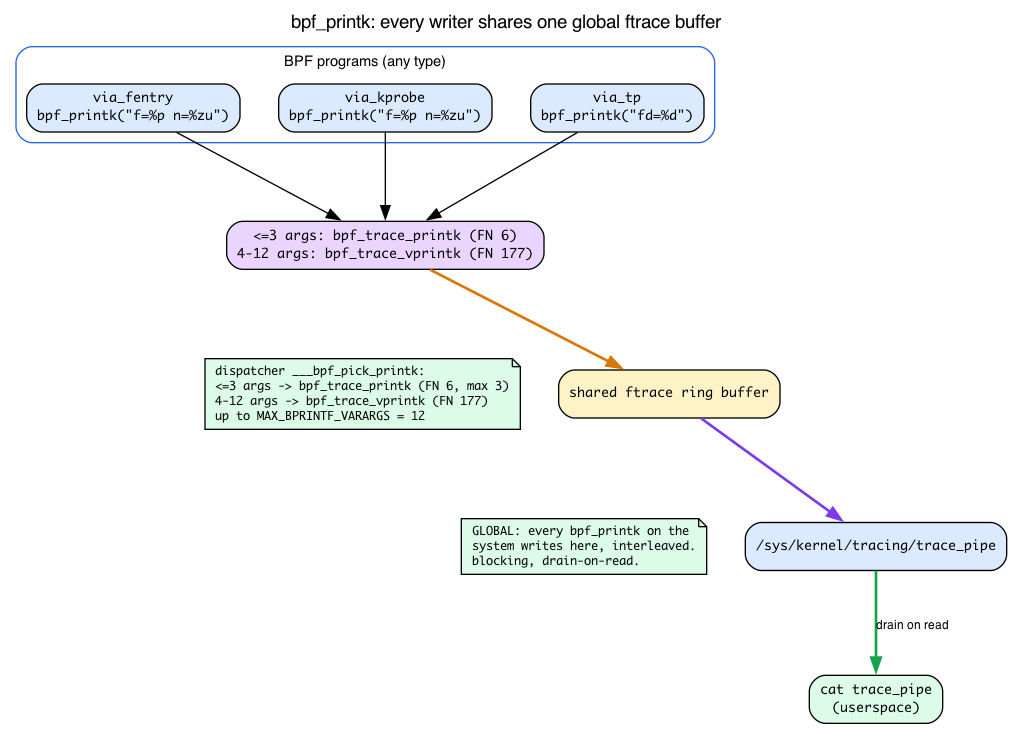
The dispatcher ___bpf_pick_printk (bpf_helpers.h:334) picks the lowering by argument count. For ≤3 args it selects the __bpf_printk path (bpf_helpers.h:293), whose underlying helper is bpf_trace_printk — BPF_FUNC_trace_printk = 6 in the UAPI enum:
/* include/uapi/linux/bpf.h:5911 */
FN(trace_printk, 6, ##ctx) \
For 4 or more args it selects a different path — __bpf_vprintk (bpf_helpers.h:304) — which calls a separate helper, bpf_trace_vprintk (BPF_FUNC_trace_vprintk = 177, include/uapi/linux/bpf.h:6082). So the underlying helper is not the same either way: FN 6 for the short form, FN 177 for the wide form.
Where does the output go? Not into your own ringbuf or map — into the kernel’s shared ftrace ring buffer, a single system-wide buffer that every bpf_printk user writes to. You read it from userspace through a tracefs file:
sudo cat /sys/kernel/tracing/trace_pipe
trace_pipe is a blocking, drain-on-read pipe: cat it and it blocks until a line appears, and reading a line consumes it. Because the buffer is global, you’ll see lines from every BPF program on the system that calls bpf_printk, interleaved. That’s exactly why today’s “observe all three” experiment can simply cat trace_pipe and watch three different programs’ output land in one stream.
How many format arguments? Up to 12. Each path has its own ceiling. The bpf_trace_printk helper (the ≤3 path) builds a fixed three-slot array:
/* kernel/trace/bpf_trace.c:359 */
#define MAX_TRACE_PRINTK_VARARGS 3
/* kernel/trace/bpf_trace.c:362 */
BPF_CALL_5(bpf_trace_printk, char *, fmt, u32, fmt_size, u64, arg1,
           u64, arg2, u64, arg3)
{
    u64 args[MAX_TRACE_PRINTK_VARARGS] = { arg1, arg2, arg3 };
    ...
}
But that MAX_TRACE_PRINTK_VARARGS = 3 is the limit of the legacy bpf_trace_printk helper only — not of the bpf_printk macro. Pass a fourth value and the dispatcher transparently switches you to bpf_trace_vprintk (FN 177), which packs the args into a u64[] and allows up to MAX_BPRINTF_VARARGS = 12 (include/linux/bpf.h:3875; the bound is enforced in bpf_trace.c:424 as data_len > MAX_BPRINTF_VARARGS * 8). So bpf_printk("%d %d %d %d", a, b, c, d) compiles and loads fine — only a 13th argument is rejected. Today’s lab passes only two values per call because that’s all each line needs, not because of a ceiling.
Framing: bpf_printk is a debugging and teaching tool. It’s global, low-throughput, and serializes all writers — fine for “did my program fire and what did it see?”, wrong for production. Real tracers stream through the ringbuf and maps you already learned. That’s exactly why the book waited until a “poke at the macros” day to introduce it.
Today’s lab — small, focused
We’re not building a new tracer today. We’re poking at what the macros emit.
inspect.bpf.c
#include "vmlinux.h"
#include <bpf/bpf_helpers.h>
#include <bpf/bpf_tracing.h>

char LICENSE[] SEC("license") = "GPL";

/* Same logic, three different program types */

SEC("fentry/vfs_read")
int BPF_PROG(via_fentry, struct file *f, char *buf, size_t n, loff_t *pos)
{
    bpf_printk("fentry: f=%p n=%zu", f, n);
    return 0;
}

SEC("kprobe/vfs_read")
int BPF_KPROBE(via_kprobe, struct file *f, char *buf, size_t n, loff_t *pos)
{
    bpf_printk("kprobe: f=%p n=%zu", f, n);
    return 0;
}

SEC("tracepoint/syscalls/sys_enter_read")
int via_tp(struct trace_event_raw_sys_enter *ctx)
{
    int fd = (int)ctx->args[0];
    bpf_printk("tp: fd=%d", fd);
    return 0;
}
Notice each bpf_printk passes at most two values (f and n, or just fd) — not because of any ceiling (the macro supports up to 12), but simply because that’s all each line needs. And via_tp reaches the fd through ctx->args[0], exactly the args[6] slot the sys_enter format file declares.
First generate the type header if you don’t already have it from Day 1, then build the object. The -D__TARGET_ARCH_x86 is required: BPF_KPROBE expands to the arch-specific PT_REGS_PARM* macros (which select di/si/dx for x86-64), and without it the compile fails — there’d be no way to know which register order to use.
# once per kernel, if you don't already have vmlinux.h from Day 1:
sudo bpftool btf dump file /sys/kernel/btf/vmlinux format c > vmlinux.h

clang -g -O2 -D__TARGET_ARCH_x86 -target bpf -c inspect.bpf.c -o inspect.bpf.o
The verifier only runs when a program is loaded, and the detailed per-instruction register state only prints at log level 2. Copy Day 6’s loader to inspect.c, point it at inspect.bpf.o, and raise the log level in the open options — the LIBBPF_OPTS line below is wired into the object-open call, which is what makes it take effect:
LIBBPF_OPTS(bpf_object_open_opts, opts, .kernel_log_level = 2);
struct bpf_object *obj = bpf_object__open_file("inspect.bpf.o", &opts);
bpf_object__load(obj);   /* verifier runs here; its log prints to stderr */
make
sudo ./inspect 2>&1 | less
If you have veristat (it ships in the kernel tree under tools/testing/selftests/bpf/, so you may need to build it), you can skip the loader entirely and dump the same per-instruction log: sudo veristat -v -l 2 inspect.bpf.o 2>&1 | less — -v is what emits the log and -l 2 is the log level that prints the R1_w=... register-state lines.
Inspect the verifier log for each program
For via_fentry, you’ll see early register state lines like:
0: R1=ctx() R10=fp0
1: (79) r1 = *(u64 *)(r1 +0)
2: R1_w=trusted_ptr_file(off=0,...)
R1_w=trusted_ptr_file — the Verifier sees R1 as a trusted (BTF-validated) pointer to struct file. That’s why f->f_pos works. Note the load is from +0 — ctx[0], the first slot of the trampoline array.
For via_kprobe:
0: R1=ctx()
1: (79) r1 = *(u64 *)(r1 +112)   /* PT_REGS_PARM1: di on x86_64 */
2: R1_w=scalar()
R1_w=scalar() — kprobe ctx access produces an untrusted scalar, not a typed pointer. That’s why direct deref f->f_pos is forbidden. And there’s the +112 from the pt_regs layout: offset 112 is di, the saved rdi, which held f.
For via_tp:
0: R1=ctx()
1: (61) r2 = *(u32 *)(r1 +16)
2: R2_w=scalar(...)
The tp ctx is a typed struct (provided by vmlinux.h); reads are scalar values from the copied event buffer — exactly the “kernel copied the fields in” model from the tracepoint section.
Inspect what BPF_PROG actually generated
Disassemble the same inspect.bpf.o you built above:
llvm-objdump -dr inspect.bpf.o | head -40
0000000000000000 <via_fentry>:
       0:	r4 = *(u64 *)(r1 + 0x10)
       1:	r3 = *(u64 *)(r1 + 0x0)
       2:	r1 = 0xa ll
       4:	w2 = 0x13
       5:	call 0x6
       6:	w0 = 0x0
       7:	exit
Because the inner ____via_fentry is static __always_inline and we compile at -O2, it is inlined into the single emitted function via_fentry — there is no separate inner function and no call to it. The only call is the bpf_trace_printk helper (call 0x6 — and yes, that 0x6 is BPF_FUNC_trace_printk = 6 from the UAPI enum). You’ll see via_fentry load f from *(u64 *)(r1 + 0x0) (ctx[0]) into r3 and n from *(u64 *)(r1 + 0x10) (ctx[2]) into r4 — the buf/ctx[1] slot at +0x8 is dead and elided. Run the same for via_kprobe and you’ll see it load from pt_regs offsets instead: *(u64 *)(r1 + 0x70) is di = PT_REGS_PARM1 = f (and +0x60 is dx). The two-function shape the macro creates collapses into one function in the object — the macro is purely a source-level code generator.
Observe all three reach the same read
The three programs each print via bpf_printk. Attach them and watch one vfs_read flow through all three paths. Auto-attach the object, then read the trace buffer while you trigger a read — trace_pipe is the shared ftrace buffer from the section above, so all three programs’ lines surface in the one stream:
sudo bpftool prog loadall inspect.bpf.o /sys/fs/bpf/insp autoattach
sudo cat /sys/kernel/tracing/trace_pipe &
dd if=/etc/hostname of=/dev/null bs=64 count=1
You’ll see three lines for the same call (addresses differ on your box; the point is the two f= values match):
             dd-20461   [001] ...21  9183.441: bpf_trace_printk: tp: fd=3
             dd-20461   [001] ...21  9183.441: bpf_trace_printk: fentry: f=ffff8e0c1a3b4500 n=64
             dd-20461   [001] ...21  9183.441: bpf_trace_printk: kprobe: f=ffff8e0c1a3b4500 n=64
fentry and kprobe both hook vfs_read, so the f= pointer for the same call is identical — even though fentry got it from BTF (ctx[0]) and kprobe from pt_regs->di. Same data, two paths. The tracepoint sits one layer up (the read() syscall entry, which later calls vfs_read), which is why it prints fd rather than f. Clean up:
sudo kill %1 2>/dev/null
sudo rm -rf /sys/fs/bpf/insp
What to break, in order
Break 1 — Try to direct-deref in a kprobe
SEC("kprobe/vfs_read")
int BPF_KPROBE(p, struct file *f) {
    loff_t pos = f->f_pos;          /* direct deref */
    bpf_printk("pos=%lld", pos);
    return 0;
}
Drop this into inspect.bpf.c, rebuild, and try to load it — bpftool prog loadall runs the verifier and prints its log to stderr on failure:
clang -g -O2 -D__TARGET_ARCH_x86 -target bpf -c inspect.bpf.c -o inspect.bpf.o
sudo bpftool prog loadall inspect.bpf.o /sys/fs/bpf/x
The verifier rejects it (no pin is created on failure, so there’s nothing to clean up):
R1 invalid mem access 'scalar'
Because in kprobe context, R1 (the cast from pt_regs->di) is a scalar, not a PTR_TO_BTF_ID. Fix:
loff_t pos;
bpf_probe_read_kernel(&pos, sizeof(pos), &f->f_pos);
Break 2 — Use BPF_PROG with kprobe
SEC("kprobe/vfs_read")
int BPF_PROG(p, struct file *f) { ... }
This one loads (verify with sudo bpftool prog loadall inspect.bpf.o /sys/fs/bpf/x — no verifier error — then sudo rm -rf /sys/fs/bpf/x), but the argument access is wrong. BPF_PROG reads ctx[0] — but kprobe’s ctx is pt_regs *, not the trampoline ctx array. As the pt_regs layout showed, offset 0 of struct pt_regs on x86-64 is the saved r15, a callee-saved register that has nothing to do with the first function argument. So BPF_PROG casts the leftover r15 to struct file *: pure garbage. Use BPF_KPROBE for kprobes — it reads PT_REGS_PARM1 = di = offset 112, where f actually lives.
Break 3 — Direct deref in a regular tracepoint
SEC("tracepoint/sched/sched_switch")
int p(struct trace_event_raw_sched_switch *ctx) {
    bpf_printk("%s", ctx->prev_comm);   /* direct read of copied bytes */
}
Works — sudo bpftool prog loadall inspect.bpf.o /sys/fs/bpf/x reports the program loaded with no verifier error (clean up with sudo rm -rf /sys/fs/bpf/x). The ctx->prev_comm is a copied char array embedded in the event struct (the kernel copied it in via TRACE_EVENT), not a pointer. No deref needed.
But:
SEC("tracepoint/sched/sched_switch")
int p(struct trace_event_raw_sched_switch *ctx) {
    /* try to read the parent task's comm */
    /* you can't! ctx doesn't have a task pointer, just the values */
}
Regular tracepoint/... programs give you what the kernel chose to copy. The format file for sched_switch lists prev_comm, prev_pid, next_comm, … — copied scalars and char arrays, no task_struct pointer. Since no pointer was copied, there’s nothing to follow to the parent. For more, switch to tp_btf (Day 8) where you get live typed pointers; use raw_tracepoint/... only when you explicitly want raw positional tracepoint args.
What to read in the kernel
tools/lib/bpf/bpf_tracing.h— the canonical reference forBPF_PROG(:672),BPF_KPROBE(:816),BPF_KRETPROBE,BPF_KSYSCALL, and thePT_REGS_*family (PT_REGS_PARM1at:492, the__PT_PARM1_REG didefinitions from:87). Read all of it. It’s ~930 lines but most is per-arch macros for register names.arch/x86/include/asm/ptrace.h— the 64-bitstruct pt_regs(:103) whose field order (r15first,diat offset 112) is what makes the+0x70/+0x60loads legible, plus the separate 32-bit struct at:12proving the layout is arch-specific.include/uapi/linux/bpf.h— searchenum bpf_func_id. The complete helper list. ~200 entries. Skim — recognize the categories (skb manipulation, map ops, networking, tracing, time, random, etc.). Notetrace_printk= 6 (:5911) andget_func_arg= 183 (:6088), and thestruct bpf_raw_tracepoint_argsat:7286.include/linux/tracepoint.handinclude/trace/trace_events.h—TRACE_EVENT()(tracepoint.h:671) and thestruct trace_event_raw_##name { … }generation site (trace_events.h:62) that produces the structs your tracepoint programs declare.include/trace/events/syscalls.h— thesys_enterdeclaration (:18) with__array(unsigned long, args, 6), proving whyctx->args[0..5]works.kernel/bpf/helpers.c— searchbpf_get_current_pid_tgid_proto. Each helper has abpf_func_protostruct that declares its argument types, return type, and which program types can call it. This is what the Verifier consults when type-checking a helper call.kernel/trace/bpf_trace.c—MAX_TRACE_PRINTK_VARARGS(:359) andbpf_trace_printk_proto(:386), the helperbpf_printklowers to; plusget_func_arg(:1194).net/core/filter.c— searchbpf_helper_changes_pkt_dataorxdp_func_proto. Per-program-type proto tables that gate which helpers a given program can call.Documentation/bpf/btf.rstandDocumentation/bpf/kfuncs.rst— official docs, one read each.
Bullet Points
BPF_PROGis a code generator that unpacks au64 *ctxarray into typed parameters via casts (ctx[0],ctx[1]…).BPF_KPROBE/BPF_KRETPROBEare a different macro: ctx isstruct pt_regs *, a saved-register snapshot from the int3 trap, unpacked viaPT_REGS_PARM*(= named register slots).- On x86-64
struct pt_regsstarts withr15at offset 0, withdx/si/diat0x60/0x68/0x70— soPT_REGS_PARM1readsdiat offset 112, and a strayBPF_PROGon a kprobe readsr15= garbage. - fentry/fexit give you BTF-typed pointers — direct deref OK.
- kprobe gives you scalars from registers — must use
bpf_probe_read_kernel. - A tracepoint is a static
TRACE_EVENT-declared hook; it generates astruct trace_event_raw_<name>and a/sys/.../formatschema. The kernel copies fields in, so you read values but get no live kernel pointers. - Regular tracepoint gives you copied event bytes (
ctx->args[N], embedded char arrays). - Raw tracepoint gives you positional raw args in
struct bpf_raw_tracepoint_args { __u64 args[]; }— the unmodifiedTP_PROTOarguments, cast by hand. - tp_btf gives you those same raw args but BTF-typed (
PTR_TO_BTF_ID) — direct deref, tracepoint stability — modern preference. bpf_printkis a macro that dispatches by arg count: ≤3 args lower to thebpf_trace_printkhelper (FN 6, max 3), 4–12 args to a separatebpf_trace_vprintkhelper (FN 177, maxMAX_BPRINTF_VARARGS= 12). Output lands in the shared ftrace buffer read via/sys/kernel/tracing/trace_pipe. Debug-only, global, serialized — production uses ringbuf/maps.- Helpers are a frozen UAPI list in
include/uapi/linux/bpf.h. Kfuncs are non-UAPI in-tree functions exposed via BTF; they can evolve. New BPF features are added as kfuncs, not helpers. Helper allowance is per program type.
Check question
Why can your fentry program directly deref f->f_pos, but your kprobe program cannot?
Click to reveal answer
Answer: In fentry, the trampoline saves arguments into a u64 ctx[] and BPF_PROG casts them to your declared types. The Verifier matches your declared types against the function’s BTF signature, marking each parameter as PTR_TO_BTF_ID — a trusted, typed kernel pointer the Verifier knows it can deref safely. In kprobe, the ctx is struct pt_regs * — a saved register snapshot from the int3 trap. The Verifier doesn’t bind those register values to the function’s BTF signature (kprobe is generic; it doesn’t know which function it’s tracing at load time the way fentry does). So the cast (struct file *)PT_REGS_PARM1(ctx) — which is really ctx->di, the saved rdi at offset 112 — produces a scalar (SCALAR_VALUE) from the Verifier’s perspective, not a typed pointer. Scalars can’t be derefed; you have to round-trip through bpf_probe_read_kernel, which fault-handles.
Tomorrow
Day 8: tp_btf vs raw tracepoint in depth. We trace sched_switch, get typed task_struct * pointers for both prev and next, and observe scheduling latency without writing any kprobe glue.