Day 8 — Tracepoints, raw vs tp_btf, and how to find them
Today’s mission: measure scheduler latency by hooking
sched_switch. But first understand what that even means — what a context switch is, why a task “waits,” and exactly what number the lab computes. Then learn the anatomy of theTRACE_EVENTmacro that makes a tracepoint exist, how the kernel dispatches a firing tracepoint to its listeners, and why tp_btf is the cheap, powerful way in. Compare raw tracepoint and tp_btf attach modes. Learn how to discover every tracepoint on your kernel and read its format. Total time: ~110 minutes.
Why tracepoints when fentry exists?
Fentry attaches to function entries. That’s perfect when there’s a function whose name describes the event you care about (vfs_read, filename_unlinkat). But many interesting events don’t map to a single function — or they’re emitted from inside a function that does many things.
Tracepoints are explicit instrumentation points added by kernel developers via TRACE_EVENT(...) macros. They name the event, specify the data fields, and live forever as part of the kernel’s API contract.
When you write a tracer for “every context switch,” you don’t want to attach to __schedule and figure out which paths inside it correspond to actual switches. You want sched_switch — the tracepoint that fires once per actual switch with prev and next already determined.
Tracepoints exist for: scheduler events, block I/O, networking, memory allocation, filesystem operations, syscalls, and many more.
First: what is a context switch, and what does “scheduling latency” mean?
The whole lab today computes a number it calls wait_ns and prints lines like firefox [4001] waited 152 µs. Before we hook anything, you need to know what that number is — otherwise it’s just a digit with a unit. So let’s build the scheduler model from scratch. You met task_struct on Day 3 (the kernel’s per-process descriptor); nothing earlier taught you how the scheduler runs those tasks. Here it is.
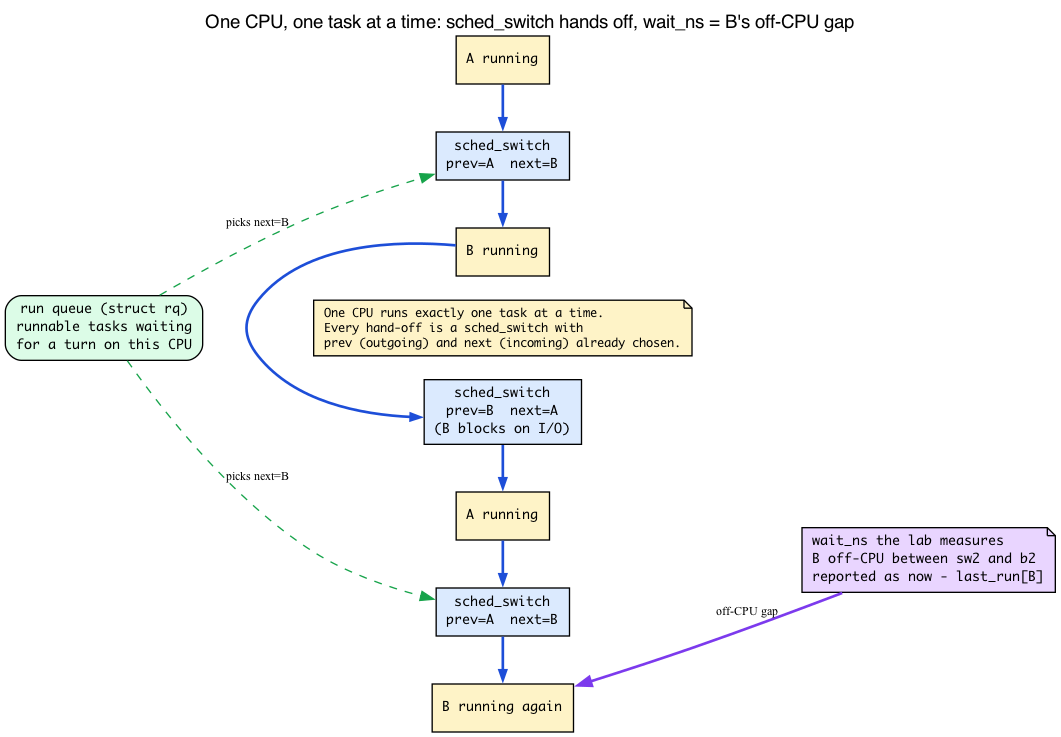
One CPU runs exactly one task at a time. That’s the whole problem the scheduler solves. You have hundreds of runnable threads and (say) 8 logical CPUs, so at any instant at most 8 threads are physically executing. Everyone else is waiting for a turn.
A run queue is the waiting room. Each CPU has its own run queue (struct rq) — the set of tasks that are runnable (ready to execute, not blocked on I/O or a lock) but aren’t the one currently on the CPU. The scheduler’s job is to repeatedly pick the next task to run from that queue.
A context switch is the hand-off. When the scheduler decides task B should run instead of task A, it performs a context switch: save A’s CPU register state and stack pointer, load B’s, and resume B where it last left off. To the running code, nothing happened — A simply “froze” mid-instruction-stream and will thaw later exactly where it stopped. The function that performs the actual register/stack swap is context_switch():
/* kernel/sched/core.c:5329 */
context_switch(struct rq *rq, struct task_struct *prev,
               struct task_struct *next, struct rq_flags *rf)
Note the two arguments already named prev and next — the outgoing and incoming task_struct. By the time the switch happens, the scheduler has already chosen who runs next.
sched_switch fires once per switch, after the choice is made. A single function drives every voluntary switch (a task blocks on I/O) and every preemptive switch (a task’s time slice expires, or a higher-priority task woke up): __schedule().
/* kernel/sched/core.c:7017 */
static void __sched notrace __schedule(int sched_mode)
Inside it, just before handing off to context_switch, the kernel emits the tracepoint with the already-decided prev and next:
/* kernel/sched/core.c:7186 */
trace_sched_switch(preempt, prev, next, prev_state);
That trace_sched_switch(...) call is the tracepoint firing. Those four arguments — preempt, prev, next, prev_state — are exactly the arguments your tp_btf program will receive. Hold that thought; we’ll cash it in below.
So what is “scheduling latency”? Informally: the gap between the moment a task became runnable (it was put on the run queue) and the moment the CPU actually picked it and started running it. During that gap the task sits in the run queue while other tasks use the CPU. A long gap means the task was ready but couldn’t get a turn — that’s scheduling delay, and it’s what makes an interactive app feel laggy under load.
Be precise about what THIS lab measures. We are not going to install two probes. We record one timestamp per task on every switch-out (when a task becomes prev), and when that same tid later shows up as next (switched back in), we report now - last_run. That is the wall-clock time the task spent off-CPU between two of its own on-CPU stints — the time it was not running. That’s an excellent, cheap proxy for scheduling delay, but it is not the textbook wakeup-to-run latency. The textbook version would also need sched_wakeup to mark the exact instant the task became runnable (it might have been blocked on disk for much of that off-CPU gap, which isn’t the scheduler’s fault). State this to yourself every time you read the output: wait_ns = elapsed off-CPU time between two runs of the same task. Trust the number for what it is.
There’s one more payoff from knowing prev and next are full struct task_struct * (Day 3’s descriptor): tp_btf hands you those live typed pointers, so you can read prev->mm, prev->cgroup, prev->real_parent, and anything else in the task. A regular tracepoint, as we’ll see, only hands you a handful of copied fields. That difference is the spine of today’s chapter.
The three BPF-facing ways to attach to a tracepoint
For tracepoint events, BPF has three related section families:
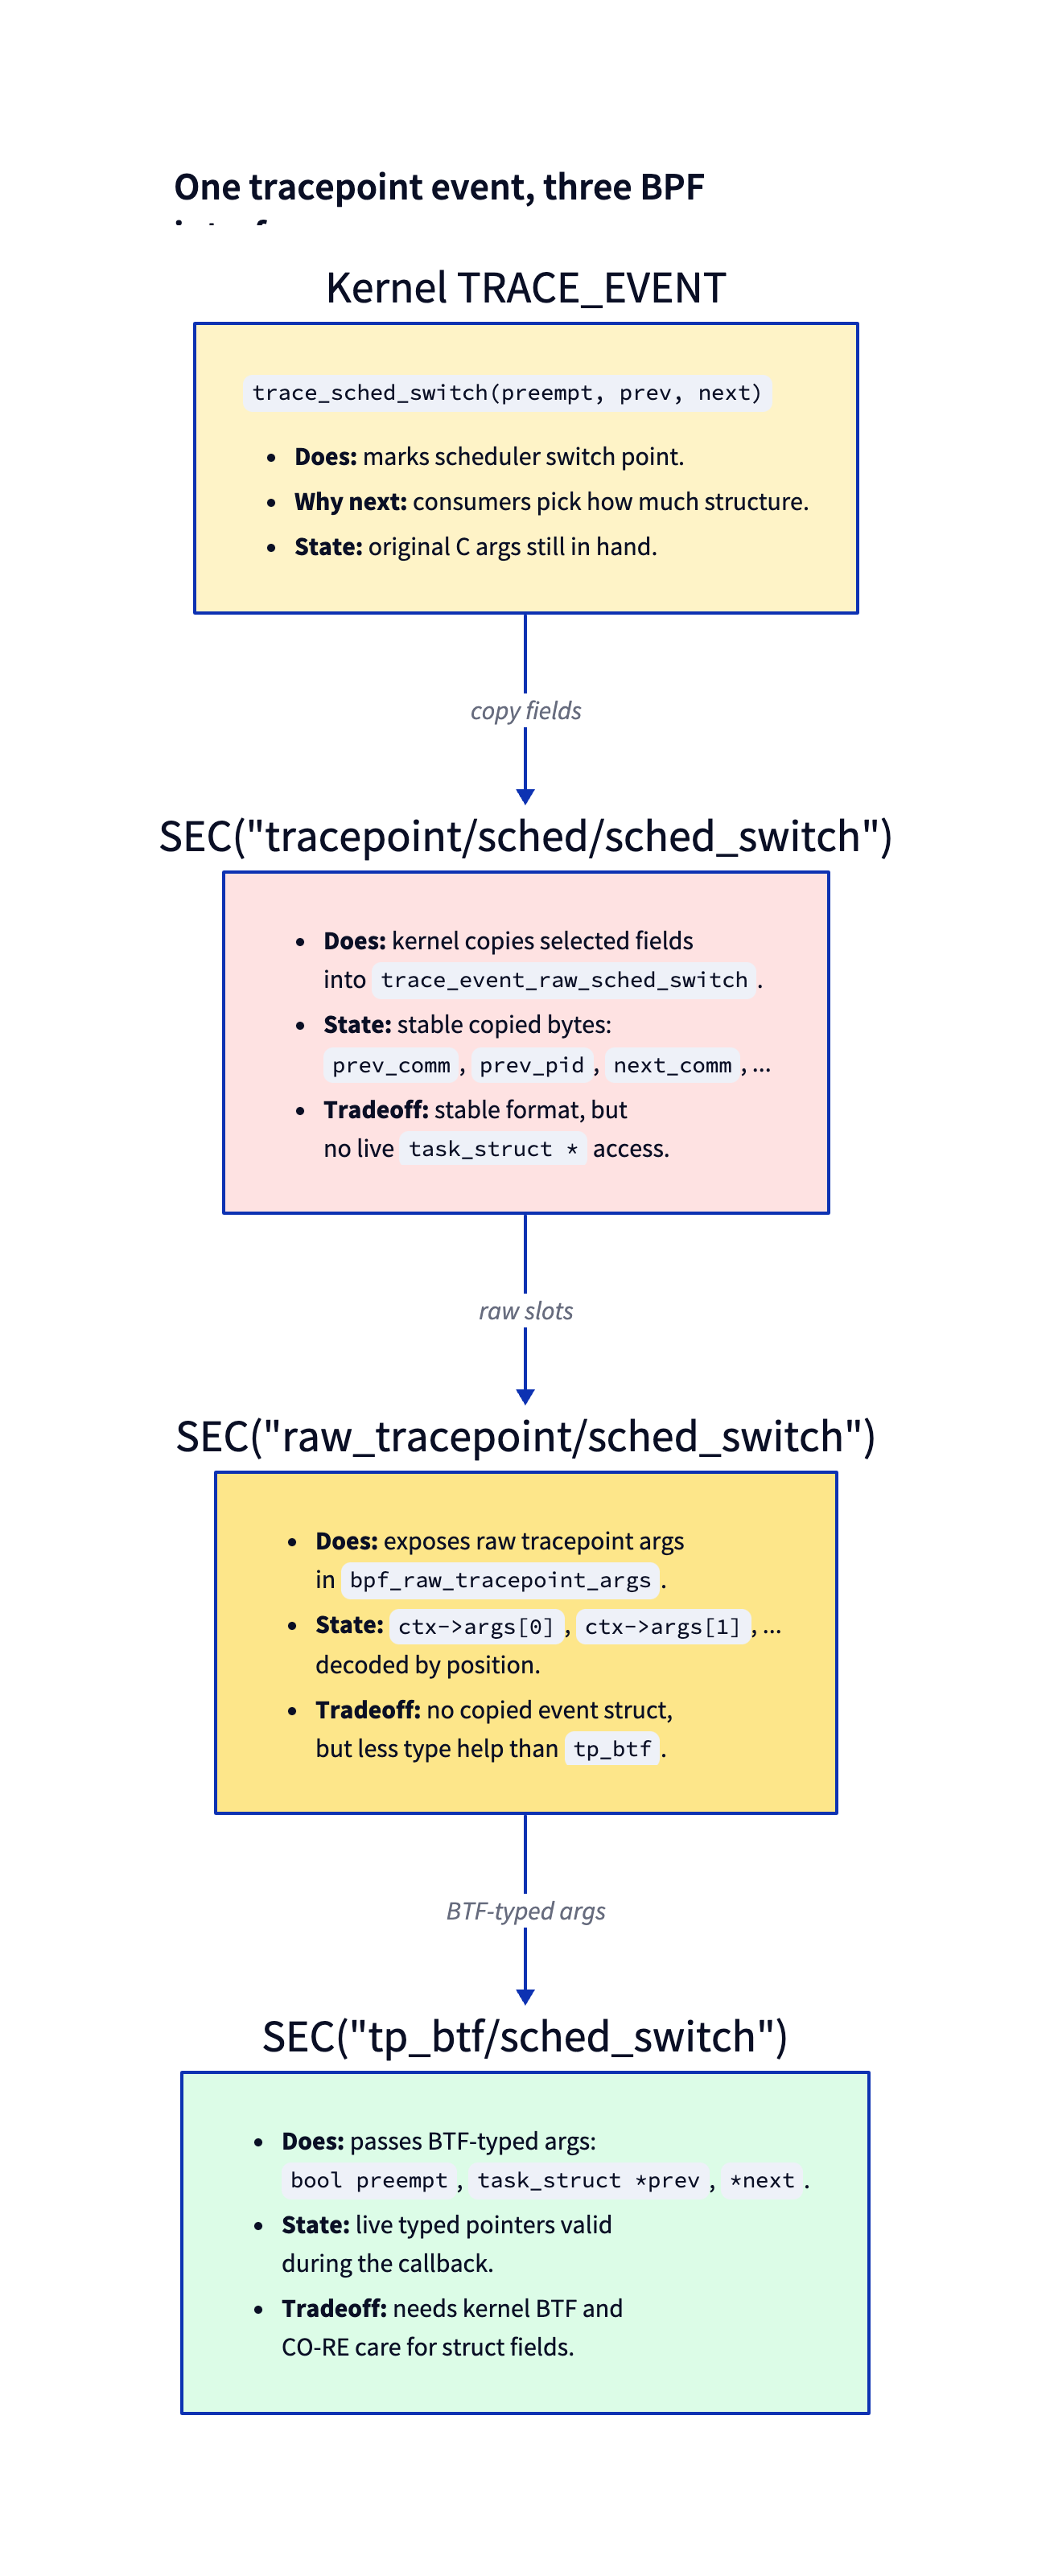
Regular tracepoint (SEC("tracepoint/group/event")) gives you a struct of copied bytes — whatever fields the tracepoint definition chose to copy out. Stable across kernel versions because the tracepoint format is part of the kernel’s API.
Raw tracepoint (SEC("raw_tracepoint/event")) gives you raw positional arguments in struct bpf_raw_tracepoint_args. It avoids the copied event struct, but you unpack by index and lose typed-argument ergonomics.
tp_btf (SEC("tp_btf/event")) gives you the original typed kernel pointers the tracepoint received as arguments. You can dereference fields directly when the pointer is valid for the callback. Same hook, more power.
Same event, three BPF-facing interfaces. The kernel dispatches whichever listener types are attached:
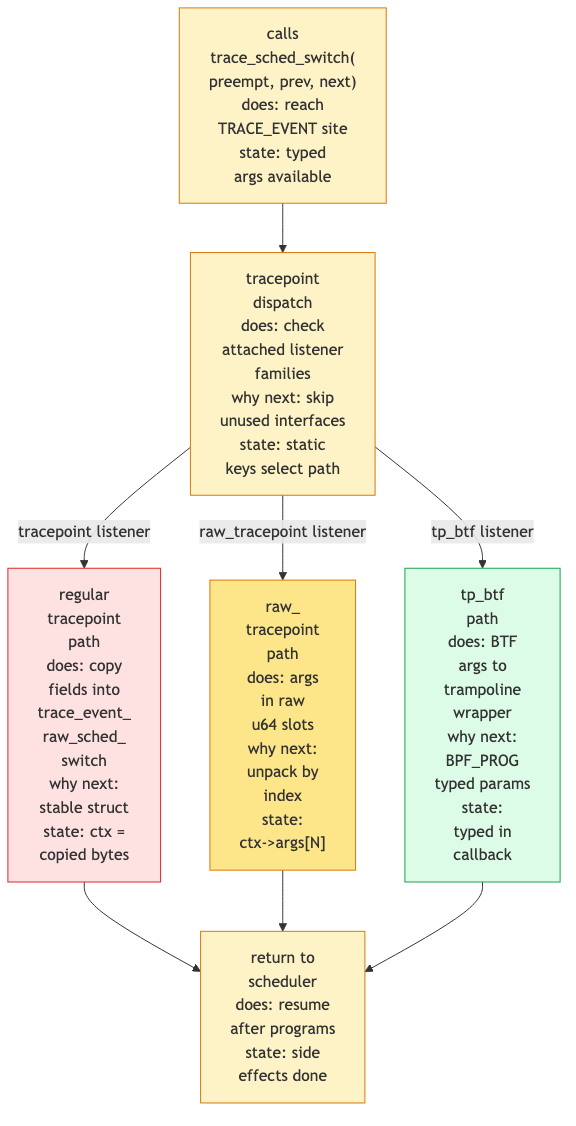
When a tracepoint fires, regular tracepoint/... listeners get the copied event struct, raw_tracepoint/... listeners get raw argument slots, and tp_btf/... listeners get typed arguments. Cost is bounded: the event-struct copy only happens for regular tracepoint listeners.
That “cost is bounded” claim is load-bearing for the whole “use tp_btf, it’s cheaper” thesis — so let’s ground it, because right now it’s just an assertion.
How a firing tracepoint actually reaches its listeners
A tracepoint is not an if in the hot path. It’s a registered list of probe callbacks sitting behind a near-zero-cost static branch. When the tracepoint is off (no listeners), a static-key patch turns it into a fall-through — the CPU pays essentially nothing. When at least one listener attaches, the branch is patched live to call into the dispatch machinery.
That dispatch machinery is a generated per-event function, __traceiter_<event>. Every TRACE_EVENT expands through a chain of macros (TRACE_EVENT → DECLARE_TRACE_EVENT → __DECLARE_TRACE → __DECLARE_TRACE_COMMON), and it is __DECLARE_TRACE_COMMON that generates it:
/* include/linux/tracepoint.h:267 */
extern int __traceiter_##name(data_proto);
and the firing site reaches it through a static call (on a CONFIG_HAVE_STATIC_CALL kernel — the common case today):
/* include/linux/tracepoint.h:227 */
static_call(tp_func_##name)(__data, args);
(On kernels without CONFIG_HAVE_STATIC_CALL, the #else branch at line 231 reaches the same iterator with a plain indirect call: __traceiter_##name(NULL, args).)
When sched_switch fires, __traceiter_sched_switch walks the list of attached probe callbacks and calls each one with the raw TP_PROTO arguments — (preempt, prev, next, prev_state). Crucially: nothing is copied at this layer. The iterator just passes the pointers the kernel already had in registers to each registered function.
So where does the “copied event struct” come from? It’s itself just one probe callback on that list. The probe that performs the TP_fast_assign memcpy (the flat prev_comm@8, prev_pid@24, … struct) is registered only when a regular tracepoint/... (or ftrace/perf) listener attaches. If the only listener is a tp_btf or raw program, that copy probe is never on the list, so the memcpy never runs. That is precisely why the cost is “bounded”: you pay the copy if and only if someone asked for the copied form.
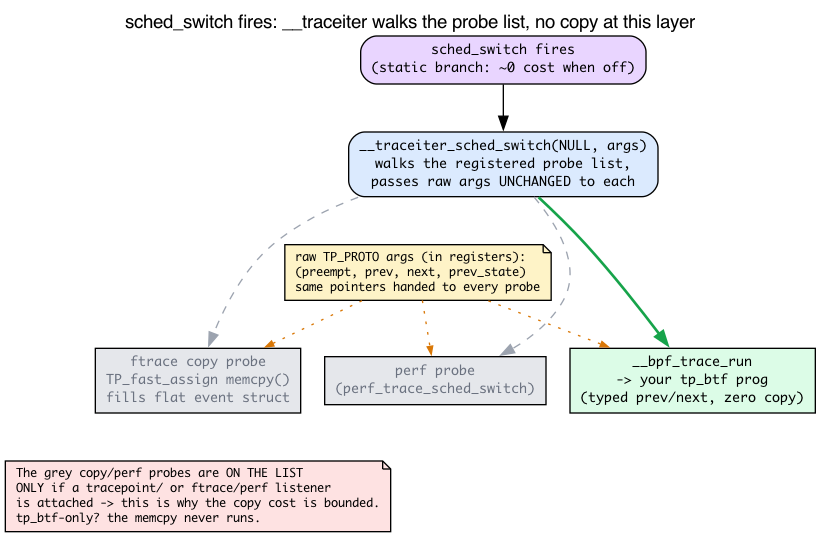
Where BPF plugs in. BPF raw and tp_btf programs attach through the same raw-tracepoint path. libbpf opens a BPF_TRACE_RAW_TP link:
/* kernel/bpf/syscall.c:4388 */
case BPF_TRACE_RAW_TP:
The attach resolves the event name to its raw event map:
/* kernel/trace/bpf_trace.c:2051 */
struct bpf_raw_event_map *bpf_get_raw_tracepoint(const char *name)
and when the tracepoint fires, the BPF dispatch probe on the iterator’s list is __bpf_trace_run, which invokes your program with the raw argument slots:
/* kernel/trace/bpf_trace.c:2073 */
void __bpf_trace_run(struct bpf_raw_tp_link *link, u64 *args)
tp_btf differs from raw in exactly one way: the verifier tags those raw argument slots with their BTF types, so instead of opaque u64s you get a typed struct task_struct *prev. Same path, same __bpf_trace_run, same zero-copy delivery — just type information layered on top. Because tp_btf rides this raw path, it pays neither the per-event struct copy nor a tracefs format lookup: it just receives the pointers the kernel already had in registers. This is the concrete grounding under the chapter’s “tp_btf goes through the same raw-tracepoint path” sentence.
There are no Dumb Questions
Q: If tp_btf is strictly better, why does raw tracepoint still exist?
A: Three reasons. First, history — raw tracepoints predate BTF. Second, raw tracepoints work on kernels without BTF (rare today, but possible). Third, raw tracepoint structs are explicitly stable —
prev_commwill always be a 16-byte char array; the kernel maintainers commit to that. tp_btf gives you livetask_struct *, buttask_structitself isn’t stable across versions (you’d need CO-RE for any field access).Q: How do tracepoints differ from kprobe?
A: Tracepoints are explicitly placed by kernel developers as part of the kernel’s API. Their format is stable. Kprobes are dynamic — you can attach to any function, but the function isn’t part of any contract; it can be renamed, removed, or have its signature change in the next release.
Q: What about
raw_tracepoint(with the underscore)?A: That’s the raw positional-argument mode:
ctx->args[0],ctx->args[1], and so on. It is distinct fromSEC("tracepoint/..."), which receives a copied event struct.tp_btfsupersedes raw tracepoints for most new code on BTF-enabled kernels because it gives typed arguments instead of positional slots.
How to find tracepoints on your kernel
# All tracepoints, grouped by subsystem:
sudo ls /sys/kernel/tracing/events/

# All sched events:
sudo ls /sys/kernel/tracing/events/sched/

# Format of a specific tracepoint (the struct you'd get from raw):
sudo cat /sys/kernel/tracing/events/sched/sched_switch/format
These all need sudo: the tracefs root /sys/kernel/tracing is mounted mode 0700 root:root, so unprivileged users can’t even traverse into events/. (The event subdirectories below it are 0755, and each format file is 0440 root:root, but the root directory gates access to everything underneath.) You’ll see the struct layout, e.g.:
name: sched_switch
ID: 310
format:
	field:char prev_comm[16];	offset:8;	size:16;	signed:0;
	field:pid_t prev_pid;	offset:24;	size:4;	signed:1;
	field:int prev_prio;	offset:28;	size:4;	signed:1;
	field:long prev_state;	offset:32;	size:8;	signed:1;
	field:char next_comm[16];	offset:40;	size:16;	signed:0;
	field:pid_t next_pid;	offset:56;	size:4;	signed:1;
	field:int next_prio;	offset:60;	size:4;	signed:1;
...
Those prev_*/next_* fields are exactly the copied struct a regular tracepoint/... program receives.
Where the format file and the copied bytes actually come from
You just saw two seemingly-unrelated descriptions of the same event: a flat format file with byte offsets, and (earlier) a TP_PROTO(...) C argument list. How does one tracepoint yield both? The answer is the anatomy of the TRACE_EVENT() macro, and once you see it, every “where did that field come from” question dissolves.
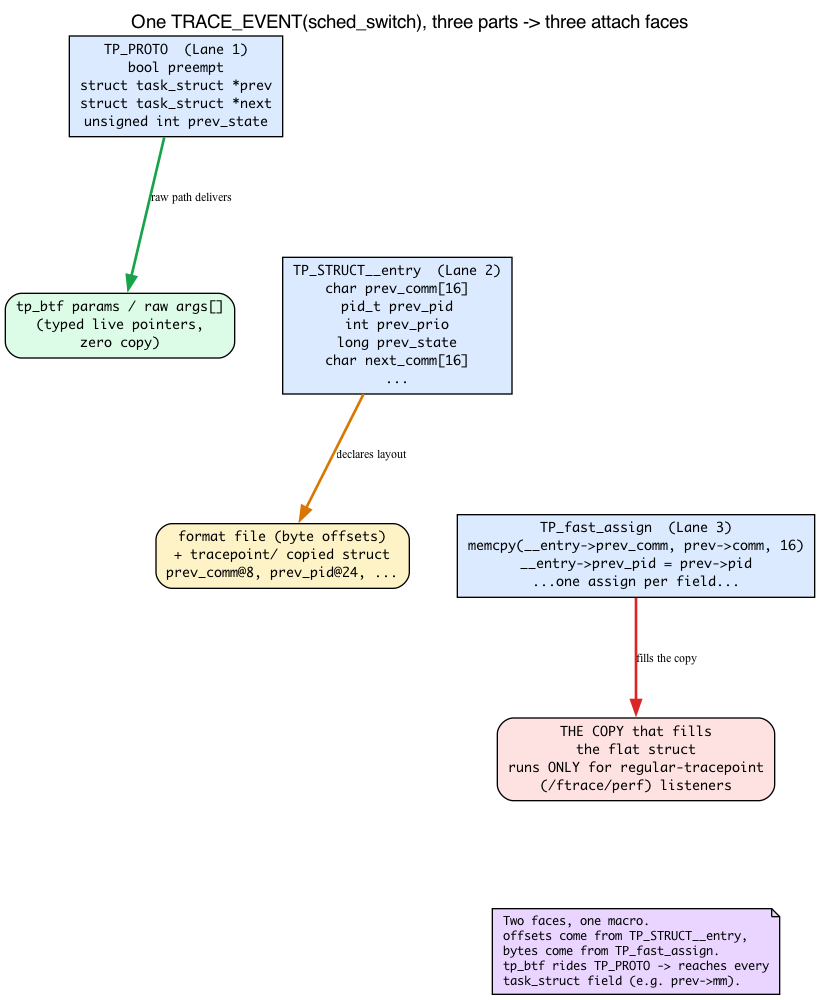
Open include/trace/events/sched.h and look at the macro for sched_switch. It has three parts that map directly onto the three attach modes:
/* include/trace/events/sched.h:220 */
TRACE_EVENT(sched_switch,

	/* include/trace/events/sched.h:222 — the C argument list */
	TP_PROTO(bool preempt,
		 struct task_struct *prev,
		 struct task_struct *next,
		 unsigned int prev_state),

	/* include/trace/events/sched.h:229 — the flat per-event struct layout */
	TP_STRUCT__entry(
		__array( char, prev_comm, TASK_COMM_LEN )
		__field( pid_t, prev_pid )
		__field( int, prev_prio )
		__field( long, prev_state )
		__array( char, next_comm, TASK_COMM_LEN )
		__field( pid_t, next_pid )
		__field( int, next_prio )
	),

	/* include/trace/events/sched.h:239 — code that fills the flat struct */
	TP_fast_assign(
		memcpy(__entry->prev_comm, prev->comm, TASK_COMM_LEN); /* :240 */
		__entry->prev_pid = prev->pid;
		/* ...one assignment per field... */
	),
	...
);
Read the three parts as three answers:
TP_PROTOis the C argument list. These become your tp_btfBPF_PROGparameters and the rawargs[]slots. This is the contract the raw path delivers.TP_STRUCT__entrydeclares the layout of the flat per-event struct. This is exactly what theformatfile describes —prev_commfirst (offset 8 after an 8-byte common header), thenprev_pid, and so on. A regulartracepoint/...program receives a pointer to a struct shaped like this.TP_fast_assignis the code that copies live data into that flat struct when the event fires. Thememcpy(__entry->prev_comm, prev->comm, TASK_COMM_LEN)at line 240 is the literal copy — the “copy cost” we said only happens for regular-tracepoint listeners. It’s the body of that one copy-probe on the iterator’s list.
So the offsets you cat out of the format file (prev_comm@8, prev_pid@24, prev_state@32, …) are generated from TP_STRUCT__entry, and the bytes that fill them at runtime are generated from TP_fast_assign. Two faces, one macro.
This is also the airtight reason a regular tracepoint can never reach prev->mm: TP_fast_assign only copied the handful of fields the kernel author chose to put in TP_STRUCT__entry. There’s no mm in there, so there’s nothing to read. tp_btf instead receives the un-copied TP_PROTO pointer prev, so every field of task_struct is reachable.
One small consistency you’ll lean on: TASK_COMM_LEN is 16:
/* include/linux/sched.h:325 */
TASK_COMM_LEN = 16,
That’s why both the kernel’s __array(char, prev_comm, TASK_COMM_LEN) and your own struct event { char comm[16]; } agree, and why __builtin_memcpy(dst, src, sizeof(dst)) of 16 bytes is exactly right.
For a BPF-aware view of what your kernel exposes, perf lists every registered tracepoint by name:
sudo perf list 'sched:*' # all sched tracepoints
  sched:sched_migrate_task                           [Tracepoint event]
  sched:sched_process_exec                           [Tracepoint event]
  sched:sched_process_fork                           [Tracepoint event]
  sched:sched_switch                                 [Tracepoint event]
  sched:sched_wakeup                                 [Tracepoint event]
  ...
(Note: sudo bpftool perf list is not a way to discover tracepoints — it lists BPF programs currently attached to perf events, so on an idle box with nothing loaded it prints nothing at all.)
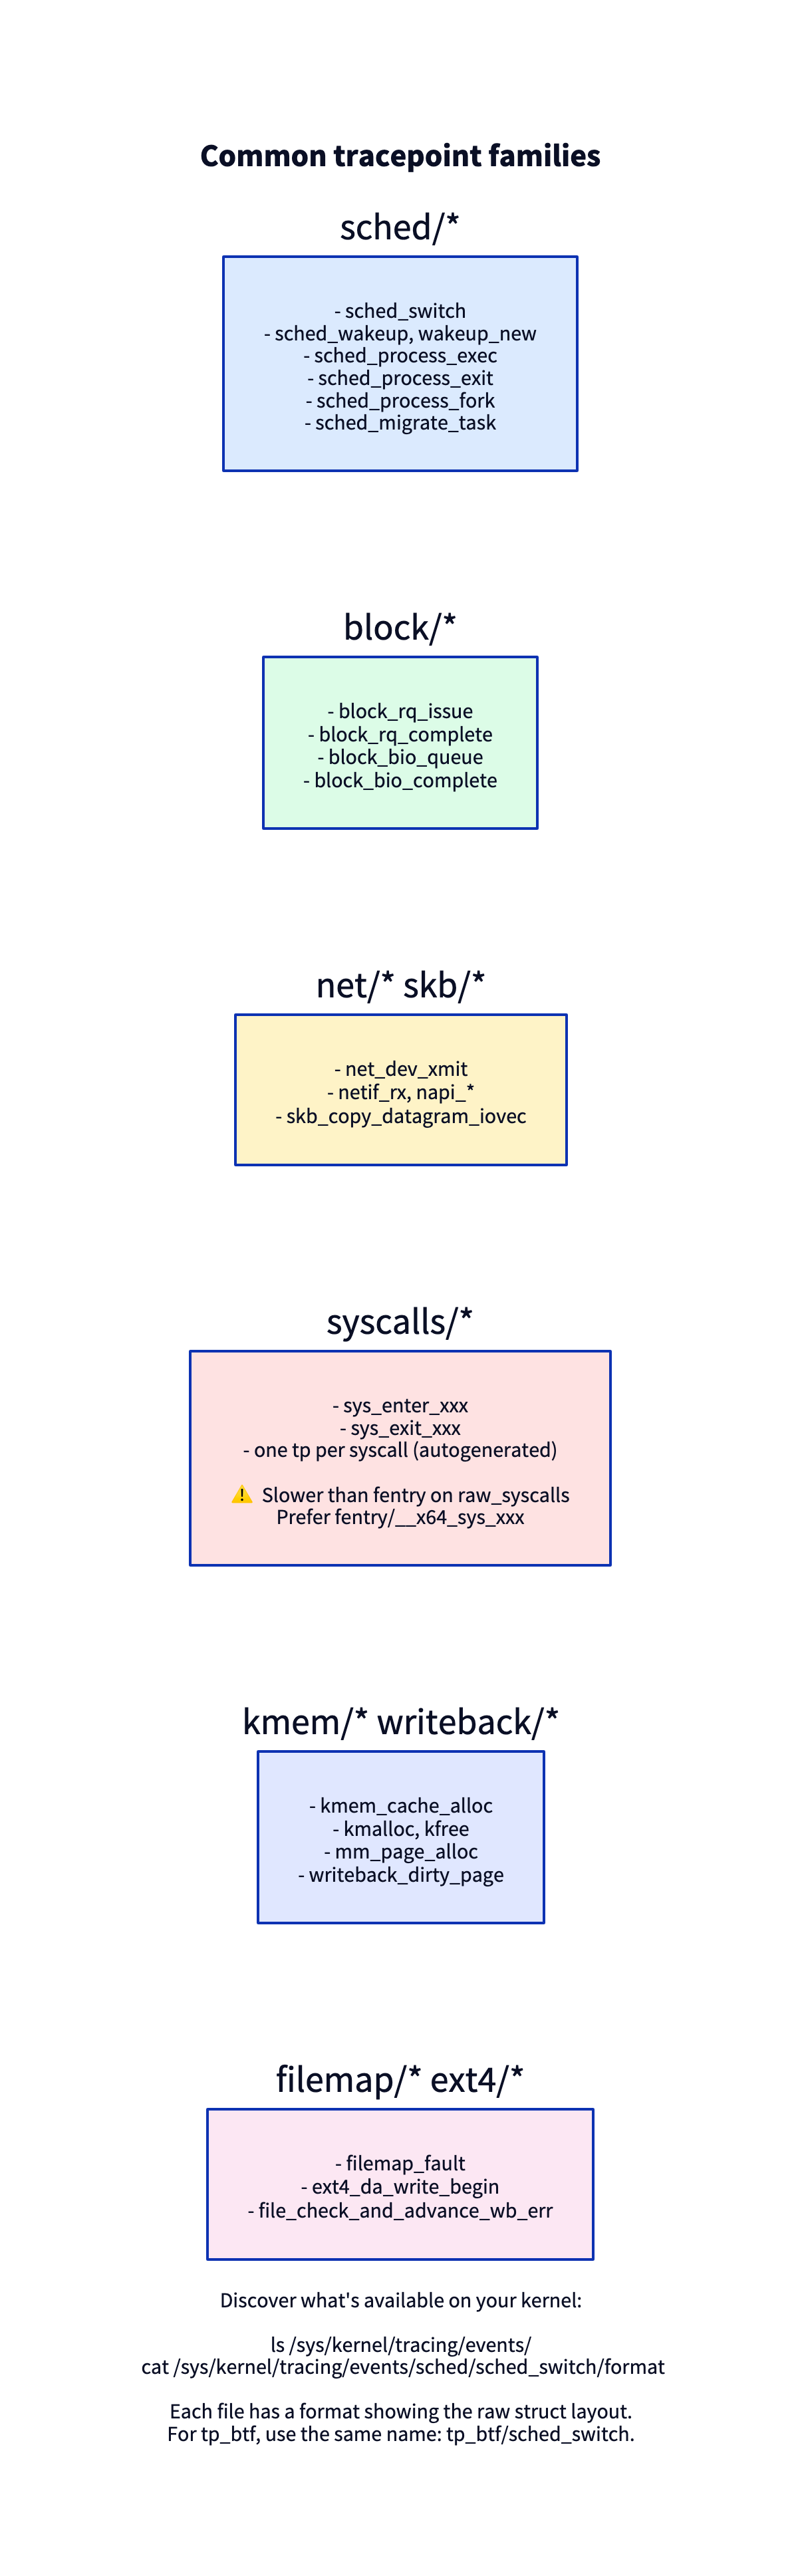
Common families you should know about:
Sharpen your pencil
A workload runs slowly. You want to see which tasks the scheduler is preempting. You could:
- fentry on
__schedule().- Raw tracepoint on
sched_switch.- tp_btf on
sched_switch.Which gives you the cleanest data with least friction?
.
.
.Answer: (3).
__scheduleruns for many reasons; you’d have to figure out which calls are switches (and as we saw,__scheduleis the single function behind every voluntary and preemptive switch — one function, many reasons). Rawsched_switchgives you the right event but only copied fields (no access to e.g.prev->mm). tp_btf gives you livetask_struct *prev, *next— read whatever you want.
tp_btf signature — how to know the arguments
For an fentry program, the function’s signature is in BTF — straightforward. For a tp_btf program, the tracepoint’s signature is what matters. Tracepoints are defined via TRACE_EVENT() macros, and the args are the parameters declared in TP_PROTO (which, you now know, is the same list __traceiter_sched_switch passes unchanged to every listener).
Look in include/trace/events/sched.h:
TRACE_EVENT(sched_switch,
    TP_PROTO(bool preempt,
             struct task_struct *prev,
             struct task_struct *next,
             unsigned int prev_state),
    ...
);
So your tp_btf program is:
SEC("tp_btf/sched_switch")
int BPF_PROG(on_switch, bool preempt, struct task_struct *prev, struct task_struct *next, unsigned int prev_state)
Four args matching the TP_PROTO (the trailing prev_state was added in 5.18 — commit 9c2136be0878, “sched/tracing: Append prev_state to tp args instead”).
For tracepoints whose TP_PROTO you don’t know offhand, bpftool btf dump file /sys/kernel/btf/vmlinux | grep btf_trace_sched_switch will show you the typedef.
The lab
schedlat.h — the shared event record
#ifndef PRACTICAL_EBPF_SCHEDLAT_H
#define PRACTICAL_EBPF_SCHEDLAT_H

struct event {
    unsigned int prev_pid;
    unsigned int next_pid;
    unsigned long long wait_ns;     /* how long next was waiting */
    char prev_comm[16];
    char next_comm[16];
};

#endif
schedlat.bpf.c — measure scheduling latency per task
#include "vmlinux.h"
#include <bpf/bpf_helpers.h>
#include <bpf/bpf_tracing.h>

#include "schedlat.h"

char LICENSE[] SEC("license") = "GPL";

/* When was this task last switched OUT (i.e. when did it stop running)? */
struct {
    __uint(type, BPF_MAP_TYPE_HASH);
    __uint(max_entries, 16384);
    __type(key, __u32);    /* tid */
    __type(value, __u64);  /* timestamp captured on switch-out */
} last_run SEC(".maps");

struct {
    __uint(type, BPF_MAP_TYPE_RINGBUF);
    __uint(max_entries, 256 * 1024);
} rb SEC(".maps");

SEC("tp_btf/sched_switch")
int BPF_PROG(on_switch, bool preempt, struct task_struct *prev, struct task_struct *next, unsigned int prev_state)
{
    __u64 now = bpf_ktime_get_ns();
    __u32 prev_tid = prev->pid;   /* live ptr deref! */
    __u32 next_tid = next->pid;

    /* Record when prev was scheduled out */
    bpf_map_update_elem(&last_run, &prev_tid, &now, BPF_ANY);

    /* How long was next waiting? */
    __u64 *t = bpf_map_lookup_elem(&last_run, &next_tid);
    if (!t)
        return 0;     /* first time we see next; no wait time */

    __u64 wait = now - *t;
    if (wait < 1000)
        return 0;     /* skip < 1µs noise */

    struct event *e = bpf_ringbuf_reserve(&rb, sizeof(*e), 0);
    if (!e) return 0;
    e->prev_pid = prev_tid;
    e->next_pid = next_tid;
    e->wait_ns = wait;
    /* Direct deref of comm[16] — array, not pointer */
    __builtin_memcpy(e->prev_comm, prev->comm, sizeof(e->prev_comm));
    __builtin_memcpy(e->next_comm, next->comm, sizeof(e->next_comm));
    bpf_ringbuf_submit(e, 0);
    return 0;
}
What’s new
SEC("tp_btf/sched_switch")— tp_btf attach. Args matchTP_PROTOofsched_switch. (prevandnextare the sametask_struct *the kernel passed totrace_sched_switchatcore.c:7186.)- Direct deref of
prev->pid,next->pid,prev->comm— works becauseprevandnextarePTR_TO_BTF_ID(live, typed kernel pointers).prev->pidreads the field atinclude/linux/sched.h:1063;prev->commreads the 16-byte array atinclude/linux/sched.h:1173. A regular tracepoint could read these too (they’re in the copied struct) — but only these. The win is that you could also readprev->mm,prev->cgroup, etc., none of whichTP_fast_assigncopied. - The pattern is more interesting than a single function tracer. We’re tracking every task. The map fills up to one entry per active TID and naturally bounds itself (active TIDs ≪ max_entries on most systems).
if (wait < 1000) return 0;— filter sub-µs noise. The kernel switches frequently enough that without filtering, you’d flood the ringbuf.- Remember what
wait_nsis. It’snow - last_run[next_tid]: the off-CPU gap between this task’s two consecutive on-CPU stints. A proxy for scheduling delay, not strict wakeup-to-run latency.
schedlat.c — userspace consumer
Same pattern. Print:
printf("%s [%u] waited %llu µs after %s [%u]\n",
       e->next_comm, e->next_pid, e->wait_ns / 1000,
       e->prev_comm, e->prev_pid);
Run
make
sudo ./schedlat 2>&1 | head -50
Expected: a stream of switches with wait times, e.g.:
firefox [4001] waited 152 µs after kworker/u8:2 [42]
chromium [5002] waited 89 µs after firefox [4001]
...
Spikes (> 1ms) often correlate with workload, lock contention, scheduler decisions worth investigating.
What to break, in order
Break 1 — Convert to regular tracepoint
SEC("tracepoint/sched/sched_switch")
int on_switch(struct trace_event_raw_sched_switch *ctx)
{
    __u32 prev_tid = ctx->prev_pid;
    __u32 next_tid = ctx->next_pid;
    /* ... no struct task_struct * available ... */
}
This compiles and works for prev_pid, next_pid, prev_comm, next_comm (all in the copied struct — the exact fields TP_STRUCT__entry declared and TP_fast_assign filled). But there’s no way to reach prev->real_parent, prev->cgroup, prev->mm, etc. — those live in the task_struct, and a regular tracepoint only hands you the copied event fields, not the live pointer. (And note: attaching this regular tracepoint/... program is what puts the TP_fast_assign copy probe on the iterator’s list — so now the per-event memcpy actually runs.)
For most tracers, tp_btf is more ergonomic. Reach for regular tracepoint/... only when:
- You explicitly want stability (the raw struct format won’t change).
- The kernel doesn’t have BTF (rare; pre-5.4).
- You want to be portable across BPF runtimes that lack BTF awareness.
Break 2 — Attach to a non-existent tracepoint
SEC("tp_btf/this_tracepoint_is_not_real")
Load fails:
libbpf: prog 'on_switch': failed to find kernel BTF type ID of 'this_tracepoint_is_not_real'
The tracepoint name is verified against kernel BTF. Typo-proof.
Break 3 — Wrong signature
SEC("tp_btf/sched_switch")
int BPF_PROG(p, struct task_struct *prev, struct task_struct *next)
{ /* missing 'bool preempt' first arg */ }
Loads, runs, but prev is actually bool preempt cast to a pointer — garbage. Direct deref segfaults the BPF program (Verifier kills the run).
The Verifier should catch this if you compile against the right BTF — but if it doesn’t, the symptom is “program loads but data is wrong.” Always check TP_PROTO.
Break 4 — Use BPF_CORE_READ when direct deref would do
__u32 next_tid = BPF_CORE_READ(next, pid); /* helper-call-based */
Works. Slower than direct deref (~50ns extra for the helper call). For trusted, well-typed pointers like next here, direct deref is preferred.
But: if next could be NULL or invalid, BPF_CORE_READ returns 0 instead of crashing. So for edges where you’re chasing a chain (next->mm->start_brk), prefer BPF_CORE_READ so any NULL hop is silently zero-handled.
What to read in the kernel
include/trace/events/sched.h— definitions of all sched/* tracepoints. SearchTRACE_EVENT(sched_switch(line 220). The macro expands into a lot of code, but the three parts that matter areTP_PROTO(line 222, your tp_btf args),TP_STRUCT__entry(line 229, theformat/copied-struct layout), andTP_fast_assign(line 239, the copy code — note thememcpyat line 240).include/linux/tracepoint.h— the macro machinery. Skim. Note__DECLARE_TRACEand__DECLARE_TRACE_COMMON(the helperTRACE_EVENTexpands through), the generated__traceiter_##name(line 267), and how the firing site reaches it via__DO_TRACE_CALL(lines 227/231: astatic_callwhenCONFIG_HAVE_STATIC_CALL, else a plain indirect call).kernel/tracepoint.c— what happens when a tracepoint fires. The generated__traceiter_<event>iterator walks the registered probe list.kernel/trace/bpf_trace.c— searchbpf_get_raw_tracepoint(line 2051). This is how BPF programs attach to raw tracepoints; the per-event dispatch into your program is__bpf_trace_run(line 2073).tp_btfgoes through the same raw-tracepoint path (BPF_TRACE_RAW_TP,kernel/bpf/syscall.c:4388): the link is set up viabpf_raw_tracepoint_open/bpf_get_raw_tracepoint, just with BTF-typed arguments.kernel/sched/core.c— the scheduler core. See__schedule(line 7017),context_switch(line 5329), and the tracepoint firing sitetrace_sched_switch(preempt, prev, next, prev_state)(line 7186) — the source of everything today’s lab measures.tools/testing/selftests/bpf/progs/cgrp_ls_tp_btf.c— official examples using tp_btf.
Bullet Points
- A CPU runs one task at a time; runnable-but-waiting tasks sit on a per-CPU run queue. A context switch (
context_switch,core.c:5329) savesprevand loadsnext;__schedule(core.c:7017) drives every switch and firessched_switch(core.c:7186) withprev/nextalready chosen. - Today’s
wait_nsis off-CPU time between a task’s two runs (now - last_run[next_tid]) — a proxy for scheduling delay, not strict wakeup-to-run latency (that needssched_wakeup). - A
TRACE_EVENThas three parts:TP_PROTO(your tp_btf/raw args),TP_STRUCT__entry(theformatfile + copied struct), andTP_fast_assign(the memcpy that fills the copy). A regular tracepoint can only see whatTP_fast_assigncopied — which is why it can’t reachprev->mm. - A firing tracepoint runs
__traceiter_<event>, which walks a probe list and calls each listener with the rawTP_PROTOargs — no copy at this layer. The struct copy is one optional probe, present only when atracepoint//ftrace/perf listener attaches — that’s why the cost is bounded. - Tracepoints are explicit instrumentation hooks placed by kernel devs; their format is stable across versions.
- Tracepoint events have three BPF section families:
tracepoint/...(copied struct),raw_tracepoint/...(raw positional args), andtp_btf/...(typed BTF args). BPF raw and tp_btf share the path throughbpf_get_raw_tracepoint/__bpf_trace_run(BPF_TRACE_RAW_TP); tp_btf just adds BTF types. - Use tp_btf for new code. Same hook, lower overhead (no copy, no tracefs lookup), full field access via direct deref.
- The
TP_PROTO(...)of a tracepoint defines your tp_btf BPF program’s argument list. - Discover tracepoints in
/sys/kernel/tracing/events/. - Common families:
sched/*,block/*,net/*,syscalls/*,kmem/*,filemap/*. - Prefer fentry over
tracepoint/syscalls/sys_enter_xxx(faster on the syscall path). - Direct deref works on tp_btf args;
BPF_CORE_READfor chains where any hop could be NULL.
Check question
You attach a tp_btf to sched_switch. Inside your program, you save prev (a task_struct *) into a hash map for use later. Will dereferencing it later still work?
Click to reveal answer
Answer: No. The pointer was trusted during the tracepoint callback because the kernel handed it to you with a guarantee that the task is alive for the duration of the callback. Once the callback returns, that guarantee is gone — the task may be freed. Storing the raw pointer for later use is a use-after-free risk and the Verifier rejects it. To save a reference safely, you’d use bpf_task_acquire (a kfunc — Day 20) which atomically takes a refcount, then bpf_task_release later. Or, simpler: store fields (pid, comm) rather than the pointer.
Tomorrow
Day 9: stack traces. BPF_MAP_TYPE_STACK_TRACE, bpf_get_stackid, kernel vs user stacks, and how to fold output for flame graphs.