Day 9 — Stack traces and the path to flame graphs
Today’s mission: capture the kernel call stack at every
vfs_read, aggregate by unique stack, and produce data ready for a flame graph. Along the way you’ll learn what a native call stack actually is, how the kernel unwinds it without frame pointers, and why turning a raw return address back into a function name is a userspace job split across/proc/kallsyms,/proc/PID/maps, and a pile of base arithmetic. Total time: ~120 minutes.
Why stack traces matter
Counters tell you “this happened 1000 times.” Stack traces tell you who caused it. Combined with rate aggregation, they reveal hotspots — which user code, through which kernel paths, accounts for the bulk of an event’s occurrences.
This is how perf top, bpftrace, and most profiling tools work under the hood. By Day’s end you’ll know how to write your own.
But “capture the stack” hides four things that will bite you the moment you look at the raw output, and most of today is about making them obvious:
- What a native call stack even is — and how the kernel walks it backwards (the thing
bpf_get_stackiddoes for you). - What the syscall-entry frames are — why every
read()shares an identical base of kernel frames. - How a raw kernel return address becomes a function name —
/proc/kallsyms, and why an exact match almost never works. - How a raw user return address becomes a function name — ASLR, load bases, and
addr2line.
We’ll teach each as we hit the part of the lab that needs it.
First: what is a call stack, and how do you walk it backwards?
Before we touch any BPF, we have to be precise about the thing we’re capturing. When one function calls another on x86_64, the CALL instruction does one concrete thing: it pushes the return address — the address of the instruction right after the call — onto the stack, then jumps. When the callee runs RET, it pops that address and resumes there. So at any instant, the stack contains a chain of return addresses: one per function currently in flight, innermost (the leaf, where the CPU is right now) at the top.
Unwinding = recovering that ordered list of return addresses, leaf-first. That list is the stack trace. Unwinding produces exactly this — an array of return addresses (the internal trace->ip[]), innermost first; bpf_get_stackid hashes that array, stores it, and returns a stackid (see below).
Don’t confuse this with the BPF stack from Day 1/4. Day 1 taught the BPF program’s own 512-byte stack addressed through register
R10— that’s scratch space the verifier polices for your eBPF code. Today’s call stack is the CPU’s native kernel/user stack: the real x86 stack of return addresses laid down byCALLinstructions in compiled kernel and userspace code. Different stack, different purpose.bpf_get_stackidwalks the native one.
So how do you walk it backwards? You have a stack pointer and you know the top frame’s instruction pointer — but the stack is just bytes. Where does one frame end and the next begin? There are two answers.
Frame-pointer unwinding (the simple way)
With -fno-omit-frame-pointer, the compiler dedicates register %rbp to point at a known spot in the current frame: the saved-%rbp/return-address pair. Each function’s prologue pushes the caller’s %rbp and sets %rbp to the new frame. The result is a linked list: %rbp points at [saved %rbp | return addr], and the saved %rbp points at the previous frame’s pair, and so on. A walker just follows the chain, reading a return address out of each node.
Cheap and simple — but it costs a general-purpose register (%rbp can’t be used for anything else), so for years amd64 distros compiled everything with -fomit-frame-pointer to claw that register back. That single decision is why user-stack walks fail on older binaries: there’s no %rbp chain to follow.
ORC unwinding (how the x86_64 kernel does it)
The kernel can’t afford to lose %rbp, yet it still needs reliable stacks. The fix: an out-of-band table built at compile time. The kernel image ships two arrays — __start_orc_unwind_ip[] / __start_orc_unwind[] (declared extern at arch/x86/kernel/unwind_orc.c:30) — that, keyed by any instruction pointer, describe how to find the previous frame without a frame pointer: “at this IP, the stack pointer is at such-and-such offset, the return address lives there.” orc_find() (unwind_orc.c:209) does the per-IP lookup, and unwind_get_return_address() (unwind_orc.c:380) produces each frame. The common frame type it resolves is ORC_TYPE_CALL (the case ORC_TYPE_CALL in the unwind step, unwind_orc.c:611).
This is why kernel stacks “always work” while user stacks need frame pointers: the kernel carries its own unwind table; userspace binaries don’t (their equivalent, DWARF .eh_frame, is too expensive for the kernel to parse from a BPF context — more on that below).
Both methods produce the same result: the ordered trace->ip[] array of return addresses, which bpf_get_stackid hashes. The captured array lands in a struct perf_callchain_entry { u64 nr; u64 ip[]; } (include/linux/perf_event.h:59) — nr frames, then the IPs.
![Frame-pointer and ORC unwinding both produce the same trace->ip[] array](diagrams/day09_callstack_unwind.png)
One subtlety that haunts symbolization
Look again at what CALL pushes: the address of the instruction after the call. So every captured frame (except the leaf) is a return address that points into the middle of a function, one instruction past a call site — never at the function’s start. Hold that thought; it’s the root cause of the kallsyms “nearest-preceding-symbol” trick we hit later.
Meet BPF_MAP_TYPE_STACK_TRACE
A purpose-built map type. You don’t store key/value pairs in it directly — you call bpf_get_stackid(ctx, &stacks, flags) and the kernel:
- Walks the current stack (frame pointers or ORC, per the section above).
- Hashes the frame array into a 32-bit
stackid. - Stores the frames keyed by
stackid(deduplicated — same stack → same id). - Returns
stackidto your program.
You then use stackid as a key in a normal map (e.g., a hash map of stackid → count) to aggregate. The helper itself is BPF_CALL_3(bpf_get_stackid, ...) at kernel/bpf/stackmap.c:323; it deliberately returns unsymbolized frames — turning addresses into names is a userspace concern (we’ll see exactly why below).
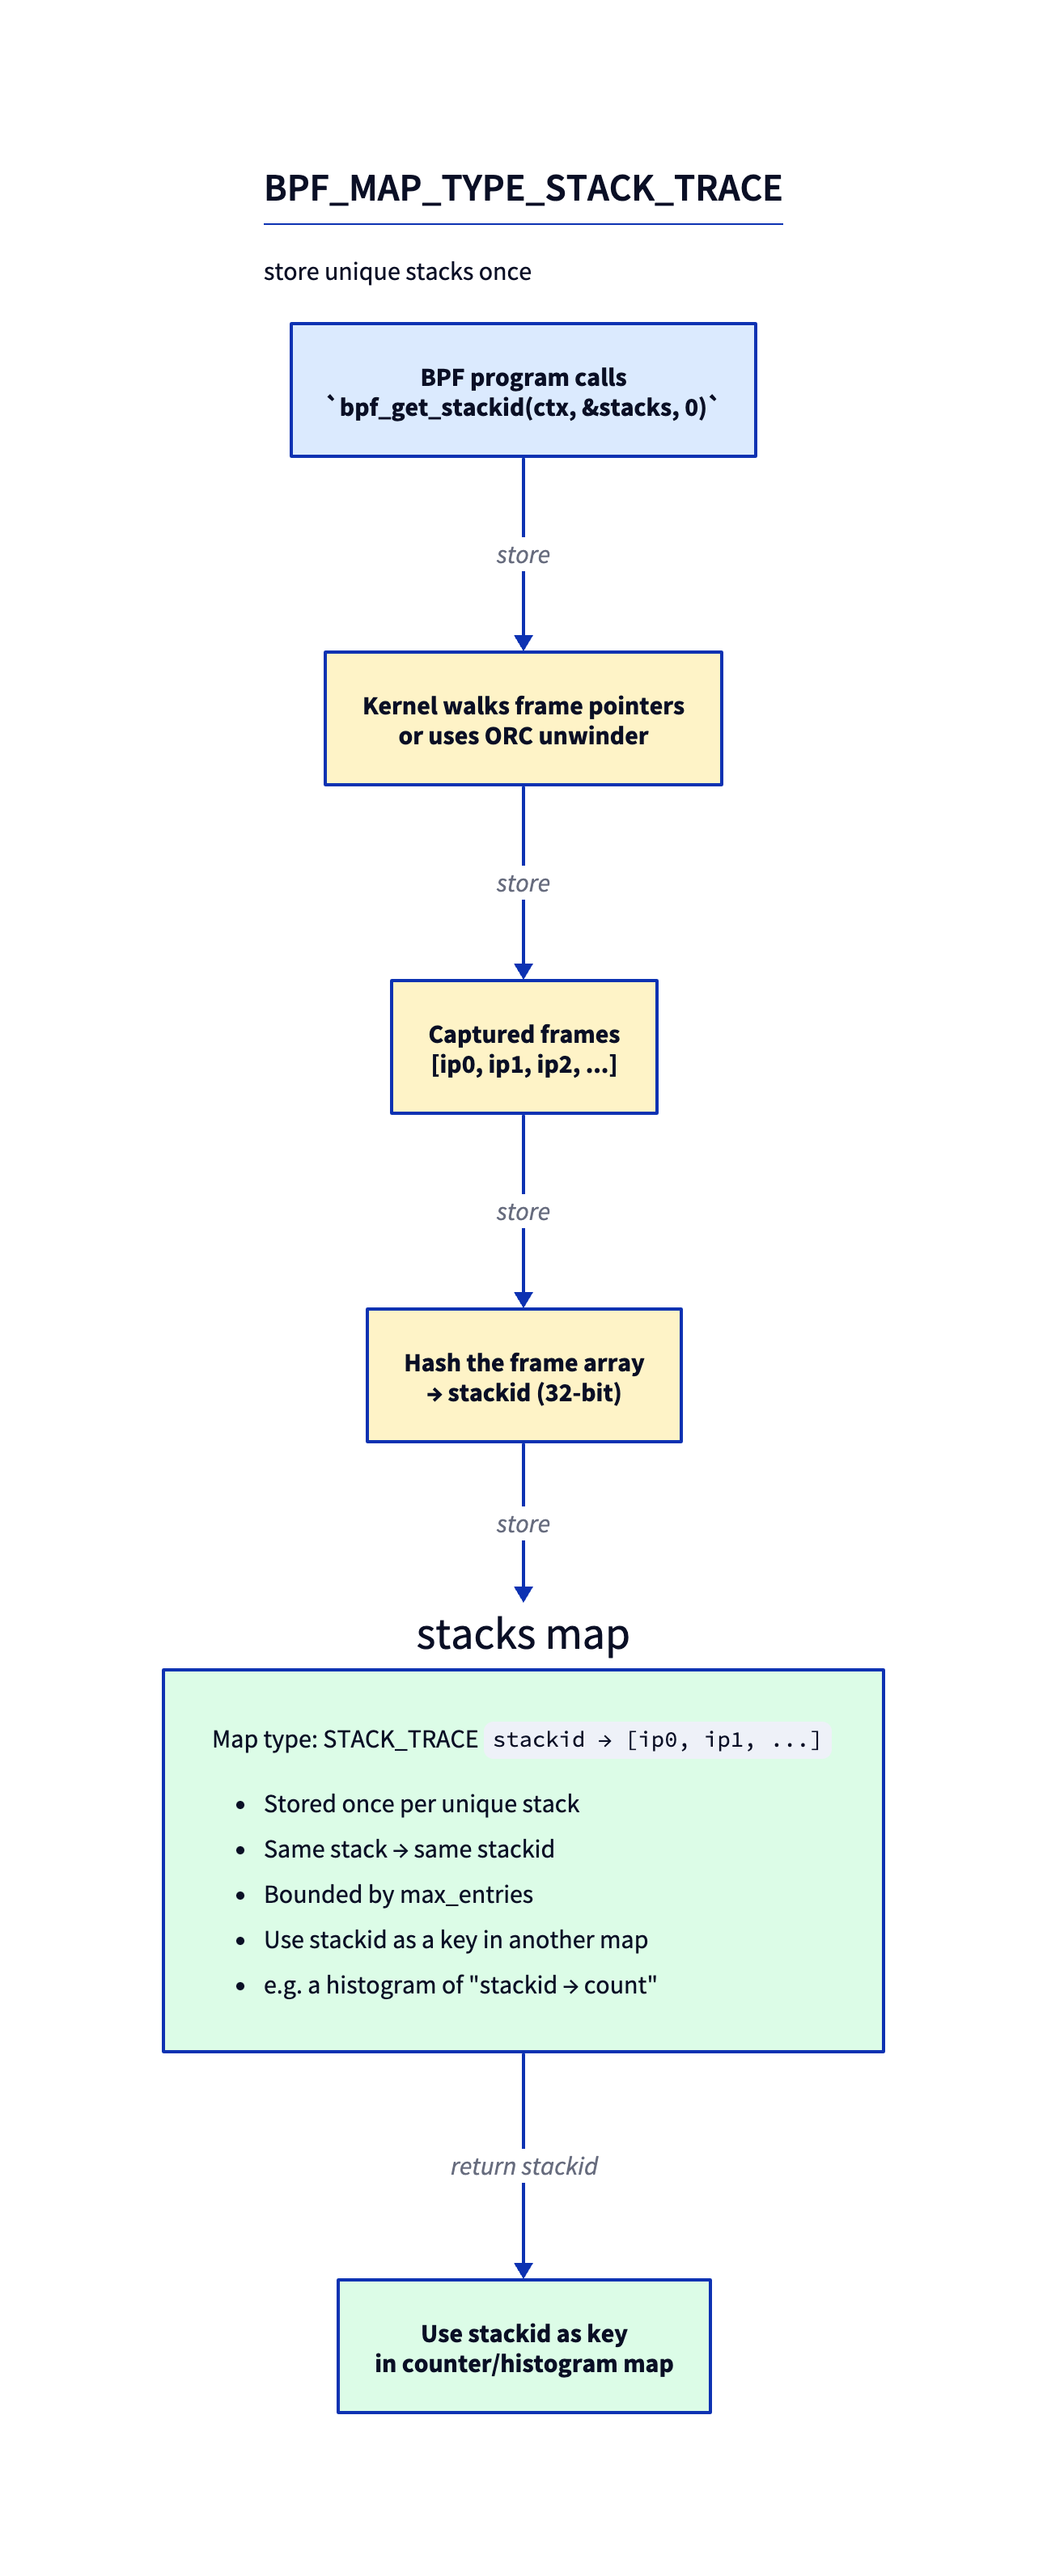
The dedup matters: if 10 million events all happen with the same stack, you store the frame array once and count it 10 million times against one stackid. Memory is bounded by the number of unique stacks, not events.
Kernel stack vs user stack
The flag argument to bpf_get_stackid (and its sibling bpf_get_stack) decides which stack you walk:
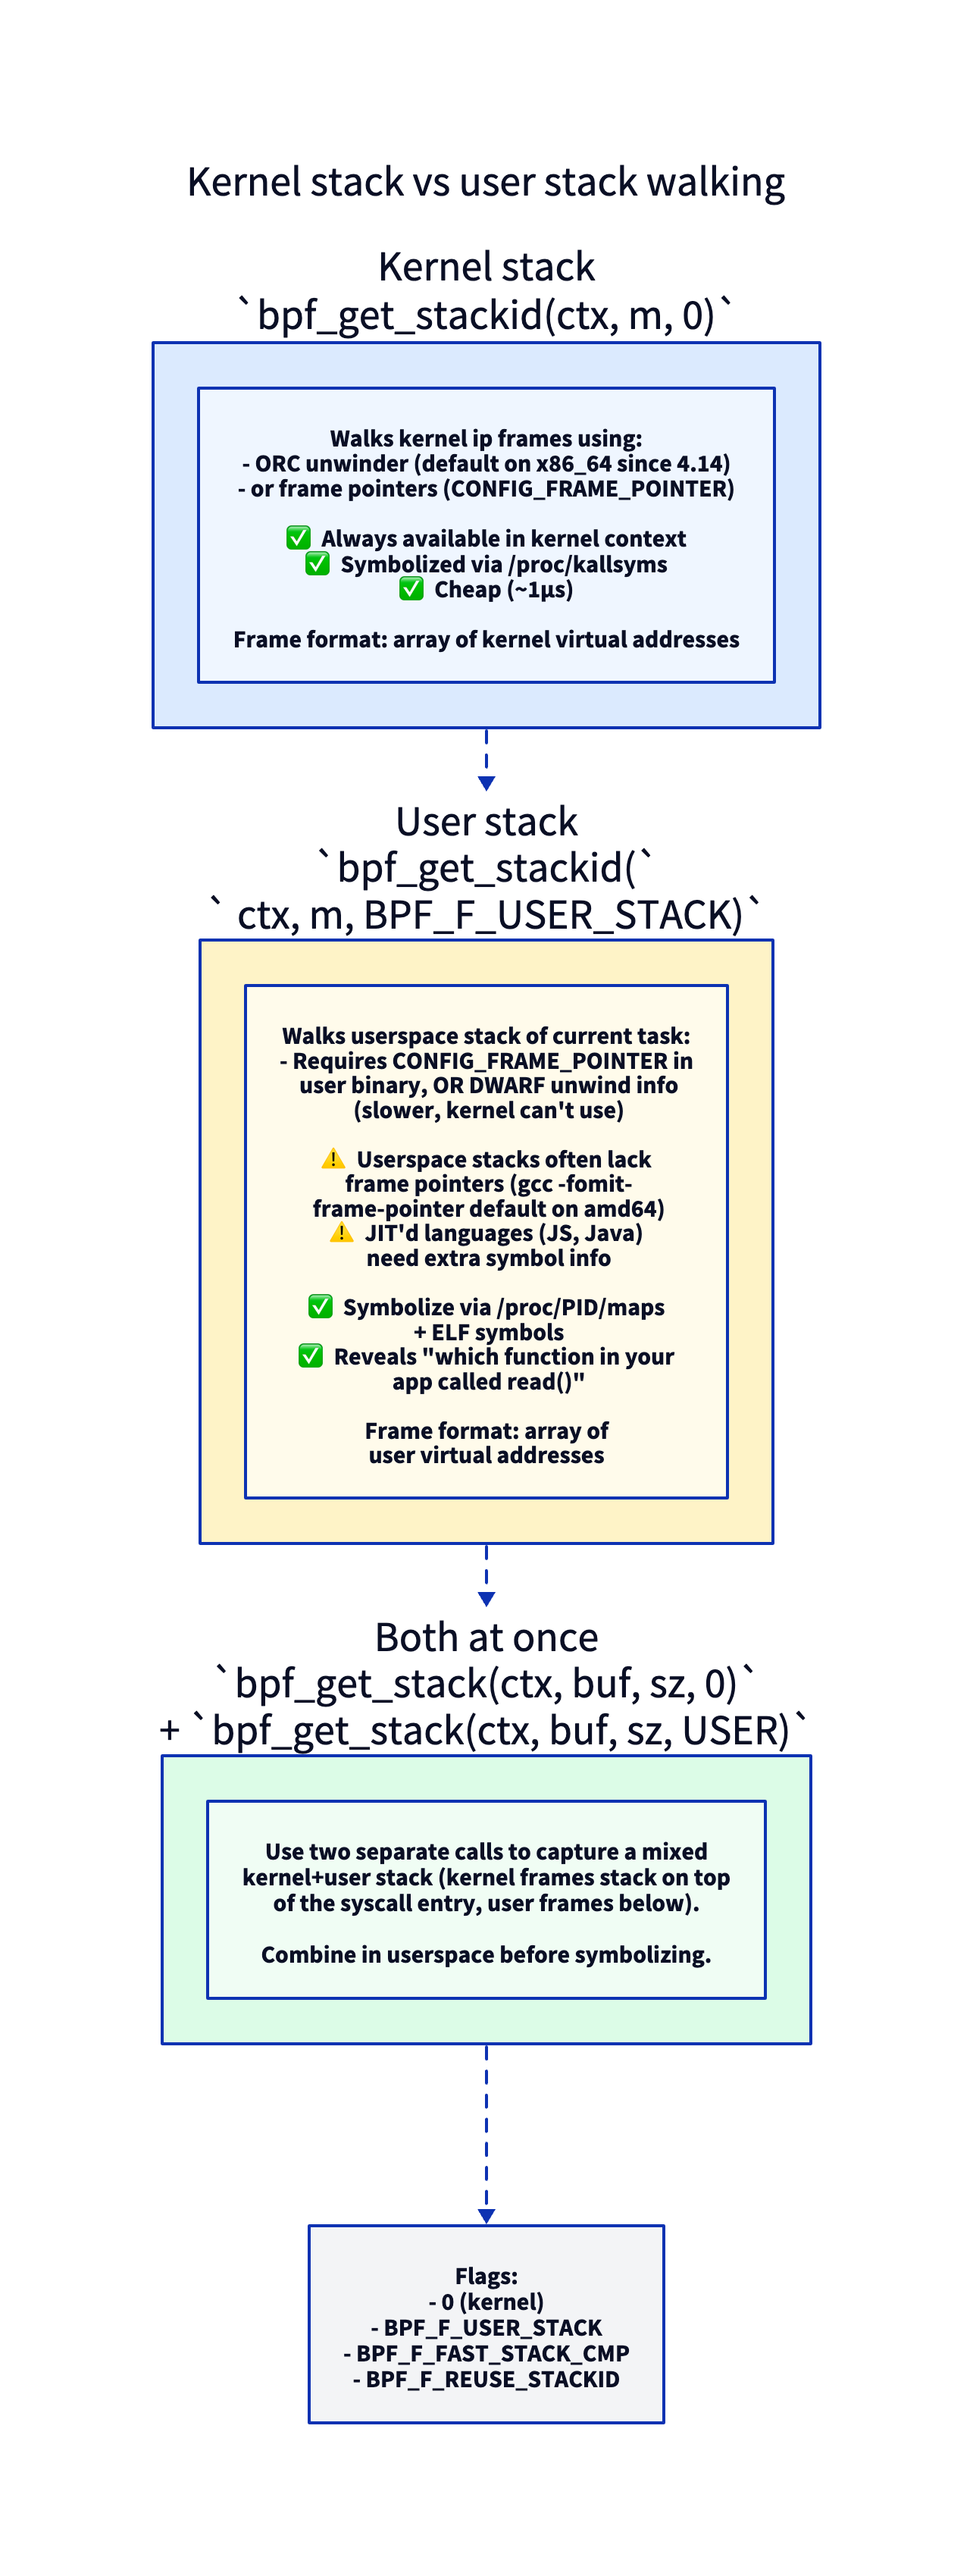
- Default (flag=0): kernel stack. Walked via the ORC unwinder on x86_64 (default since 4.14) or frame pointers — the two mechanisms from the section above. Always works in any tracing context, because the kernel ships its own ORC table.
BPF_F_USER_STACK: userspace stack of the current task. Works only if the user binary was compiled with frame pointers. The DWARF unwind info (.eh_frame) that would otherwise rescue a frame-pointer-omitted binary is too expensive for the kernel to parse from BPF context, so the kernel can’t unwind userspace from DWARF — no frame pointers, no user stack. Modern Linux distributions started building-fno-omit-frame-pointerby default starting with Fedora 38 in 2023, and Ubuntu 24.04 in 2024, to make this useful again.BPF_F_FAST_STACK_CMP: hash-only comparison (faster, no full frame walk for dedup).BPF_F_REUSE_STACKID: allow stackid reuse across capture sessions.
To get a combined kernel+user stack, you call bpf_get_stack twice (not bpf_get_stackid) — once with each flag — and combine in userspace before symbolizing.
There are no Dumb Questions
Q: How accurate are kernel stacks?
A: Very, in 99% of cases. The ORC unwinder is precise. Edge cases: in-flight kprobes that occur during function prologue/epilogue may produce off-by-one frames. Highly optimized leaf functions can be tail-called and not appear in the stack at all. For most tracing this is fine.
Q: Why doesn’t user stack walking “just work” like the kernel side?
A: Userspace binaries on amd64 have been compiled with
-fomit-frame-pointerfor years (default in distros until Fedora 38 in 2023 and Ubuntu 24.04 in 2024 reversed it). Without frame pointers, walking back through stack frames requires DWARF unwind info (.eh_frame) — which is expensive and the kernel can’t process. Modern distros are reversing course (Fedora, Ubuntu now ship frame-pointer-enabled libc and friends), but legacy binaries lack the metadata.Q: How do I symbolize JIT’d languages (Java, Node.js)?
A: They expose runtime symbol files.
perf-PID.mapis a text file in/tmpmapping JIT addresses to function names. JIT runtimes (HotSpot, V8) generate these. Your userspace symbolizer reads them alongside ELF tables.
What the syscall-entry frames actually are
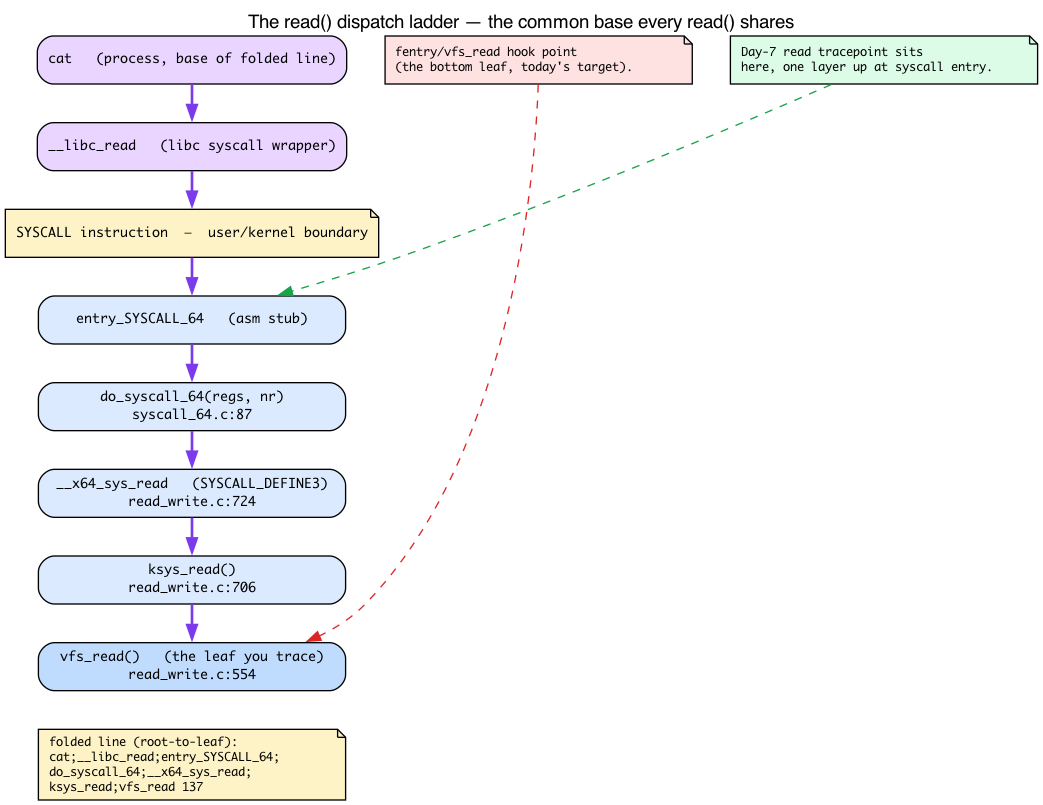
The exercise below leans on a specific 5-frame kernel chain for cat /etc/passwd, and the flame graph later calls the wide base “the common syscall-entry frames.” On Day 7 you saw that the read tracepoint sits one layer up at syscall entry while fentry/vfs_read hooks the bottom — but not the rungs between those two points. Here’s the full ladder — you don’t need to re-derive the syscall mechanism, just see the rungs.
A read() does not jump straight into vfs_read. On x86_64 it traverses a fixed dispatch ladder:
- The hardware
SYSCALLinstruction lands at the assembly stubentry_SYSCALL_64. - That calls the C dispatcher
do_syscall_64(regs, nr)(arch/x86/entry/syscall_64.c:87). - Which dispatches through the syscall table to
__x64_sys_read— the arch wrapper thatSYSCALL_DEFINE3(read, ...)(fs/read_write.c:724) expands to. - Which calls the thin
ksys_read()(fs/read_write.c:706). - Which finally calls
vfs_read()(fs/read_write.c:554) — the leaf you’re tracing.
This is why every sample shares a wide common base in the flame graph: every read() on the box enters through the identical entry_SYSCALL_64 → do_syscall_64 prefix; only the leaf paths diverge. It also fixes the leaf ordering in a folded line: process (cat) at the base, then the entry frames, with vfs_read — the function you traced — on top.
Sharpen your pencil
You write a tracer that captures kernel + user stacks for every
vfs_read. Your test workload iscat /etc/passwdfrom bash. Roughly how many uniquestackidvalues do you expect?.
.
.Answer: A small handful.
cat’s call toread()always traverses roughly the same userspace path (libcreadwrapper → syscall instruction). Bash’scatinvocation similarly goes through the same path. The kernel side is also stable:entry_SYSCALL_64→do_syscall_64→__x64_sys_read→ksys_read→vfs_read. Maybe 1–3 unique stacks total. Now run on a complex workload (Firefox loading a page) and you’ll see hundreds — that’s the dedup paying off.
How deep can a stack go? The hard 127-frame cap
Before you size the map, know the ceiling. When you create a BPF_MAP_TYPE_STACK_TRACE map, the kernel requires value_size / 8 (8 bytes per u64 frame) to be <= sysctl_perf_event_max_stack up front. So asking for 256 frames does not silently clamp — map creation is rejected with -EINVAL (stack_map_alloc, stackmap.c:113). value_size / 8 must be <= sysctl_perf_event_max_stack at creation time.
PERF_MAX_STACK_DEPTHis 127 by default (include/uapi/linux/perf_event.h:1285), andint sysctl_perf_event_max_stack = PERF_MAX_STACK_DEPTH;(kernel/events/callchain.c:23). The runtime knob is/proc/sys/kernel/perf_event_max_stack(registered atcallchain.c:306). It’s shared with the perf subsystem becausebpf_get_stackidreuses perf’s callchain machinery.stack_map_calculate_max_depth()(kernel/bpf/stackmap.c:53) computes the runtime depth fromvalue_size / elem_sizeand reconciles it with the sysctl:if (max_depth > curr_sysctl_max_stack) return curr_sysctl_max_stack;. This runtime clamp only matters when the sysctl is lowered after the map was created (or for theBPF_F_SKIP_FIELDadjustment) — not as a creation-time ceiling. The creation-time gate is separate:stack_map_allocoutright rejects a map whosevalue_size / 8 > sysctl_perf_event_max_stackwith-EINVAL(stackmap.c:113–114).
Practical consequence: the lab’s MAX_STACK_DEPTH = 64 is comfortably under the cap. Choosing 64 vs 127 trades memory-per-unique-stack against truncation risk on deep stacks. Going above 127 buys nothing unless you also raise the sysctl.
The end-to-end flame graph pipeline

Capture in BPF, aggregate by stackid, read in userspace, symbolize each frame, fold into the textual format flamegraph.pl expects:
thread_or_pid;fn1;fn2;fn3;fn4 1234
Then pipe through flamegraph.pl (Brendan Gregg’s tool) or upload to speedscope.app.
The lab
stacks.bpf.c
#include "vmlinux.h"
#include <bpf/bpf_helpers.h>
#include <bpf/bpf_tracing.h>

char LICENSE[] SEC("license") = "GPL";

#define MAX_STACK_DEPTH 64

struct {
    __uint(type, BPF_MAP_TYPE_STACK_TRACE);
    __uint(max_entries, 16384);
    __uint(key_size, sizeof(__u32));
    __uint(value_size, MAX_STACK_DEPTH * sizeof(__u64));
} stacks SEC(".maps");

struct {
    __uint(type, BPF_MAP_TYPE_HASH);
    __uint(max_entries, 16384);
    __type(key, __u64);     /* (kstack_id << 32) | ustack_id */
    __type(value, __u64);   /* count */
} counts SEC(".maps");

SEC("fentry/vfs_read")
int BPF_PROG(on_read)
{
    __s64 kid = bpf_get_stackid(ctx, &stacks, 0);
    __s64 uid = bpf_get_stackid(ctx, &stacks, BPF_F_USER_STACK);

    /* Negative return = failure to capture (returns a negative errno:
       -EFAULT/-EEXIST/-ENOMEM, e.g., user stack with no frame ptrs). */
    if (kid < 0 && uid < 0)
        return 0;

    __u64 key = ((__u64)(kid & 0xffffffff) << 32) | (uid & 0xffffffff);
    __u64 *c = bpf_map_lookup_elem(&counts, &key);
    if (c) {
        __sync_fetch_and_add(c, 1);
    } else {
        __u64 one = 1;
        bpf_map_update_elem(&counts, &key, &one, BPF_NOEXIST);
    }
    return 0;
}
What’s new (and what’s recycled)
- The attach is old news.
SEC("fentry/vfs_read")is the same BTF-typed entry trampoline onvfs_readyou used on Day 6, andBPF_PROG(on_read)is the argument-unpacking macro demystified on Day 7. Nothing new in how we attach —vfs_read(fs/read_write.c:554) is the identical target from the Day 6 lab. Today’s novelty is entirely inside the handler. - Two
bpf_get_stackidcalls — one kernel (flag 0), one user (BPF_F_USER_STACK). - Negative return checks. The helpers return a negative errno (-EFAULT/-EEXIST/-ENOMEM) on failure (e.g., user-stack walk hit a missing frame pointer, or the stack map slot was already taken by a different stack).
- Composite key: pack both stackids into one
u64so identical (kernel, user) pairs share a counter. This(kid << 32) | uidpacking is the only genuinely new twist here — two stackids collapsed into one hash-map key. - The counter logic is pure Day 2. Recall from Day 2: a hash-map lookup hands back an unlocked live pointer, so the concurrent increment must be
__sync_fetch_and_add; and theBPF_NOEXISTinsert can lose a racing increment (a cosmetic miss). Samecount.cpattern, same check question — no need to re-derive it.
stacks.c — userspace dumper + symbolizer
Outline (you can use blazesym or write a minimal kallsyms parser). The iteration loop is the same userspace bpf_map_get_next_key walk from Day 2 — one key per call, the loop lives in userspace:
/* every 5s, dump top stacks by count: */
while (!exiting) {
    sleep(5);

    /* iterate counts map */
    __u64 key = 0, next;
    __u64 val;
    int cnt_fd = bpf_map__fd(skel->maps.counts);
    int stk_fd = bpf_map__fd(skel->maps.stacks);

    while (bpf_map_get_next_key(cnt_fd, &key, &next) == 0) {
        bpf_map_lookup_elem(cnt_fd, &next, &val);
        __u32 kid = next >> 32, uid = next & 0xffffffff;

        __u64 kframes[64] = {0}, uframes[64] = {0};
        bpf_map_lookup_elem(stk_fd, &kid, kframes);
        bpf_map_lookup_elem(stk_fd, &uid, uframes);

        /* Print folded: stack;...; count */
        printf("[count=%llu]\n", val);
        for (int i = 0; i < 64 && kframes[i]; i++)
            printf("  K %llx\n", kframes[i]);
        for (int i = 0; i < 64 && uframes[i]; i++)
            printf("  U %llx\n", uframes[i]);
        printf("\n");

        key = next;
    }
}
For real symbolization, link against libblazesym (modern, fast) or write a kallsyms parser. We won’t write one today — Day 9 is about capturing the data; symbolization is plumbing. But you should understand what that plumbing does, because the next two sections walk it by hand.
Run it
make
sudo ./stacks &        # job %1; prints a dump every 5s
# Generate work, then wait for the next 5-second dump to see it:
find /usr -name "*.so" > /dev/null
cat /etc/passwd > /dev/null
sleep 5
Output is interval-driven — nothing prints until the next 5-second tick. When you’re done, stop the background dumper (otherwise it keeps printing as root forever):
kill %1 # or: sudo pkill stacks
You’ll see frames printed as raw hex (K <addr> / U <addr>). Those are the raw return addresses from trace->ip[] — exactly the values the section on call stacks promised. Resolving them by hand is fiddly, and the two halves (kernel vs user) work completely differently. Let’s do each by hand once; that’s the whole reason bpftool/libblazesym exist.
Symbolizing kernel frames: /proc/kallsyms
A running kernel has no ELF symbol table the way a binary on disk does — the image is loaded and relocated. Instead the kernel exposes its runtime symbol table at /proc/kallsyms: one line per symbol, address type name, e.g. ffffffff... T vfs_read. A userspace symbolizer turns a kernel return address into a name by looking it up here. Two gotchas:
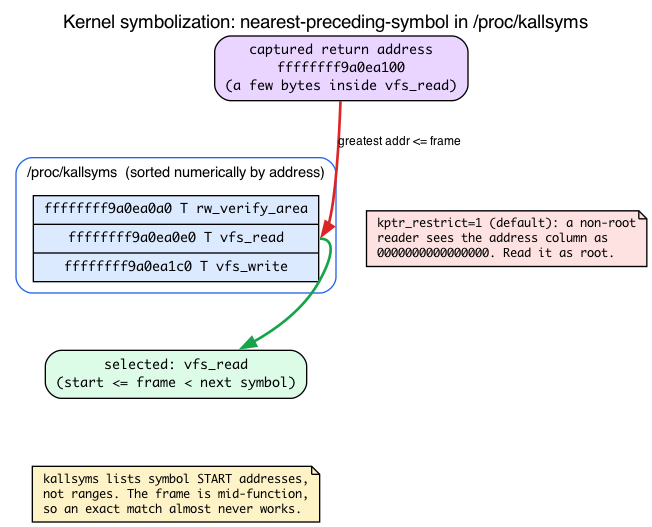
kptr_restrictzeros the addresses for non-root. This sysctl governs visibility; at the default value1, an unprivileged reader sees every address as0000000000000000. Grep as a normal user and you find zeros. You must read it as root. (It’s a hardening measure: leaking kernel addresses defeats KASLR.)- kallsyms lists symbol start addresses, not ranges — and isn’t address-sorted on disk. Recall the subtlety from the call-stack section: a captured frame is a return address in the middle of a function, never at its start. So an exact match almost never succeeds. The fix is nearest-preceding-symbol: sort lexicographically (which equals numeric order for the fixed-width 16-hex-digit kernel addresses), then take the greatest symbol address
<=your frame address.
# ADDR is one of the K <addr> values, e.g. ffffffff9a0ea100
sudo sort /proc/kallsyms | awk -v a=ADDR '$1 <= a {s=$0} END {print s}'
# ffffffff9a0ea0e0 T vfs_read
The frame address (ffffffff9a0ea100) is greater than vfs_read’s start (ffffffff9a0ea0e0) and less than the next symbol’s start, so it resolves to vfs_read — a return address a few bytes inside it. This is precisely the lookup bpftool/libblazesym automate.
Symbolizing user frames: load bases and ASLR
Kernel frames live in one address space; user frames are runtime virtual addresses inside the traced process, and that’s where it gets harder. addr2line and a binary’s ELF symbol table speak in file offsets — the link-time addresses baked into the .so/executable. The captured frame is a runtime address. The two differ by the load base:
file_offset = runtime_addr - load_base
Why isn’t load_base just zero? Because Position-Independent Executables (PIE) and all shared libraries (libc, etc.) are mapped at a randomized base each run — that’s ASLR. To recover the file offset you must subtract the base, and the base is the lowest mapped address of that object’s executable segment, found in the left column of the matching line of /proc/PID/maps.
# A is a U <addr> runtime value; PID is the traced process.
# Find B = the base of the object that contains A:
sudo grep -i 'r-xp' /proc/PID/maps      # locate the segment whose range covers A; B is its start
addr2line -f -e /path/to/object $((A - B))
The base subtraction is mandatory for PIE executables and shared libraries. The one exception: a classic non-PIE ET_EXEC is linked at a fixed address (its main text base is effectively 0), so you pass the runtime address straight to addr2line — which is the carve-out you’ll see in tools. Two beginner traps produce ??:0: forgetting -e <object> (wrong object) and forgetting the subtraction (wrong base). This per-object bookkeeping across many mapped libraries is the bulk of what libblazesym/bpftool do for you.
(There’s a robustness escape hatch: BPF_F_USER_BUILD_ID (include/uapi/linux/bpf.h:6174) captures a build-id + offset instead of a bare address, so offline symbolization survives ASLR and even a different machine. We won’t use it today, but it’s why that mode exists.)
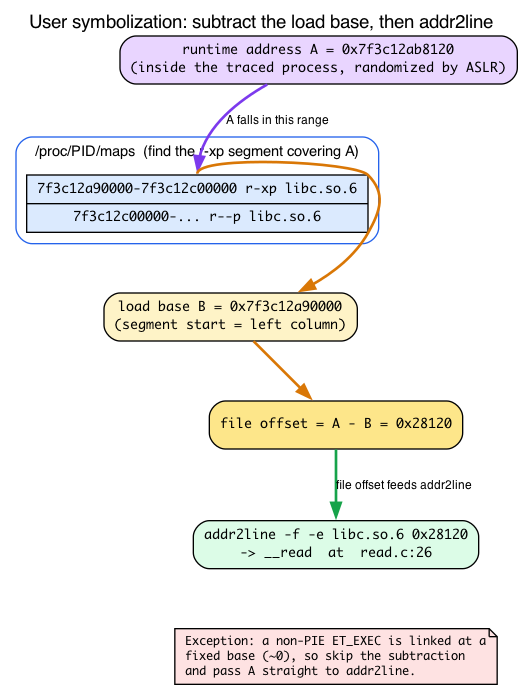
This hand-resolution — kallsyms nearest-preceding for kernel, base-subtract-then-addr2line for user — is exactly the plumbing libblazesym / bpftool automate, which is why we deferred symbolization in the lab.
Pipe to a flame graph
Get flamegraph.pl once (it isn’t packaged on any distro — grab it from Brendan Gregg’s repo):
git clone https://github.com/brendangregg/FlameGraph
export PATH="$PATH:$PWD/FlameGraph"
Then:
sudo ./stacks --folded > out.folded
flamegraph.pl < out.folded > out.svg
# Open out.svg in any browser. On a headless box, copy it to your laptop,
# or just drag out.folded onto https://speedscope.app (no local browser needed).
# firefox out.svg   # only if you actually have a desktop browser
--folded is required reader work — the lab’s stacks.c only prints the %llx debug dump above. You need to parse argv, symbolize each frame (using the kallsyms and addr2line mechanics you just learned), and emit one line per unique stack in root-to-leaf order (process at the base, leaf on top), with the count last. Building on the loop above, that’s roughly:
printf("%s", comm);                       /* process name at the base */
for (int i = u_n - 1; i >= 0; i--)        /* user frames, outermost first */
    printf(";%s", sym_user(uframes[i]));
for (int i = k_n - 1; i >= 0; i--)        /* then kernel frames */
    printf(";%s", sym_kernel(kframes[i]));
printf(" %llu\n", val);                   /* count */
A correct folded line for the cat /etc/passwd workload looks like this — the same kernel ladder from the Sharpen-your-pencil answer, leaf (vfs_read) on top:
cat;__libc_read;entry_SYSCALL_64;do_syscall_64;__x64_sys_read;ksys_read;vfs_read 137
In the resulting SVG: the wide base is the common process / syscall-entry frames shared by every sample, narrow towers are the divergent call paths, each frame’s width is proportional to its count, and vfs_read sits near the top of every tower (it’s the function you traced).
What to break, in order
Break 1 — Stack walk failure on BPF_F_USER_STACK
If your binary has frame-pointer-omitted libraries (most older distros), you’ll see uid < 0 for many calls — there’s no %rbp chain to follow and no DWARF the kernel can use, exactly as the unwinding section predicted. Workaround: trace fentry of a userspace-heavy function in a frame-pointer-enabled binary. Or, on Fedora/Ubuntu 24+, modern libc has frame pointers and user stacks resolve.
To debug, check bpf_get_stackid’s return value directly: the program already guards on uid < 0 (lines __s64 uid = ...; if (kid < 0 && uid < 0)), and that negative value is the errno explaining the failed user-stack walk. bpftool prog tracelog is empty by default here — this lab emits nothing to the trace pipe — so to use it you must add a printk on the failure path, e.g. in on_read:
if (uid < 0)
    bpf_printk("user-stack walk failed: uid=%lld\n", uid);
Then watch sudo bpftool prog tracelog (or sudo cat /sys/kernel/debug/tracing/trace_pipe) to see the negative errno fire when a frame-pointer-omitted library breaks the walk.
Break 2 — Forgetting MAX_STACK_DEPTH
Set value_size too small (16 * sizeof(__u64)). Stacks deeper than 16 frames get truncated. You’ll see plausible-looking but incomplete stacks. Default to 64 unless you have a reason to be smaller — and remember from the cap section that going above 127 buys nothing without raising perf_event_max_stack.
Break 3 — Use bpf_get_stack instead of bpf_get_stackid
__u64 frames[64];
int n = bpf_get_stack(ctx, frames, sizeof(frames), 0);
This copies frames directly into a buffer you provide (BPF_CALL_4(bpf_get_stack, ...) at kernel/bpf/stackmap.c:514) instead of going through the dedup map. Useful when you’re emitting one stack per event (e.g., to a ringbuf) rather than aggregating. Trade: more memory traffic, no dedup; but you have the frames immediately without a second map lookup.
Break 4 — Increase stack rate, fill the map
Trace a high-rate event like tcp_recvmsg on a busy server. With many unique stacks, you’ll fill max_entries=16384. When a new stack hashes to a slot already holding a different stack, bpf_get_stackid returns -EEXIST and the new stack is dropped — that’s the if (bucket && !(flags & BPF_F_REUSE_STACKID)) return -EEXIST; branch at stackmap.c:298 (build-id path) / :305 (normal path). So genuinely new stacks are silently lost. Pass BPF_F_REUSE_STACKID and the behavior flips: the occupied slot is overwritten instead (the xchg(&smap->buckets[id], new_bucket) at stackmap.c:317), so you keep the newest stack but lose the old one (and any counts keyed on the old stackid now point at the wrong frames).
Lesson: size stacks and counts to expected unique-stack cardinality. For most production servers, 16K–64K is fine. Profilers often go to 1M.
What to read in the kernel
kernel/bpf/stackmap.c— the implementation.stack_map_allocbuilds the map’s own structure (abuckets[]array plus a per-CPUpcpu_freelistof stack buffers — not the generichtab_map_alloc; seestruct bpf_stack_mapat:26), andbpf_get_stackid(:323) is the helper. Notestack_map_calculate_max_depth(:53) where the 127-cap clamp lives. Read the file once; ~800 lines.arch/x86/kernel/unwind_orc.c— the ORC unwinder x86_64 uses.orc_find(:209) andunwind_get_return_address(:380) are the heart of it. Don’t read deeply; just know it exists and is faster/more reliable than frame pointers.kernel/bpf/stackmap.c— searchbpf_get_stack(:514). The non-stackid version that copies frames directly.tools/lib/bpf/btf.candtools/perf/util/symbol.c— for inspiration on symbolization. The selftests don’t have a clean example.tools/testing/selftests/bpf/progs/stacktrace_map.c— minimal example of the pattern.
External reference (skim once): https://www.brendangregg.com/flamegraphs.html
Bullet Points
- A native call stack is a chain of return addresses pushed by
CALLinstructions. Unwinding recovers them leaf-first; that ordered list is the trace. (Distinct from the BPF program’s own R10 stack from Day 1/4.) - Two ways to unwind: frame pointers (
%rbplinked list, cheap but costs a register — why user stacks fail) and ORC (an out-of-band.orc_unwindtable the x86_64 kernel ships — why kernel stacks always work). BPF_MAP_TYPE_STACK_TRACEstores frame arrays keyed by hash; same stack → samestackid. Memory bounded by unique stacks.bpf_get_stackid(ctx, &stacks, flags)captures the current stack and returns a stackid. Use it as a key in another map for aggregation.BPF_F_USER_STACKwalks userspace — only works with frame pointers.- The syscall ladder
entry_SYSCALL_64 → do_syscall_64 → __x64_sys_read → ksys_read → vfs_readis the common base everyread()shares — the wide base of the flame graph. - 127-frame cap: the kernel clamps captured depth to
sysctl_perf_event_max_stack(defaultPERF_MAX_STACK_DEPTH = 127) regardless ofvalue_size. - Symbolization happens in userspace. Kernel frames:
/proc/kallsyms, root-only (kptr_restrict=1 zeros it), nearest-preceding-symbol (return addr is mid-function). User frames: subtract the load base from/proc/PID/maps(ASLR/PIE), thenaddr2line— except non-PIEET_EXEC. bpf_get_stack(no -id) copies frames directly to a buffer — preferred for per-event emission, not aggregation.- Flame graph format:
thread;fn1;fn2;fn3 countper line;flamegraph.plproduces interactive SVG.
Check question
Two CPUs simultaneously call bpf_get_stackid with identical stacks. Do they get the same stackid? Same map slot? Race?
Click to reveal answer
Answer: They get the same stackid (the hash of the frames is the same). They both target the same map slot. The kernel uses bucket-level locking inside the stack map — it compares the bucket with READ_ONCE(smap->buckets[id]) and installs with xchg(&smap->buckets[id], ...); one CPU’s insert wins and the other sees the existing entry and returns the same stackid without re-inserting. No race observable from BPF. The dedup is the whole point of this map type.
Tomorrow
Day 10: uprobes. Tracing functions in userspace binaries from BPF. We’ll attach to bash’s readline() and see every command typed.