Day 10 — Uprobes: tracing userspace from BPF
Today’s mission: trace a function in a userspace binary. Watch every command typed into bash by hooking
readline(). But first, understand the genuinely new machinery underneath: how an executable actually lives in memory, how the kernel patches a userspace instruction without corrupting it, and how it regains control when a function returns. Total time: ~110 minutes.
The other half of “what’s running on this machine”
Days 6–9 traced kernel functions. But your applications are mostly userspace — and many interesting events happen entirely in user code without touching syscalls (think: malloc, g_object_unref, PQexec, JIT compilation events).
Uprobes let BPF programs attach to userspace functions. The kernel patches the target binary’s executable pages with breakpoints; when any process executing that binary reaches the patched instruction, the trap fires and your BPF program runs.
It’s like kprobe — but the target is a function in /usr/bin/bash, /usr/lib/libssl.so.3, or your own myapp rather than vfs_read.
Here’s the thing the tutorials skip, though: tracing userspace code from the kernel is a genuinely different mechanism than the kernel-function patching you met earlier in the series. The closest kernel sibling is Day 7’s kprobe — the int3-trap path, not Day 1’s fentry (which patches a NOP→trampoline slot with no runtime trap). Three pieces of background make the difference, and the rest of today only makes sense once you have them:
- How an executable lives in memory — it isn’t copied into RAM; it’s
mmap’d from a file, and its pages are shared across every process running it. This is why one uprobe registration covers every bash on the system. - How the kernel patches a userspace instruction safely — it can’t just overwrite a shared, read-only, on-disk-backed page. It uses copy-on-write to get a private copy, writes a 1-byte
int3trap, and replays the displaced instruction out-of-line. - How the kernel regains control when a function returns — there’s no fixed instruction at a return site to patch, so it hijacks the return address. This is the whole trick behind uretprobes, which today’s lab depends on.
We’ll teach each as we hit the part of the lab that depends on it. Day 7’s kprobe used the same int3-trap primitive on kernel text in one shared address space; everything below is the userspace counterpart, and it is meaningfully different.
How an executable lives in memory: file-backed mmap, the page cache, and COW
Before we can patch a userspace instruction, we have to know where that instruction physically is. The intuition most people carry — “the program got loaded into RAM” — is wrong in a way that matters today.
A binary is not copied into RAM wholesale. When you run /usr/bin/bash, the loader does not slurp the file into memory. It mmap()s the file: it creates a file-backed mapping that says “this range of virtual addresses corresponds to these byte-offsets of this file.” The actual bytes are pulled in lazily, one page at a time, the first time the CPU touches them.
Where do those pages live? In the page cache — the kernel’s single, shared cache of file contents. A page of file data is keyed by (inode, file-offset): the inode identifies which file, the offset identifies which 4 KB chunk of it. (Recall the page from Day 1: physical RAM is handed out in PAGE_SIZE = 4 KB frames.) The crucial property:
Every process running the same binary maps the same physical pages. Two bash processes don’t each get their own copy of bash’s executable code. They both map the page-cache pages for (bash's inode, offset of .text), read-only and executable. One copy of the code in RAM, shared by all of them, plus the on-disk file backing it.
That shared page cache is exactly why a uprobe is system-wide. The breakpoint isn’t a property of a process — it’s a property of the inode. Because the probe is keyed to (bash-inode, readline's offset), the kernel walks every process (and every future mmap) that maps this inode and patches each one. It does not write once into the shared page-cache page to reach everybody — that would dirty a shared, file-backed page (exactly what the COW section below says it must avoid). The system-wide reach comes from the inode key plus the walk over all mappings, not from one shared write.
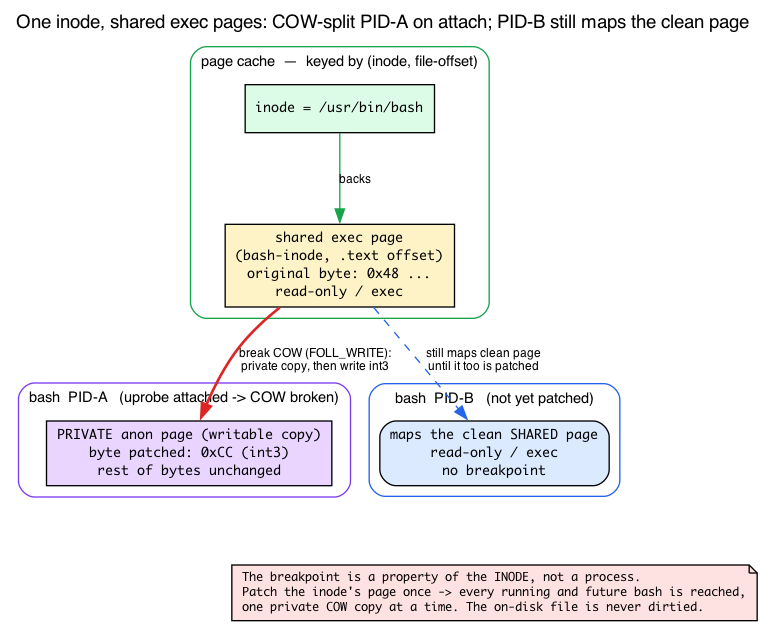
You can see the inode-identity in the kernel’s own data structure. A uprobe is identified by an inode pointer and a file offset — not a virtual address:
/* kernel/events/uprobes.c:62 — struct uprobe */
struct inode *inode;   /* the file the probe lives in (line ~69) */
loff_t        offset;  /* file-offset of the patched instruction (line ~74) */
And uprobe_register refuses a target that isn’t file-backed — there’d be no page cache to read the original instruction from:
/* kernel/events/uprobes.c:1402 */
/* copy_insn() uses read_mapping_page() or shmem_read_mapping_page() */
if (!inode->i_mapping->a_ops->read_folio &&
    !shmem_mapping(inode->i_mapping))
    return ERR_PTR(-EIO);
To remember the instruction it’s about to overwrite (so it can restore it on detach), the kernel reads the original byte straight out of the page cache, by offset:
/* kernel/events/uprobes.c:1058, inside __copy_insn() */
page = read_mapping_page(mapping, offset >> PAGE_SHIFT, filp);
offset >> PAGE_SHIFT is “which page of the file”; read_mapping_page pulls that page-cache page (__copy_insn at :1048, copy_insn at :1070).
Patching a shared page without corrupting it: copy-on-write
Now the problem. The page we want to patch is shared read-only across every process and backed by the on-disk file. If the kernel just wrote 0xCC into it, it would (a) hit every process at once with no control, and (b) risk dirtying a file-backed page. That’s not what we want — we want to patch one process’s view at a time.
The fix is copy-on-write (COW). COW is the trick that lets many mappings share one physical page until someone writes: at the moment of a write, the writer gets its own private writable copy of just that page, and everyone else keeps the original. The kernel forces that break deliberately before patching:
/* kernel/events/uprobes.c:518 — in uprobe_write() */
/*
 * When registering, we have to break COW to get an exclusive anonymous
 * page that we can safely modify. Use FOLL_WRITE to trigger a write
 * fault if required. ...
 */
if (is_register)
    gup_flags |= FOLL_WRITE | FOLL_SPLIT_PMD;   /* :526 */
It then verifies the page it got is a private anonymous folio before writing into it (the folio_test_anon check at :552). So the sequence per process is: break COW → the target process now has a private, writable, anonymous copy of that one page → write the int3 there. Other processes keep faulting on the clean shared page until they’re patched too.
This is what “COW protects other mappings” means, concretely. Day 7’s kprobe int3-poked kernel code: one address space, one copy, patched in place. Here the target is per-process userspace memory reached through a file-backed mapping, so the kernel must privately fork the page first. Genuinely different machinery.
The int3 trap and replaying the clobbered instruction
We’ve patched a byte. Two questions remain, and the second is the one every tutorial glosses over.
What byte, and what does it do? On x86_64 the breakpoint is a 1-byte instruction, 0xCC (int3), which raises the breakpoint exception:
/* arch/x86/include/asm/uprobes.h:20 */
#define UPROBE_SWBP_INSN      0xcc
#define UPROBE_SWBP_INSN_SIZE 1
set_swbp writes it; set_orig_insn restores it on detach — both go through the same uprobe_write_opcode / COW path above:
/* kernel/events/uprobes.c:612 */
int set_swbp(...)      { return uprobe_write_opcode(..., UPROBE_SWBP_INSN, true); }
/* kernel/events/uprobes.c:627 */
int set_orig_insn(...) { return uprobe_write_opcode(..., *(uprobe_opcode_t *)&auprobe->insn, false); }
When a thread executes that byte, the CPU traps into the kernel’s int3 exception entry (DEFINE_IDTENTRY_RAW(exc_int3) at arch/x86/kernel/traps.c:1004), which notifies the uprobe layer (uprobe_pre_sstep_notifier at kernel/events/uprobes.c:2871). The dispatcher handle_swbp (uprobes.c:2712) looks up the active uprobe by faulting address (find_active_uprobe_rcu, :2724) and runs your BPF program via handler_chain (:2549, the consumer’s handler is invoked at :2549–2566). The trap builds a pt_regs snapshot of the user registers — the same pt_regs you read with PT_REGS_PARM* on Day 7 — and hands it to your program.
Now the puzzle nobody explains. The original instruction is gone — you overwrote its first byte with 0xCC. After your BPF program runs, how does the thread execute the instruction it was supposed to, and continue?
The answer is execute-out-of-line (XOL). The kernel never removes the int3 during tracing; instead it keeps the saved original instruction and replays it elsewhere:
- At first hit, the kernel allocates a per-process executable scratch page — the
xol_area(struct xol_areaatkernel/events/uprobes.c:109). - It copies the saved original instruction (arch-fixed-up if needed) into a slot there (
xol_get_insn_slotat:1871; the bytes live inarch_uprobe.ixol[],arch/x86/include/asm/uprobes.h:33). - It points the user instruction pointer at that slot, single-steps that one instruction, then the arch post-XOL handler relocates the IP back into the original code stream —
default_post_xol_opappliesregs->ip += utask->vaddr - utask->xol_vaddr(arch/x86/kernel/uprobes.c:1240), landing right after the original instruction.
The 0xCC byte stays patched in the shared/COW page the whole time. So one uprobe hit costs: trap into the kernel (~50 ns) + your BPF program’s time + a single-step of the displaced instruction. Detach reverses everything — set_orig_insn writes the saved original byte back over the int3.
Why doesn’t this corrupt other threads? Because the int3 is never removed while tracing. Threads serialize through the trap; each one single-steps its own copy of the instruction in its own xol slot. No thread ever sees a half-patched instruction.
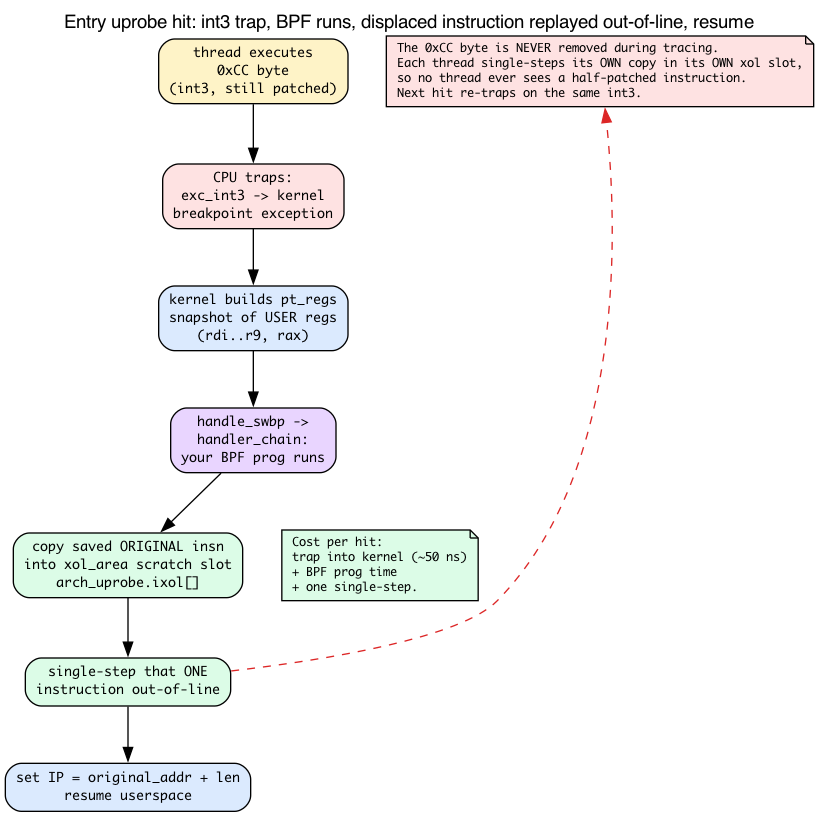
Tie it back to Day 7’s kprobe: same int3-trap primitive — overwrite the first byte, trap into the kernel, run your program. The difference is recovery: a kprobe single-steps the original instruction in place; a uprobe replays it out-of-line in a per-process XOL slot because the target is shared, file-backed userspace memory. (Day 1’s fentry is a different mechanism — a NOP→trampoline patch with no runtime trap.)
There are no Dumb Questions
Q: Does my uprobe affect other processes running the same binary?
A: Yes — by design. The breakpoint is per-binary-inode, not per-process (that’s the whole point of the page-cache section above: the patch is keyed to the inode, and every process maps the same inode’s pages). If you uprobe
/usr/bin/bash:readline, every running bash and every future bash gets the breakpoint until you detach. This is what lets you do system-wide observability without restarting workloads.Q: What if the target process exits while I’m attached?
A: Nothing breaks. The uprobe remains registered against the inode. New invocations get hooked. Old processes that exited just disappear. The uprobe lives until you detach (close the link FD).
Q: Can I uprobe a function in a JIT-compiled language (e.g., Java methods, V8 functions)?
A: Not with regular uprobes — those addresses don’t exist at attach time; they’re generated at runtime. The runtime would need to expose USDT probes (we’ll see those below) or generate
perf-PID.mapfiles for symbolization. For Java, the JVM can be configured to emit USDT events; tools like async-profiler use this.
Catching a return: return-address hijack and the trampoline
Everything above describes an entry uprobe: trap on a fixed instruction. But today’s lab hooks the return of readline() — because the line the user typed is readline’s return value, not an argument. And a return is a problem: there is no single fixed instruction at the return site to patch. A function can be called from a hundred places and ret to a hundred different addresses.
The kernel solves this with return-address hijacking. When the entry breakpoint fires for a function you’ve uretprobed, the kernel:
- Reads the real return address off the user stack.
- Saves it on a per-task stack of pending returns.
- Overwrites the stack’s return-address slot with the address of a kernel-installed userspace trampoline (
prepare_uretprobeatkernel/events/uprobes.c:2252; trampoline address fromuprobe_get_trampoline_vaddrat:2223).
When the function later runs its normal ret, control lands on the trampoline. On the pinned v7.1 kernel, for a native 64-bit process (the lab traces native x86_64 bash) the trampoline is not a breakpoint — arch_uretprobe_trampoline() (arch/x86/kernel/uprobes.c:349) hands back a short syscall sequence for user_64bit_mode(regs):
/* arch/x86/kernel/uprobes.c:320–343 — uretprobe_trampoline_entry */
push %rax
push %rcx
push %r11
mov  $__NR_uretprobe, %rax
syscall
/* uretprobe_syscall_check: pop %r11; pop %rcx; ret; int3 */
So when readline returns into the trampoline, it executes the uretprobe(2) syscall rather than trapping on an int3. SYSCALL_DEFINE0(uretprobe) (uprobes.c:372) validates the caller IP, then calls uprobe_handle_trampoline(regs) (uprobes.c:401; generic side at kernel/events/uprobes.c:2635) — that’s where your uretprobe consumers run and the real return address is restored.
The older int3 trampoline is still in the tree, but it’s now the fallback for 32-bit/compat processes (the asm even notes “the compat process still uses standard breakpoint”; the trailing int3 after ret is just a guard). On that path, handle_swbp recognizes the trampoline address specially:
/* kernel/events/uprobes.c:2718, in handle_swbp() — compat/fallback path */
if (bp_vaddr == uprobe_get_trampoline_vaddr())
    return uprobe_handle_trampoline(regs);
At that point your uretprobe BPF program runs, PT_REGS_RC holds the return value (for readline, the malloc’d char * the user typed), and the kernel restores the saved real return address so the caller resumes none the wiser.
Because calls nest, the kernel keeps a per-task LIFO stack of pending returns — utask->return_instances (walked at uprobes.c:2019, :2062; pushed at :2307). Each hijacked frame pushes one entry; each return pops the matching one in last-in-first-out order. That’s why a uretprobe fires correctly through deep recursion and many stack frames.
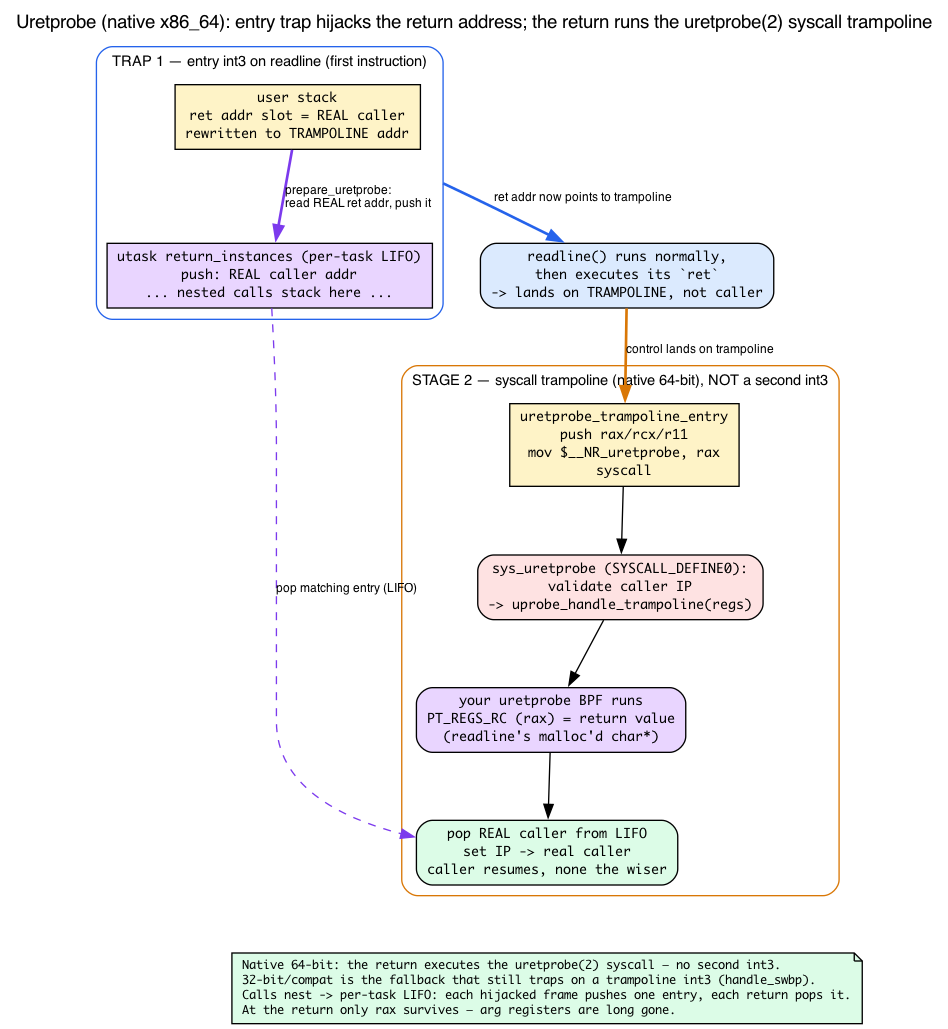
This is also why the lab declares the return value as the “first parameter” (more below): at the return trap there are no argument registers left to read — the arguments are long gone — only the return register survives. It’s the exact analogue of the kretprobe PT_REGS_RC you met on Days 6–7.
Where to attach: ELF anatomy
Your target binary is an ELF file. To attach by name, libbpf has to turn binary:symbol into the file offset the kernel registers against the inode. That resolution runs through the binary’s symbol tables — and you need to know there are two of them, because today’s Break 2 depends on the difference.
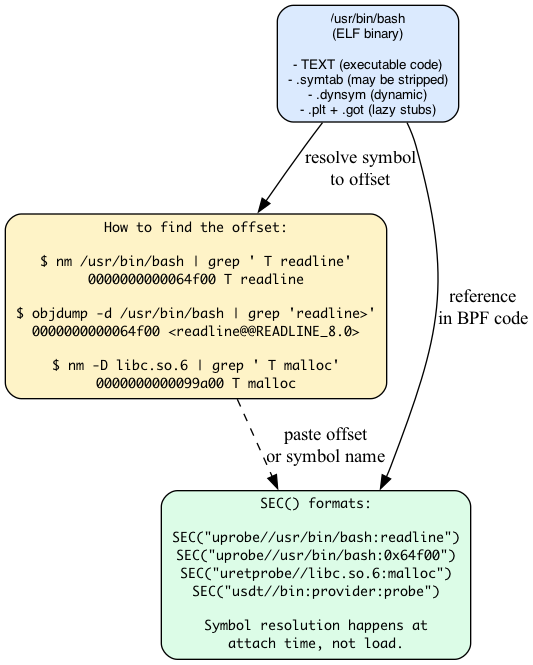
An ELF file can carry two symbol tables:
.symtab— the full symbol table: every function, including local/static helpers. This is whatstripdeletes to shrink a binary. A stripped/bin/bashhas an empty.symtab..dynsym— the dynamic symbol table: only the symbols needed for dynamic linking (a shared library’s exported functions, a binary’s imported symbols). It survives stripping, because the dynamic loader needs it at runtime to wire up shared libraries.
libbpf searches .dynsym first, then .symtab — and the source spells out exactly why that order, and why a missing section is normal rather than an error:
/* tools/lib/bpf/elf.c:278 */
int i, sh_types[2] = { SHT_DYNSYM, SHT_SYMTAB };
/* ...:306 — comment:
 * Search SHT_DYNSYM, SHT_SYMTAB for symbol. This search order is used because
 * if a binary is stripped, it may only have SHT_DYNSYM, and a fully-statically
 * linked binary may not have SHT_DYNSYM, so absence of a section should not be
 * reported as a warning/error.
 */
So the common path is just: write SEC("uprobe//path/to/binary:symbol_name"). libbpf opens the ELF (bpf_program__attach_uprobe at tools/lib/bpf/libbpf.c:12966 → elf_find_func_offset_from_file at :12817 → elf_find_func_offset at elf.c:277), finds the symbol, and computes its file offset from the symbol’s value and the ELF program-header layout. What the kernel ultimately registers is (inode, offset) — the offset must be page-alignable and within the file size (uprobe_register checks at kernel/events/uprobes.c:1407–1413).
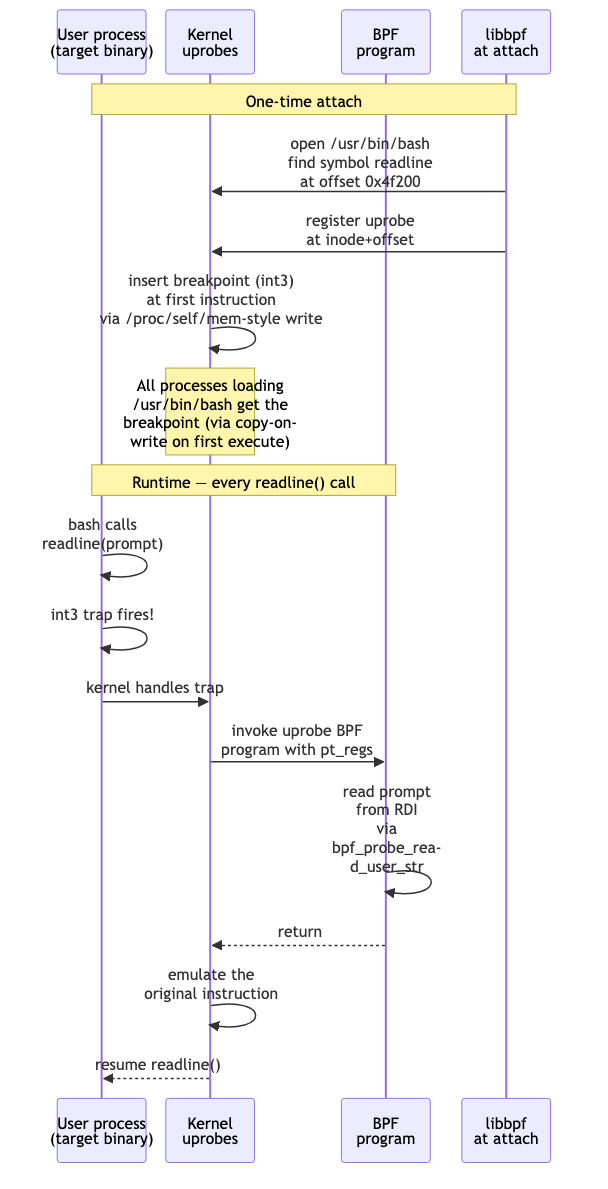
A subtlety worth holding onto for Break 2: the symbol’s recorded value is a virtual address, and the file offset libbpf needs are not always identical. For the common executable code segment they usually coincide, which is why the nm -D value can be handed to the kernel directly below. When a symbol exists in neither table (a private static in a stripped binary), you fall back to supplying the file offset yourself:
SEC("uprobe//usr/bin/stripped_app:0x1234")
Tools map onto the tables directly: nm -D / objdump -T read .dynsym; objdump -t reads .symtab (empty on a stripped /bin/bash); objdump -d disassembles so you can eyeball an offset when no symbol exists at all.
Argument access in uprobes
This is prerequisite knowledge you already have. Recall from Day 7: for a trap-based probe the ctx is a struct pt_regs * register snapshot, and BPF_KPROBE/BPF_KRETPROBE expand PT_REGS_PARM1..6 to the System V AMD64 argument registers (rdi, rsi, rdx, rcx, r8, r9), with PT_REGS_RC = rax for the return value (the macros live in tools/lib/bpf/bpf_tracing.h; Day 7 verified PT_REGS_PARM1 maps to di).
The only uprobe-specific twist: these macros work unchanged for userspace targets, because the int3 trap snapshots the user registers into the very same pt_regs shape. So: same as kprobes — args in rdi…r9, return in rax.
For string arguments, you need bpf_probe_read_user_str (not _kernel):
char buf[64];
bpf_probe_read_user_str(buf, sizeof(buf), (void *)PT_REGS_PARM1(ctx));
The “_user” variant tells the kernel “this address is in userspace; use copy_from_user semantics, not direct deref.” Misusing _kernel on a user pointer doesn’t crash: the kernel-nofault helper checks the address range first and rejects a userspace pointer up front (on x86, copy_from_kernel_nofault_allowed returns false for addr < TASK_SIZE_MAX, so strncpy_from_kernel_nofault returns -ERANGE — an address-range rejection, not an actual page fault), and bpf_probe_read_kernel_str then zeroes the destination buffer on the negative return.
USDT: probes built into binaries
What if your application wants to be observable? Some major libraries (libc, libpthread, postgres, mysql, openssh) ship with USDT probes — user-space statically defined tracing. These are nop instructions placed by the developer at points of interest, accompanied by ELF metadata describing the arguments.
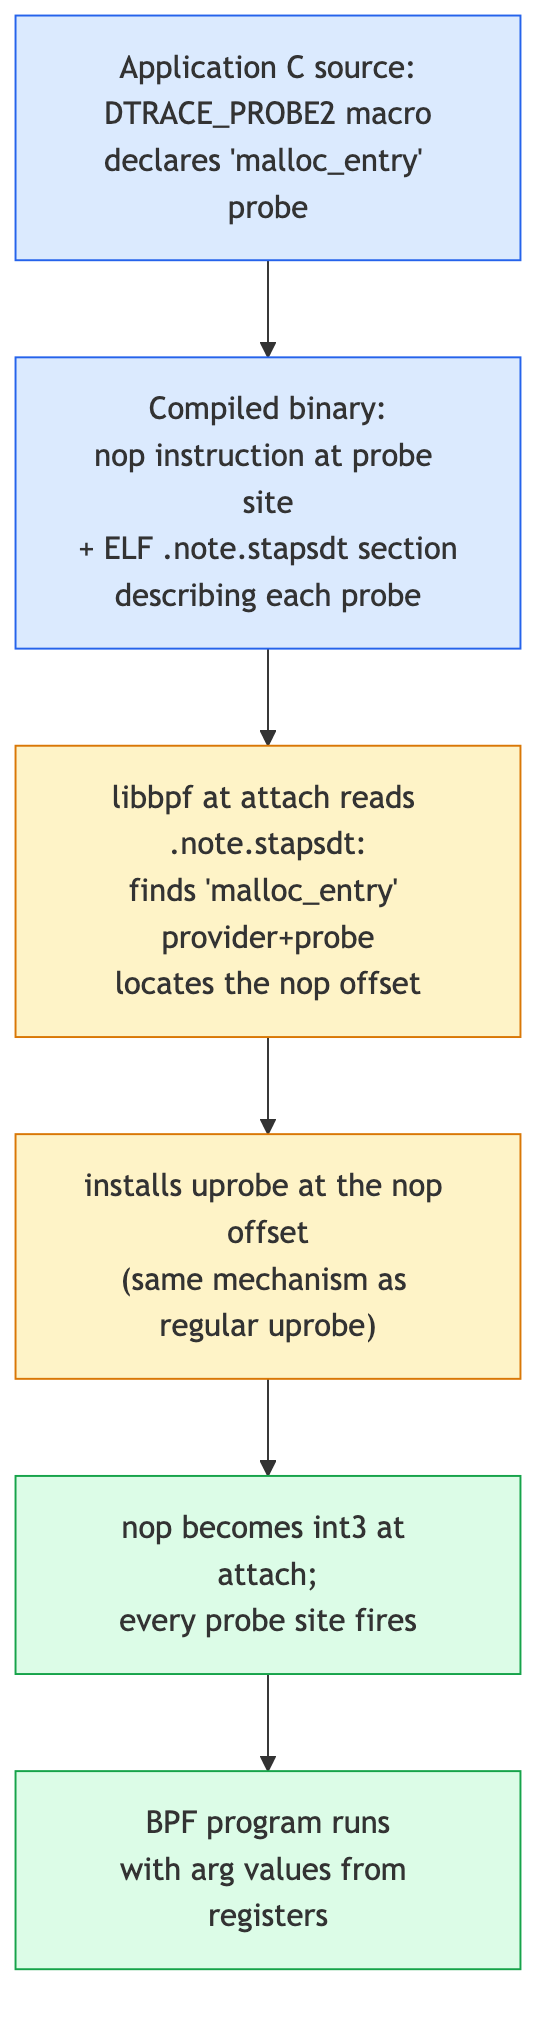
You attach with SEC("usdt//path:provider:probe"). libbpf reads the .note.stapsdt ELF section, finds the matching provider+probe, locates the nop offset, and installs a regular uprobe there.
Discover USDTs with:
sudo bpftrace -l 'usdt:/usr/lib/x86_64-linux-gnu/libc.so.6:*'
libc’s USDTs include lll_lock_wait, lll_lock_wait_private, setjmp, longjmp. Postgres has query__start, query__done. They’re a stable contract from the application.
Sharpen your pencil
Bash is a single-process per terminal session. You uprobe
readlineand observe nothing — but you’re definitely typing in another terminal. What’s wrong?.
.
.Answer: likely one of: (a) bash version mismatch — the bash on disk and the bash running might differ if you’re inside a shell started before a system upgrade. Restart your shell. (b) bash’s
readlinemay be statically linked or inlibreadline.so.8rather than the bash binary itself —nm /usr/bin/bash | grep readlineto confirm. If empty, attach to libreadline instead. (c) PATH issue —which bashgives one path; the running shell may have started from a different one (e.g.,/bin/bashsymlink resolution).
The lab
bashspy.h — the shared event record
#ifndef PRACTICAL_EBPF_BASHSPY_H
#define PRACTICAL_EBPF_BASHSPY_H

#define MAX_LINE 256

struct event {
    unsigned int pid;
    char comm[16];
    char line[MAX_LINE];
};

#endif
bashspy.bpf.c
The output channel is a ringbuf — recall it from Day 1: a kernel→userspace MPSC channel where you reserve a slot, fill it, and submit (zero-copy), and a single userspace consumer drains it via a callback. Nothing uprobe-specific; just the same pattern.
#include "vmlinux.h"
#include <bpf/bpf_helpers.h>
#include <bpf/bpf_tracing.h>

#include "bashspy.h"

char LICENSE[] SEC("license") = "GPL";

struct {
    __uint(type, BPF_MAP_TYPE_RINGBUF);
    __uint(max_entries, 256 * 1024);
} rb SEC(".maps");

/* Track the prompt arg per TID so we can read the result on return.
 * For readline, the *return value* is what the user typed —
 * a malloc'd char* the caller frees.
 */

SEC("uretprobe//bin/bash:readline")
int BPF_KRETPROBE(on_readline_ret, const char *line)
{
    if (!line) return 0;

    struct event *e = bpf_ringbuf_reserve(&rb, sizeof(*e), 0);
    if (!e) return 0;

    e->pid = bpf_get_current_pid_tgid() >> 32;
    bpf_get_current_comm(&e->comm, sizeof(e->comm));
    bpf_probe_read_user_str(&e->line, sizeof(e->line), line);

    bpf_ringbuf_submit(e, 0);
    return 0;
}
What’s new
SEC("uretprobe//bin/bash:readline")— uretprobe (return) on bash’s readline. The kernel will hijackreadline’s return address on entry and regain control at the trampoline, as the return section described. Adjust the path to your bash (which bash).BPF_KRETPROBE(on_readline_ret, const char *line)— for uretprobe, the first declared parameter after the function name is the return value, not an argument. (This is exactly why: at the return trap onlyPT_REGS_RC/raxsurvives — the argument registers are long gone.) Same as kretprobe.bpf_probe_read_user_str— user, not kernel. The pointer is in user memory.(const char *)cast in the parameter declaration — the macro will treat the return value as that type for size determination.
bashspy.c — userspace consumer
static int handle(void *ctx, void *data, size_t sz) {
    struct event *e = data;
    printf("[bash %u (%s)] %s\n", e->pid, e->comm, e->line);
    return 0;
}
Run
make
sudo ./bashspy &

# In another terminal, start a bash and type:
bash
echo hello
ls /tmp
Expected:
[bash 4001 (bash)] echo hello
[bash 4001 (bash)] ls /tmp
Don’t worry if your run doesn’t match this block line-for-line. The probe is system-wide, so you’ll also see the bash line you typed to launch the inner shell (the outer shell’s readline fired under a different PID), plus anything typed in any other interactive bash on the box. The PID will differ from 4001 — it’s arbitrary. And only interactive, readline-edited lines appear: commands fed via a script or a pipe never touch readline, so they won’t show up. Extra or missing lines here are normal, not a sign of a broken attach.
When you’re done, stop the spy and leave the test shell: run sudo kill %1 (or sudo pkill -f bashspy) in the first terminal to detach the uprobe, and exit the bash you spawned in the second terminal. Leaving bashspy running keeps the int3 breakpoint patched into every bash on the system — and an orphaned root daemon hanging around.
You’re now spying on every command typed into every bash on the system. For your own systems, treat this as a powerful debugging tool. For other people’s systems, this is the kind of thing that requires authorization.
What to break, in order
Break 1 — Path mismatch
SEC("uprobe//bin/bash:readline")
If your bash is at /usr/bin/bash (not /bin/bash), libbpf fails to attach:
libbpf: prog 'on_readline_ret': failed to attach: -ENOENT
The path has to resolve to the right inode — remember, the uprobe is registered against (inode, offset), so a wrong path means a wrong (or nonexistent) inode and the registration never happens. Fix: which bash and use the full path.
Break 2 — Stripped binary, missing symbol
Try a symbol that doesn’t exist in the table:
SEC("uprobe//bin/bash:internal_static_helper")
Resolution fails — libbpf can’t find internal_static_helper in .dynsym or .symtab. The job libbpf normally does for you is: search both symbol tables (dynsym first), look up the name, compute the file offset. When the name is gone (the binary is stripped, or the symbol is a private static that was never in .dynsym), you supply the offset yourself.
To see the fallback work, pick a symbol that does exist and grab its offset. /bin/bash is usually stripped of its .symtab, so objdump -t is empty — use the dynamic symbol table (.dynsym, which survives stripping) instead:
nm -D /bin/bash | grep -w readline
# 0000000000105e20 T readline
(objdump -T /bin/bash | grep -w readline shows the same thing — both read .dynsym.) That recorded value is a virtual address; for bash’s code segment it coincides with the file offset, so you can hand it to the kernel directly:
SEC("uprobe//bin/bash:0x105e20")
libbpf could have resolved readline by name — the offset form is exactly what you fall back to when the name isn’t available. (This 0x105e20 is bash-version-specific; always re-read it with nm -D for your binary rather than copying it verbatim.)
Break 3 — Use kernel-side _kernel_str on a user pointer
bpf_probe_read_kernel_str(&e->line, sizeof(e->line), line); /* WRONG */
The helper returns negative and the destination is zeroed. On x86 the kernel-nofault path doesn’t even fault: copy_from_kernel_nofault_allowed rejects a userspace address by range (addr < TASK_SIZE_MAX), so strncpy_from_kernel_nofault returns -ERANGE and bpf_probe_read_kernel_str zeroes the buffer. Always _user for uprobe-derived pointers.
Break 4 — Convert uretprobe to uprobe
SEC("uprobe//bin/bash:readline")
int BPF_KPROBE(on_call, const char *prompt)
{
    /* prompt is the *argument* — what bash is asking */
}
Now you’re at entry, not return — a single int3 on readline’s first instruction, no return-address hijack. So you see prompt strings ("$ ", "PS1", etc.) read from rdi/PT_REGS_PARM1 instead of typed lines. To get the typed line, you need to be at return, where the function gives back its result in rax. That’s what uretprobe is for.
Break 5 — Multi-args with mixed types
SEC("uprobe//usr/lib/libssl.so.3:SSL_write")
int BPF_KPROBE(on_ssl_write, void *ssl, const void *buf, int num)
{
    char preview[32] = {0};
    bpf_probe_read_user(preview, sizeof(preview) - 1, buf);
    bpf_printk("SSL_write %d bytes: %s", num, preview);
    return 0;
}
You’re now reading plaintext that’s about to be encrypted — ssl from rdi, buf from rsi, num from rdx, exactly the System V ordering from Day 7. (Don’t deploy this on someone else’s system.) Note: the libssl path varies by distro and even by process. Find the library actually loaded by your target with cat /proc/<pid>/maps | grep -i ssl — commonly /usr/lib/x86_64-linux-gnu/libssl.so.3 on Debian/Ubuntu, /usr/lib/libssl.so.3 on Arch, /usr/lib64/libssl.so.3 on Fedora/RHEL — since a process may also bundle its own OpenSSL. Update the SEC string to match the path you find. (Because libssl.so.3 is a shared library, its .dynsym exports SSL_write even when stripped — no offset fallback needed.)
What to read in the kernel
kernel/events/uprobes.c— overview. The functionuprobe_registeris the entry point. Notefind_uprobe_rcuandset_swbp/set_orig_insnfor the breakpoint patching mechanics.tools/lib/bpf/libbpf.c— searchbpf_program__attach_uprobe. This is where libbpf opens the ELF, resolves symbols, and registers the uprobe via the kernel’sperf_event_open.tools/testing/selftests/bpf/progs/uprobe_multi.c— multi-uprobe (next day’s topic) examples.Documentation/trace/uprobetracer.rst— the kernel’s doc on uprobes from a tracing perspective.tools/lib/bpf/usdt.c— USDT support in libbpf. The.note.stapsdtparser is here.
External: Brendan Gregg’s USE method posts and bpftrace examples for uprobe usage patterns.
Bullet Points
- An executable isn’t copied into RAM — it’s
mmap’d from a file, and its pages live once in the page cache, keyed by (inode, file-offset) and shared read-only/exec across every process running it. - A uprobe is identified by
(inode, offset), not a virtual address. That’s why it’s system-wide: the kernel walks every running and future process that maps the inode and patches each — no app changes, no restarts. - Patching a userspace instruction uses copy-on-write. The kernel breaks COW to get a private writable page, then writes a 1-byte
int3(0xCC) — it never dirties the shared/on-disk page. - The clobbered instruction is replayed out-of-line (XOL). The
int3stays patched; each thread single-steps its own saved copy in its own xol slot, then resumes after the original. - Uretprobes hijack the return address. On entry the kernel saves the real return address on a per-task LIFO stack and redirects the return to a trampoline
int3; at the return trapPT_REGS_RCholds the result. SEC("uprobe//path:symbol")for entry;SEC("uretprobe//...")for return.BPF_KPROBE/BPF_KRETPROBEmacros work for uprobes too — samept_regsctx, args inrdi…r9, return inrax(Day 7).- String args use
bpf_probe_read_user_str(not_kernel). - Two ELF symbol tables:
.symtab(full, removed bystrip) and.dynsym(dynamic, survives stripping). libbpf searches dynsym→symtab; when a symbol’s in neither, fall back to a literal file offset (nm -D/objdump -d). - USDT probes are nops + ELF metadata, intentionally placed by app authors. Attached via
SEC("usdt//path:provider:probe").
Check question
Why is bpf_probe_read_user_str necessary instead of just dereferencing the userspace string pointer directly?
Click to reveal answer
Answer: Two reasons. (1) Memory safety: the user pointer might be invalid (NULL, freed, mid-tearing of the calling process); direct deref would oops the BPF program. bpf_probe_read_user_str uses copy_from_user semantics that fault-handle gracefully, returning -EFAULT if the memory isn’t accessible. (2) Address-space awareness: uprobes fire in process context with the user’s mm active, but the BPF runtime treats userspace memory as “untrusted” and requires the explicit helper that knows it’s reading from the user page tables. The Verifier rejects raw deref of pointers from pt_regs for the same reason.
Tomorrow
Day 11: multi-{u,k}probe — efficient attach to many functions at once. The newer batch-attach mechanism that scales to thousands of probes without thousands of perf_event_open syscalls.