Day 11 — Multi-probe: attach to many functions in one syscall
Today’s mission: trace every filesystem syscall (read, write, open, close, fsync, …) with one BPF program attached to all of them at once. Along the way, learn the third attach mechanism the kernel has — fprobe — that makes batch-attaching a thousand functions cheap, how a glob like
vfs_*becomes a sorted array of addresses, and how one program tells its N probes apart. Total time: ~95 minutes.
The problem with one-by-one
Yesterday’s uprobes attach one function at a time. That works for a handful of probes. But what if you want to trace every syscall? Every function in the VFS layer? Every TCP entry point?
In the old model, you’d loop in userspace:
for (int i = 0; i < N; i++) {
    bpf_program__attach_kprobe(prog, false, names[i]);  /* one syscall each */
}
For N=200, that’s 200 perf_event_open syscalls, 200 kernel kprobe objects, 200 BPF links. Startup takes seconds. Memory grows linearly. Detach is similarly slow.
Multi-probe (added in kernel 5.18, commit 0dcac272540 for kprobe.multi) is the modern fix.
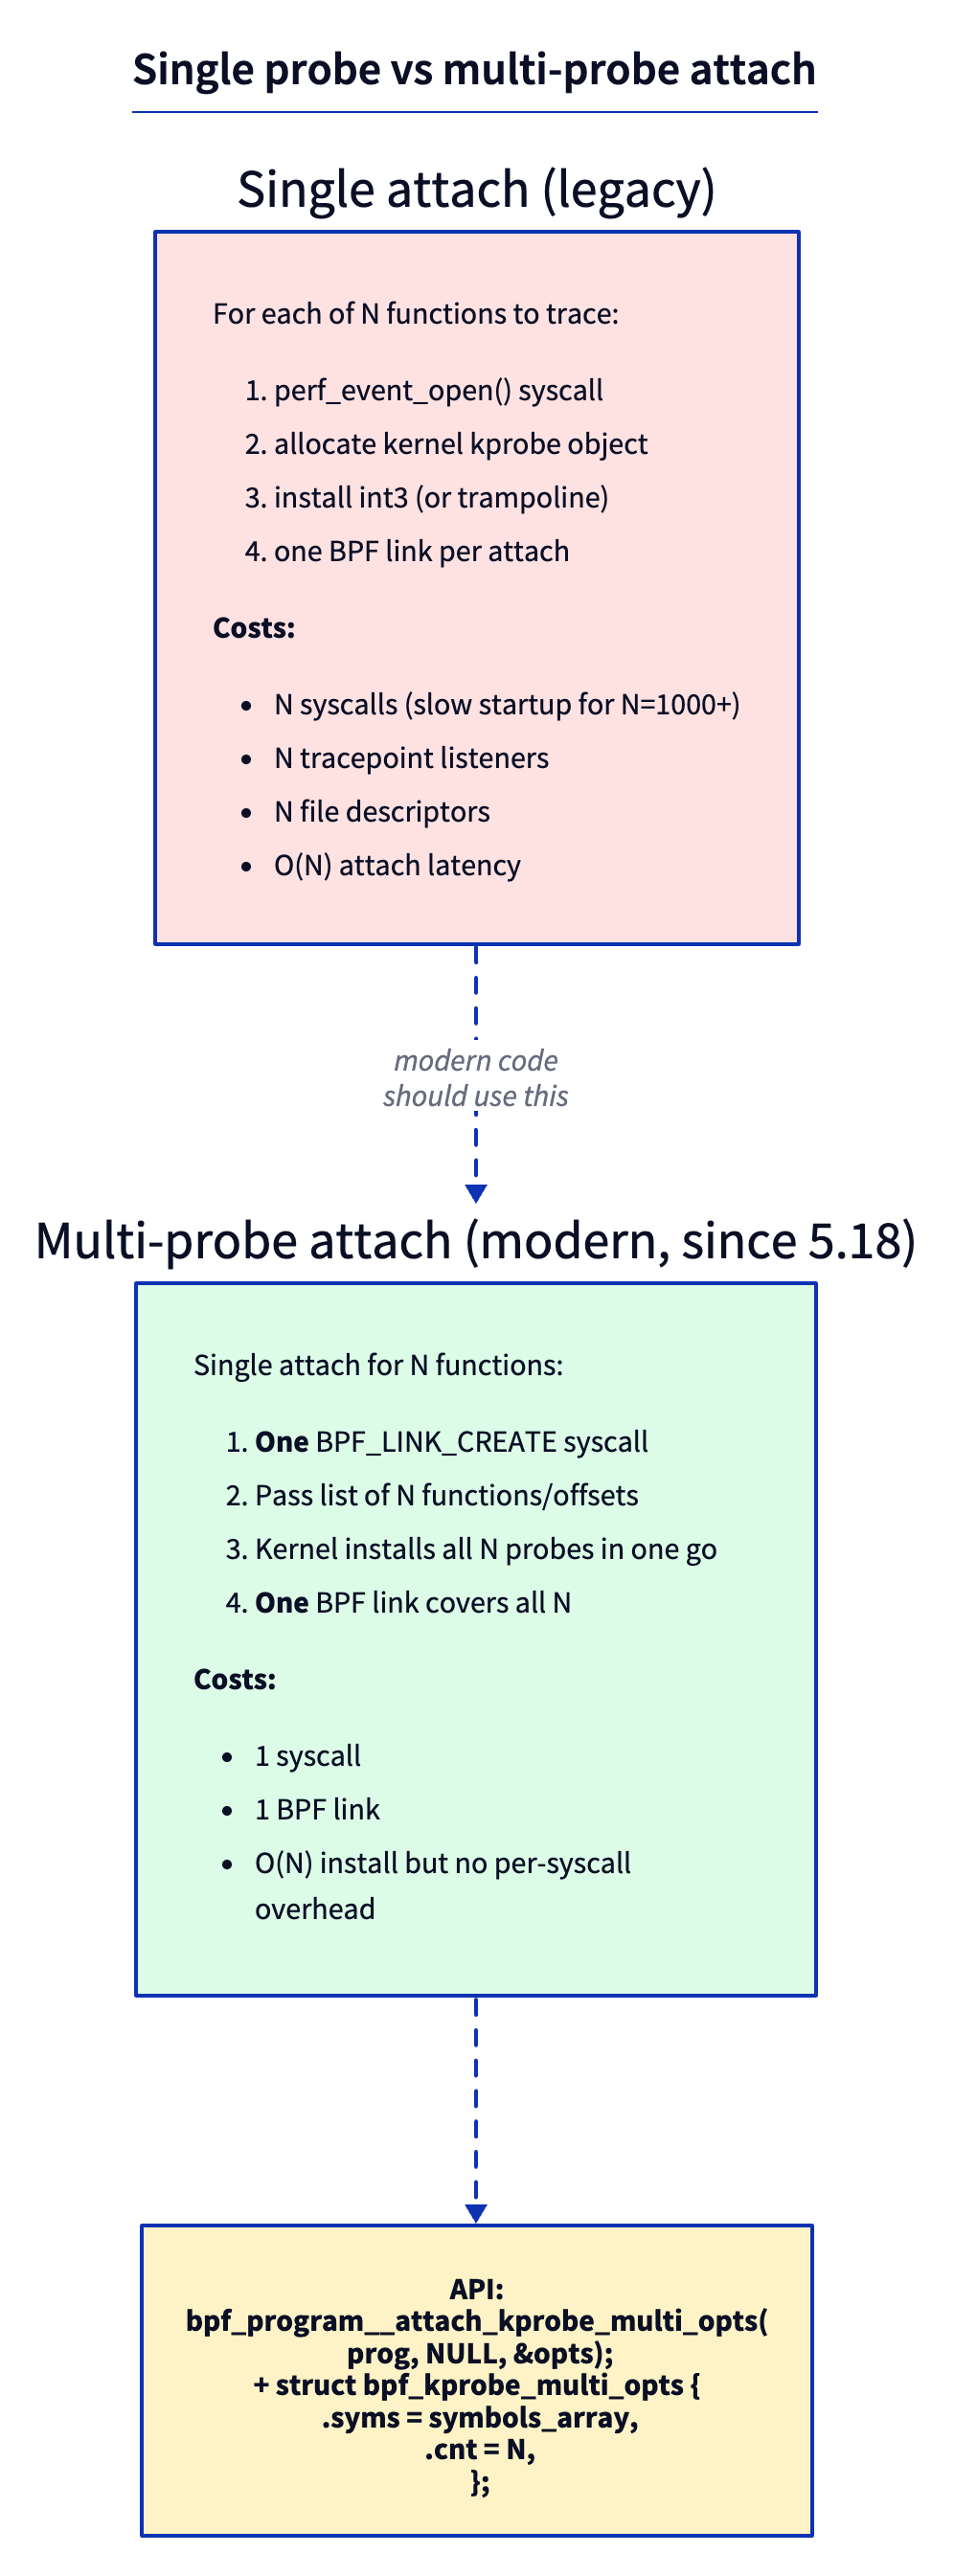
One syscall, one BPF link, N probes installed in one kernel-side batch.
But “one kernel-side batch” is doing a lot of work in that sentence, and the whole performance story of this chapter rests on how the batch is installed and run. Day 1 introduced fentry’s trampoline path and contrasted it with the older kprobe int3 trap; Day 6 added fexit. Today there’s a third attach mechanism, and it’s the one kprobe.multi rides on. Let’s name it before we lean on it.
What “fprobe-backed” actually means
Recall the two attach mechanisms Day 1 introduced (with fexit added in Day 6):
- kprobe patches the target instruction with an
int3software breakpoint. When the CPU hits it, it traps — a relatively expensive exception that vectors into the kprobe handler, which eventually calls your BPF program. One breakpoint per function. - fentry/fexit (Days 1 and 6) use ftrace’s 5-byte NOP patch-site that every function carries at its entry, and route through a per-target BPF trampoline — a small chunk of generated code wired to one function. No trap; execution flows straight through. Cheaper per call, but one trampoline per attach target.
kprobe.multi is built on a third thing, also ftrace-based, called an fprobe.
The intuition first. Imagine you want a breakpoint on a thousand functions. The kprobe way is a thousand independent text-pokes — a thousand int3 bytes written into a thousand call sites, a thousand kernel objects to track. The fprobe way is one client that says to ftrace: “here is a sorted array of a thousand addresses; call me when execution reaches any of them.” ftrace already maintains the machinery to multiplex many call sites onto shared handler code (it’s how ftrace function tracing itself works). An fprobe is one customer of that machinery registered against a whole array at once.
Concretely, an fprobe is a single small struct:
/* include/linux/fprobe.h:62 */
struct fprobe {
    unsigned long       nmissed;          /* counter for missed events */
    unsigned int        flags;
    size_t              entry_data_size;
    fprobe_entry_cb     entry_handler;    /* called on function entry */
    fprobe_exit_cb      exit_handler;     /* called on function return */
    struct fprobe_hlist *hlist_array;     /* hash of the IPs this fprobe covers */
};
One struct fprobe, one entry_handler, an hlist_array of the addresses it covers. That’s why N functions install in one batch instead of N separate int3 patches.
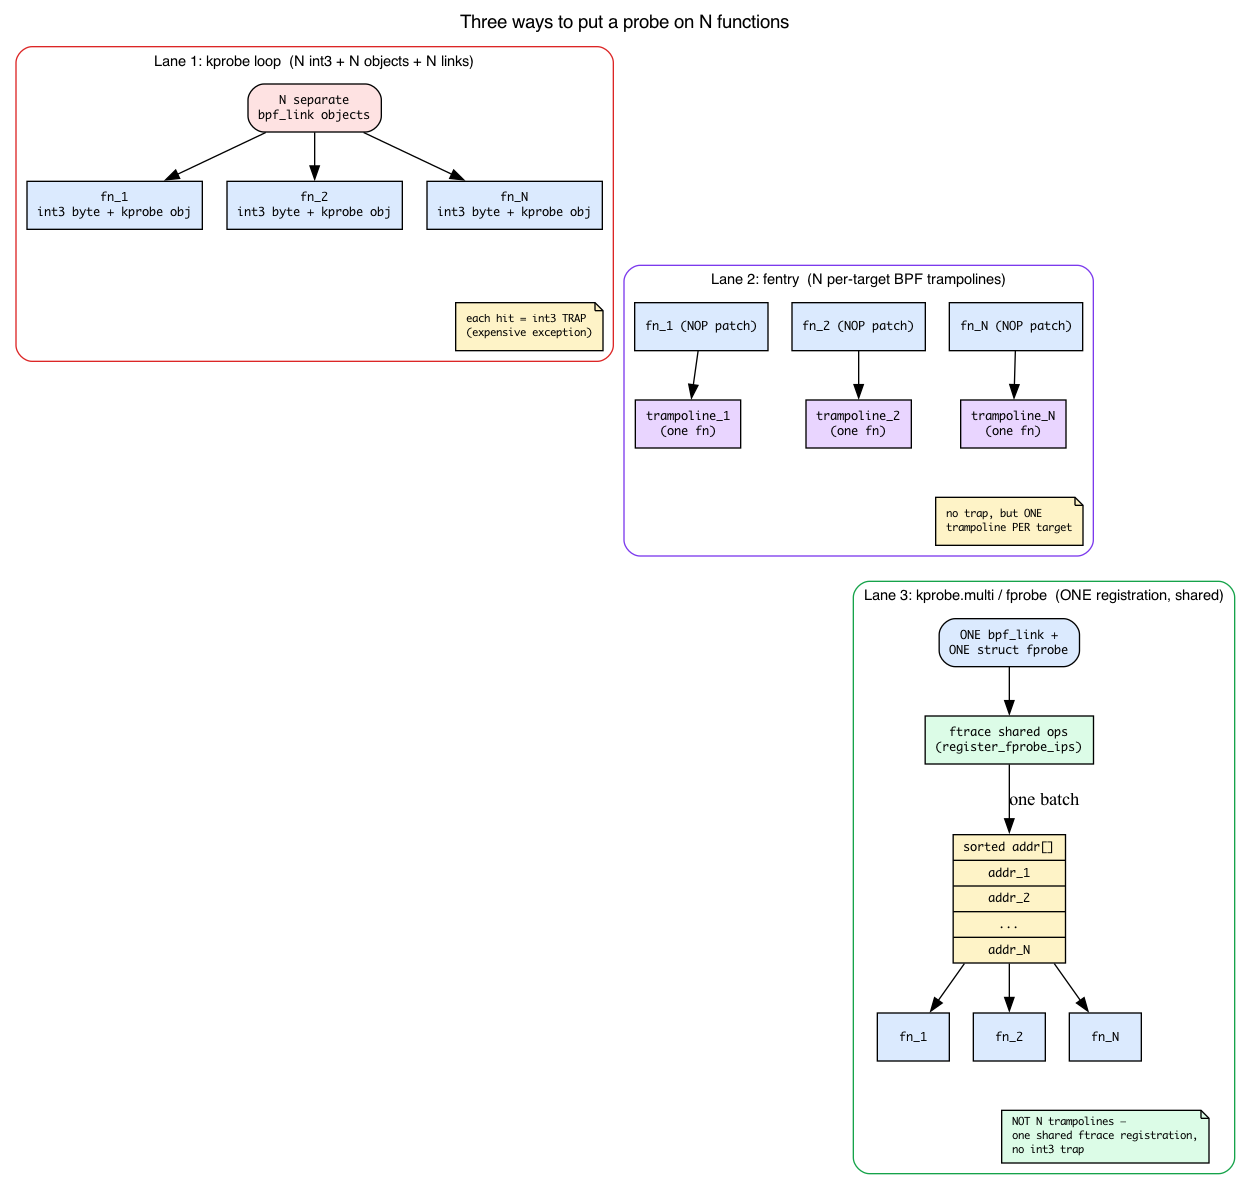
fprobe is not fentry’s trampoline
It is tempting to assume fprobe reuses the per-target BPF trampoline Day 1 described. It does not, and the distinction matters. fprobe hangs off ftrace’s shared graph/ops machinery. You can see the fork in the source:
/* kernel/trace/fprobe.c:982 — register_fprobe_ips() */
if (fprobe_is_ftrace(fp))
    ret = fprobe_ftrace_add_ips(addrs, num);
else
    ret = fprobe_graph_add_ips(addrs, num);
Depending on whether the probe needs a return/exit handler, registration routes to ftrace’s ftrace_ops path or its function-graph (fgraph) path. Neither is a per-function BPF trampoline. The honest one-sentence statement is:
fprobe is ftrace-based like fentry — so it avoids the
int3trap — but it isftrace_ops/fgraph, not a per-function BPF trampoline.
That distinction doesn’t weaken the performance argument; it sharpens it. Here is the real reason kprobe.multi beats a one-by-one kprobe loop, on both axes:
- Install is one ftrace operation over a sorted address array, not N separate
int3text-pokes. The kernel registers a single fprobe covering the wholeaddrs[]array (register_fprobe_ips(&link->fp, addrs, cnt)). - At runtime there is no
int3trap. Execution reaches the shared ftrace handler directly — the exact same reason fentry beats kprobe in Day 1.
The ceiling, and the hard requirement
A single multi-attach is capped. The kernel defines:
/* kernel/trace/bpf_trace.c:44 */
#define MAX_KPROBE_MULTI_CNT (1U << 20)   /* ~1,048,576 */
and rejects anything larger up front in bpf_kprobe_multi_link_attach:
/* kernel/trace/bpf_trace.c — inside bpf_kprobe_multi_link_attach */
if (!cnt)
    return -EINVAL;
if (cnt > MAX_KPROBE_MULTI_CNT)
    return -E2BIG;
So the “1000 functions” number in this chapter has a real ceiling of ~1M addresses; over that you get -E2BIG. (And zero matches gets -EINVAL — hold that thought for Break 4.)
Finally, the whole mechanism is gated on a config option. kprobe.multi requires CONFIG_FPROBE=y. Without it, the entire attach entry point compiles down to a stub:
/* kernel/trace/bpf_trace.c:2890 — the #else /* !CONFIG_FPROBE */ branch */
int bpf_kprobe_multi_link_attach(const union bpf_attr *attr, struct bpf_prog *prog)
{
    return -EOPNOTSUPP;
}
That’s why, without CONFIG_FPROBE, attach fails outright with -EOPNOTSUPP rather than silently degrading to a slow loop. (The full prerequisite check is in the Run section below.)
From glob to addresses: who does what
SEC("kprobe.multi/vfs_*") hides a two-stage pipeline that is easy to blur into one step. The honest split is the opposite of the tempting guess: for a glob, userspace (libbpf) does both the glob expansion and the name→address resolution; the kernel just receives a ready-made array of addresses and registers it. Let’s walk both sides.
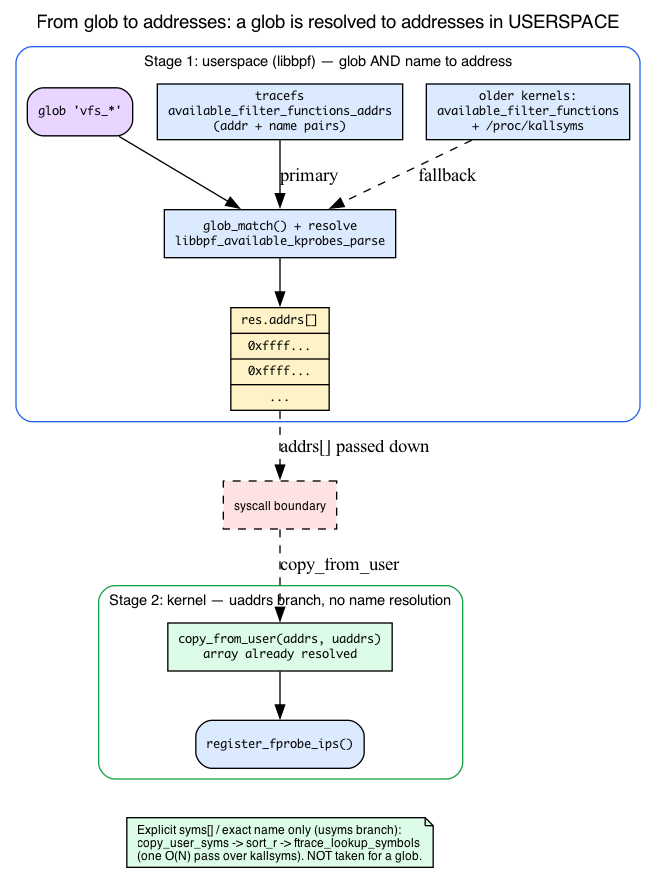
Userspace side (libbpf). Day 9 already taught you /proc/kallsyms: kptr_restrict zeroes the addresses for non-root, the file is not address-sorted, and you find a symbol by scanning for the nearest preceding entry. (We use exactly that fact for the lookup_ksym sketch later.) But for a SEC("kprobe.multi/glob") attach, libbpf may not need /proc/kallsyms at all — it depends on what tracefs exposes. The precedence is:
/* tools/lib/bpf/libbpf.c — inside bpf_program__attach_kprobe_multi_opts */
if (has_available_filter_functions_addrs())
    err = libbpf_available_kprobes_parse(&res);   /* modern: addr+name pairs */
else
    err = libbpf_available_kallsyms_parse(&res);   /* fallback: names + kallsyms */
On a modern kernel, tracefs exposes available_filter_functions_addrs — a file listing each instrumentable function as an address + name pair. libbpf_available_kprobes_parse reads addresses straight out of it, globs the names, and never opens /proc/kallsyms (this devbox has that file). On older kernels lacking it, libbpf falls back to libbpf_available_kallsyms_parse, which globs the names from available_filter_functions and then calls libbpf_kallsyms_parse (which fopens /proc/kallsyms) to turn those names into addresses. Either way the result is the same: libbpf produces a resolved res.addrs array in userspace. Using available_filter_functions (rather than raw kallsyms) for the name set matters: it already excludes notrace and inlined functions you could never attach to, so the glob can’t hand back a name that’s doomed to fail.
Kernel side. libbpf sets lopts.kprobe_multi.addrs = addrs and syms = NULL, so the kernel takes the address branch. It validates that exactly one of the two is set, then just copies the array in and moves on:
/* kernel/trace/bpf_trace.c — inside bpf_kprobe_multi_link_attach */
if (!!uaddrs == !!usyms)
    return -EINVAL;            /* exactly one of addrs[] or syms[] */
...
if (uaddrs) {                  /* glob path: addresses already resolved */
    if (copy_from_user(addrs, uaddrs, size))
        return -EFAULT;
} else {                       /* explicit names path: resolve in-kernel */
    err = copy_user_syms(&us, usyms, cnt);
    sort_r(us.syms, cnt, ...);
    err = ftrace_lookup_symbols(us.syms, cnt, addrs);
}
For a glob the kernel never sees names: it copy_from_users the address array and goes straight to register_fprobe_ips. The in-kernel name→address resolution (copy_user_syms → sort_r → ftrace_lookup_symbols) is the other branch — taken only when the caller passes an explicit opts.syms[] list or a single exact (wildcard-free) name. That path is where the chapter’s single-O(N)-pass-over-kallsyms story actually lives; see Break 1.
The single-pass detail (the usyms branch only). It is easy to assume ftrace_lookup_symbols is N independent log-N lookups into kallsyms. It is actually a single O(N) pass:
/* kernel/trace/ftrace.c:9262 — ftrace_lookup_symbols doc block */
/* ... kallsyms_on_each_symbol() with binary search into the sorted input
 * array.
 * Returns: 0 if all provided symbols are found, -ESRCH otherwise.
 */
The kernel walks kallsyms once (kallsyms_on_each_symbol), and for each symbol it sees, does a bsearch into your already-sorted name array. That’s why the names get sorted first: so the single pass can binary-search them. One sweep over kallsyms, not N sweeps. And if even one name doesn’t resolve, the whole attach fails with -ESRCH. Again, this only runs for the explicit-names path, not for a glob.
So the failure modes split by path:
- Glob, zero matches (
vfs_xyz_nope*expands to nothing): caught in userspace —libbpf_available_kprobes_parse/libbpf_available_kallsyms_parsereturn-ENOENTwhenres.cnt == 0, before any syscall. The kernel’sif (!cnt) return -EINVALnever runs (it only fires if a caller explicitly passescnt == 0through the opts API). This is Break 4. - Explicit names, one doesn’t resolve: the kernel’s
ftrace_lookup_symbolsreturns-ESRCH. Only theusymsbranch can hit this.
How to know which probe fired
When 50 functions all run the same BPF program, you need a way to tell them apart. The ctx (the saved registers) has the same shape for every target, so it can’t distinguish them — the only thing that differs is which function’s entry you’re sitting at. That’s what bpf_get_func_ip(ctx) gives you, and it’s worth understanding where that IP actually comes from, because it’s the load-bearing dispatch primitive for the whole chapter.
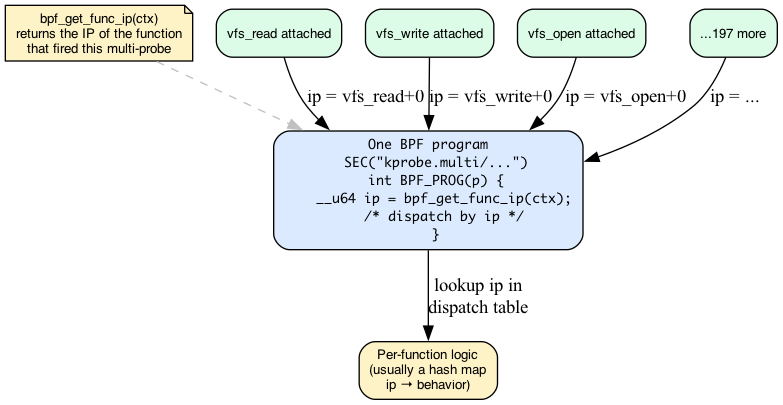
Where the IP comes from. When a target fires, fprobe calls the entry handler with the fentry_ip — the instrumented call site. The kprobe.multi handler converts that to the actual function entry address and stashes it in the per-invocation run context:
/* kernel/trace/bpf_trace.c:2592 — kprobe_multi_link_handler */
err = kprobe_multi_link_prog_run(link, ftrace_get_entry_ip(fentry_ip),
                                 fregs, false, data);
/* kernel/trace/bpf_trace.c:2319 — ftrace_get_entry_ip() */
unsigned long ip = ftrace_get_symaddr(fentry_ip);
return ip ? : fentry_ip;       /* resolved symbol address, or the call site */
So by the time your program runs, the resolved function entry address is already sitting in the run context.
bpf_get_func_ip is not one helper. The verifier swaps in a program-type-specific implementation depending on what kind of probe you are. For kprobe.multi it resolves to bpf_get_func_ip_kprobe_multi:
/* kernel/trace/bpf_trace.c:1080 */
BPF_CALL_1(bpf_get_func_ip_kprobe_multi, struct pt_regs *, regs)
{
    return bpf_kprobe_multi_entry_ip(current->bpf_ctx);
}
It just reads the entry IP that the handler already stashed in current->bpf_ctx. The selection happens in the verifier when it sees is_kprobe_multi(prog):
/* kernel/trace/bpf_trace.c:1327 */
case BPF_FUNC_get_func_ip:
    if (is_kprobe_multi(prog))
        return &bpf_get_func_ip_proto_kprobe_multi;
That’s why the helper is cheap: it’s a context read, not a symbol lookup at runtime. The expensive part (resolving the address) happened once, in the handler.
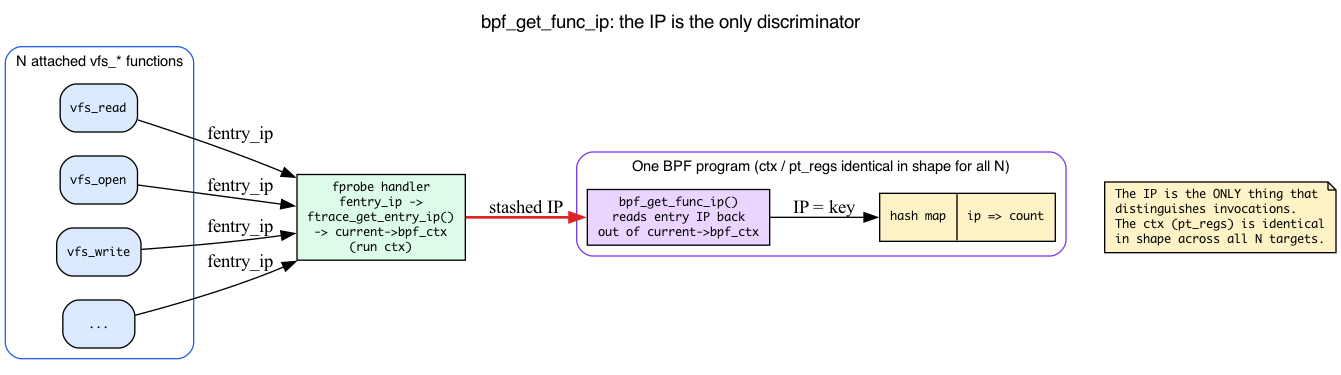
You typically use the returned IP as a key in a hash map: IP → count, or IP → behavior. Strip out bpf_get_func_ip (Break 3) and every one of the N probes increments the same counter, because nothing else in the program distinguishes them — attribution is gone.
One link owns all N attachments
Day 1 introduced bpf_link (BPF_LINK_CREATE wires a program to an attach point); Day 10 showed that a probe lives until you close the link’s FD. Nothing new to teach there — just one new point worth a sentence.
The same single link object covers all N functions:
/* kernel/trace/bpf_trace.c:2291 */
struct bpf_kprobe_multi_link {
    struct bpf_link link;
    struct fprobe   fp;          /* the one fprobe covering all N */
    unsigned long  *addrs;       /* the N resolved addresses */
    u64            *cookies;
    u32             cnt;         /* N */
    ...
};
/* kernel/trace/bpf_trace.c:2828 */
bpf_link_init(&link->link, BPF_LINK_TYPE_KPROBE_MULTI, ...);
One struct bpf_kprobe_multi_link, holding one struct fprobe, the addrs/cookies arrays, and the count. Closing its one FD detaches all N — versus the N separate links the one-by-one loop creates. That’s the whole “detach is one operation” claim, made concrete.
What the VFS layer is (and why vfs_* is the right glob)
The lab globs vfs_*. Day 6 first used vfs_read as an example target and Day 7 reused it, but no chapter has said what the VFS is — and you shouldn’t have to take “glob vfs_* to catch all filesystem activity” on faith.
The Virtual File System is the kernel’s filesystem-agnostic layer. Every read(), write(), open(), close() syscall funnels through a vfs_* entry point — vfs_read (fs/read_write.c:554), vfs_write (fs/read_write.c:668), vfs_open (fs/open.c:1074), and friends — before the kernel dispatches to the concrete filesystem driver (ext4, xfs, btrfs, …) that actually backs the file. The VFS is the common chokepoint; the concrete FS is what sits below it.
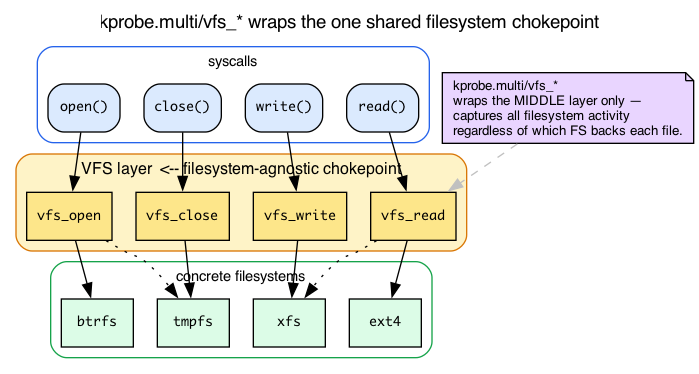
That single fact is why hooking vfs_* with one glob is the right aggregation point: it captures all filesystem activity in one place, no matter which filesystem each file lives on. You don’t need VFS internals beyond this — the companion linux-net book and general kernel background go deeper; here you only need to know vfs_* are the shared filesystem entry points.
There are no Dumb Questions
Q: Is multi-kprobe just syntactic sugar over a loop?
A: Functionally similar; operationally very different. The kernel-side install path is shared (one fprobe registered via ftrace against a list of addresses), the BPF link is a single object, and there’s no
int3trap at runtime. For 1000 functions, multi-kprobe attaches in ~10 ms; the loop version takes seconds.Q: Can I use multi-probe with a wildcard pattern?
A: Yes. libbpf supports glob patterns in
attach_kprobe_multi_opts.syms.tcp_*matches every TCP function. Internally libbpf reads tracefsavailable_filter_functions_addrs(oravailable_filter_functionsplus/proc/kallsymson older kernels) and resolves the glob to addresses in userspace, then hands the kernel a ready-made address array — the kernel justcopy_from_users it and registers the fprobe. (The in-kernel name→address resolution only runs when you pass an explicitsyms[]list instead of a glob.)Q: Does multi-probe exist for fentry?
A: No — there’s no
fentry.multi/fexit.multi. fentry/fexit build one trampoline per attach target, with no batched multi-attach variant in libbpf or the kernel. If you need to hook many functions at once with low per-call overhead, usekprobe.multi(which is fprobe-backed and very cheap) and read the return value via the kprobe ctx.Q: Multi-uprobe?
A: Yes — added in 6.6.
SEC("uprobe.multi/..."). Same idea for userspace targets.
The lab
multi.bpf.c
This listing is included from the file the lab build and CI compile:
#include “vmlinux.h” #include <bpf/bpf_helpers.h> #include <bpf/bpf_tracing.h>
char LICENSE[] SEC(“license”) = “GPL”;
struct { __uint(type, BPF_MAP_TYPE_HASH); __uint(max_entries, 4096); __type(key, __u64); /* function ip / __type(value, __u64); / count */ } hits SEC(“.maps”);
SEC(“kprobe.multi/vfs_*”) int BPF_KPROBE(on_any_vfs) { __u64 ip = bpf_get_func_ip(ctx); __u64 *c = bpf_map_lookup_elem(&hits, &ip); if (c) { __sync_fetch_and_add(c, 1); } else { __u64 one = 1; bpf_map_update_elem(&hits, &ip, &one, BPF_NOEXIST); } return 0; }
SEC("kprobe.multi/vfs_*") — the suffix after kprobe.multi/ is a glob. libbpf expands it (via tracefs available_filter_functions, as we saw) into maybe 50 function names starting with vfs_, the kernel resolves those to addresses, and bpf_get_func_ip(ctx) returns the entry IP of whichever one fired — the key the hash map aggregates on.
multi.c — userspace
struct multi_bpf *skel = multi_bpf__open_and_load();
multi_bpf__attach(skel);

while (!exiting) {
    sleep(2);
    /* iterate hits map; resolve ip via /proc/kallsyms */
    int fd = bpf_map__fd(skel->maps.hits);
    __u64 key = 0, next, val;
    while (bpf_map_get_next_key(fd, &key, &next) == 0) {
        bpf_map_lookup_elem(fd, &next, &val);
        printf("%-30s %llu\n", lookup_ksym(next), val);
        key = next;
    }
}
lookup_ksym(addr) is a sketch, not supplied code — it’s a few-line function you write that scans /proc/kallsyms for the closest symbol at or below addr: parse each addr type name line, keep the entry with the largest address <= addr. (This is exactly the nearest-preceding-symbol scan Day 9 taught — and note it reads /proc/kallsyms, the symbolization file, not the available_filter_functions file the glob used.) Without it the program won’t link. To skip writing a symbolizer, print the raw IP with %llx instead and pipe each value through grep <hex> /proc/kallsyms by hand. Note /proc/kallsyms only exposes real addresses to root (kptr_restrict zeroes them otherwise), so run the binary with sudo.
Run
Prerequisite:
kprobe.multiis fprobe-backed, so the kernel must be built withCONFIG_FPROBE=y(kernel >= 5.18), plusCONFIG_DEBUG_INFO_BTF=yfor thevmlinux.hinclude. Check withgrep -E 'CONFIG_FPROBE|CONFIG_DEBUG_INFO_BTF' /boot/config-$(uname -r)(orzgrepon/proc/config.gz). WithoutCONFIG_FPROBEthe attach fails outright —bpf_kprobe_multi_link_attachis the-EOPNOTSUPPstub we saw above.
make
sudo ./multi &
# Generate work in another terminal:
find /etc -type f | xargs cat > /dev/null
Expected (assuming you wrote the lookup_ksym sketch above — otherwise the left column is raw hex IPs):
vfs_read       12453
vfs_open        2914
vfs_statx       1822
vfs_getattr_nosec  2914
...
Row order is arbitrary: the userspace loop walks the map with bpf_map_get_next_key, which returns keys in hash order, not ranked by count — so your rows may appear shuffled (the counts above aren’t sorted either). Only the per-function counts matter; pipe through sort -k2 -rn if you want them ranked.
You attached to ~50 functions in one syscall, watched all of them, and aggregated by function — without writing 50 separate handlers.
Same lesson as a one-liner
If you’d rather not assemble the C glue (in particular the lookup_ksym symbolizer), bpftrace gives you the whole lesson in one copy-pasteable program. The vfs_* glob is expanded and attached via kprobe.multi — the same path as SEC("kprobe.multi/vfs_*") in multi.bpf.c — and the func builtin plays the role of bpf_get_func_ip, telling you which of the vfs_* functions fired:
# Terminal 1 — one program, many functions, attributed by func():
sudo bpftrace -e 'kprobe:vfs_* { @[func] = count(); } interval:s:5 { exit(); }'
# Terminal 2 — generate VFS load:
find /etc -type f | xargs cat > /dev/null
Expected (counts vary run to run; the highest-traffic VFS paths dominate, and bpftrace prints @-maps sorted ascending by value):
Attached 78 probes

@[vfs_write]: 524
@[vfs_fstatat]: 1744
@[vfs_statx]: 2823
@[vfs_open]: 4719
@[vfs_fstat]: 4897
@[vfs_getattr_nosec]: 7742
@[vfs_read]: 20960
bpftrace resolves the names directly via func, so this version sidesteps the lookup_ksym glue entirely.
What to break, in order
Break 1 — Specific list instead of glob
SEC("kprobe.multi")
int BPF_KPROBE(p) { ... }
In userspace:
LIBBPF_OPTS(bpf_kprobe_multi_opts, opts);
const char *syms[] = {"vfs_read", "vfs_write", "vfs_open"};
opts.syms = syms;
opts.cnt = 3;
bpf_program__attach_kprobe_multi_opts(skel->progs.p, NULL, &opts);
This gives you precise control over which functions to attach. Use when a glob would over-match. (libbpf still feeds these names through copy_user_syms → sort_r → ftrace_lookup_symbols on the kernel side — the same resolution path, you’ve just skipped the glob expansion.)
Break 2 — Mixing offsets
const __u64 addrs[] = {0xffffffff812a4000, ...};
opts.addrs = addrs;     /* numeric addresses */
opts.cnt = N;
You can pass raw kernel addresses too. Useful when symbols are aliased or you have addresses from another source (perf, kallsyms parsed yourself). With opts.addrs the kernel skips name resolution entirely — it just copy_from_user(addrs, uaddrs) into the link’s array and goes straight to register_fprobe_ips. No ftrace_lookup_symbols step.
Break 3 — Forget bpf_get_func_ip
Without it, every probe just increments the same counter — you lose per-function attribution. Run, then realize you can’t tell which vfs_* was called. The reason is exactly what the dispatch section showed: the ctx (pt_regs) is identical in shape across all N targets, so the entry IP is the only thing distinguishing one invocation from another. Lesson: always identify the source when one program serves many probes.
Break 4 — Multi-probe on a function that doesn’t exist
SEC("kprobe.multi/this_function_does_not_exist*")
Glob expands to zero matches. libbpf fails attach with -ENOENT (the kernel side would reject cnt == 0 with -EINVAL; libbpf surfaces the empty resolution as -ENOENT). Friendly: silent acceptance with zero matches would mask bugs.
What to read in the kernel
kernel/trace/bpf_trace.c— searchbpf_kprobe_multi_link_attach. The function that handles the new link type.kernel/bpf/syscall.c— searchBPF_TRACE_KPROBE_MULTI. The syscall dispatch.tools/lib/bpf/libbpf.c— searchbpf_program__attach_kprobe_multi_opts. The userspace API.tools/testing/selftests/bpf/progs/kprobe_multi.c— official test/examples.
Bullet Points
- Multi-probe attaches one BPF program to many functions in a single syscall (~10ms for 1000 vs seconds for one-by-one).
- It’s fprobe-backed: one
struct fproberegistered via ftrace against a sortedaddr[]array (register_fprobe_ips). fprobe is ftrace-based like fentry — so noint3trap — but it’sftrace_ops/fgraph, not a per-function BPF trampoline. Cheap to install (one ftrace op, not N text-pokes) and cheap at runtime (no trap). Capped atMAX_KPROBE_MULTI_CNT = 1<<20;CONFIG_FPROBE=yrequired or attach returns-EOPNOTSUPP. - Glob → addresses, resolved in userspace. For a glob, libbpf does both the expansion and the name→address resolution: it reads tracefs
available_filter_functions_addrs(oravailable_filter_functions+/proc/kallsymson older kernels), produces an address array, and the kernel justcopy_from_users it and registers the fprobe — no in-kernel name resolution. Thesort_rnames +ftrace_lookup_symbolssingle O(N) pass over kallsyms (bsearch into the sorted input) runs only for an explicitsyms[]list or an exact wildcard-free name. SEC("kprobe.multi/glob")for glob attach; or pass an explicit list viabpf_kprobe_multi_opts.syms, or raw addresses via.addrs(which skips name resolution).bpf_get_func_ip(ctx)lets the program know which function fired. It’s a per-program-type helper (bpf_get_func_ip_kprobe_multi) that just reads the entry IP the handler stashed incurrent->bpf_ctx— cheap, no runtime symbol lookup. The IP is the only discriminator; without it, all N probes increment one counter.- One
bpf_link(struct bpf_kprobe_multi_link, holding onefpand theaddrs/cookies/cnt) owns all N attachments; closing its FD detaches all N. - The VFS is the kernel’s filesystem-agnostic layer; every read/write/open/close syscall funnels through a
vfs_*entry before dispatching to the concrete FS — which is whyvfs_*is the right one-glob aggregation point. - Variants:
kprobe.multi,kretprobe.multi,uprobe.multi(6.6+). There is nofentry.multi/fexit.multi.
Check question
You attach kprobe.multi/tcp_* and observe bpf_get_func_ip returning some IPs that don’t match what cat /proc/kallsyms | grep tcp_ shows. What might cause this?
Click to reveal answer
Answer: bpf_get_func_ip returns the resolved function entry address — the handler ran ftrace_get_entry_ip(fentry_ip) (which is ftrace_get_symaddr(fentry_ip) ?: fentry_ip) and stashed it in current->bpf_ctx, and the helper just reads it back. That entry address is exactly what you’d compare against a symbol start in /proc/kallsyms — but: (a) KASLR can shift symbols across boots, so resolve at the same boot you traced in. (b) Some functions have aliases — multiple symbols at the same IP — so the IP may match a different name than you grepped for. (c) On older kernels bpf_get_func_ip returned the trampoline call site, off by a few bytes from the symbol. Use bpf_get_func_ip consistently for all comparisons rather than mixing it with kallsyms-derived addresses.
Tomorrow
Day 12: sleepable BPF programs. The constraint that’s been quietly limiting you (no helpers that fault) and how to relax it.